Volume or aggregate full

A full volume is the one storage problem users understand at once: they see “No space left on device” or “There is not enough space on the disk”, and work stops.

The fix sounds easy, add space, but two traps catch people. The space is often eaten by Snapshot copies, not user files, and with thin provisioning a volume can show free space while the aggregate underneath has none.

You’ll fill a volume through snapshot spill, free it safely, then fill an aggregate under a thin volume and move the volume out of trouble.

Where this lesson fits

Lesson 52 of 56 in NetApp ONTAP Storage Administration · Phase 4: Troubleshooting blueprint · Before this: Lesson 51, high latency on a FlexVol · Next: Lesson 53, LIF and network problems

TimeYou needBy the end you can
55 minutesThe practice shell with setup-p4.txt from Lesson 47Find what is using a full volume, free space without losing data, and tell a full volume from a full aggregate

What it is, in one line

A volume or aggregate is full when ONTAP can’t give a write any more blocks: either the volume has used its own size (often because of Snapshot copies), or a thin volume’s aggregate has run out of physical space.

In Simple Words

A cupboard inside a store room

Your team has a cupboard in the office store room. The cupboard can fill up with files, and also with old photocopies someone keeps “just in case”, which quietly take half the shelves.

The manager also promised every team a big cupboard, more than the store room can really hold, betting that nobody fills theirs completely. If they all fill up at once, your cupboard still has empty shelves but there’s no floor space left in the room to put anything.

The cupboard is the volume, the photocopies are Snapshot copies, and the store room is the aggregate.

Engineer's View

How an engineer describes it

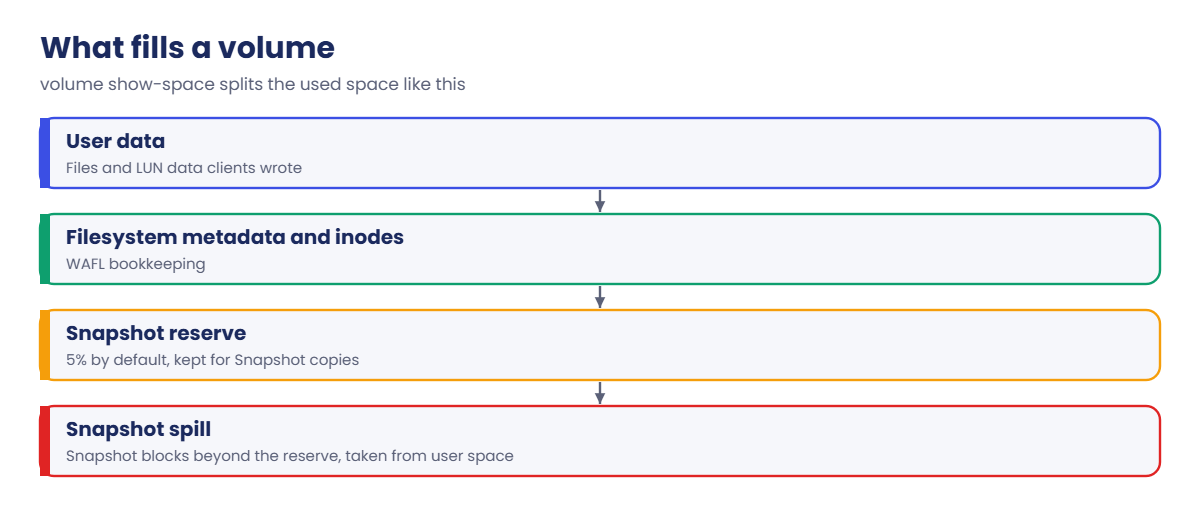
A FlexVol has a size, and part of it (5% by default for NAS volumes) is the Snapshot reserve. When Snapshot copies hold more changed blocks than the reserve, the extra spills into the space users see, so df shrinks even though nobody wrote new files. volume show-space breaks the used space into user data, metadata, Snapshot reserve and spill.

With -space-guarantee none (thin provisioning) a volume only takes aggregate blocks as data is written, so you can promise more than the aggregate holds. If the aggregate fills, every thin volume on it fails writes at once, and their Available column drops to 0 even while percent-used looks fine.

ONTAP warns with EMS events such as monitor.volume.nearlyFull and wafl.vol.full. Tools to stay ahead: volume autosize (grow up to a maximum), Snapshot autodelete, sensible Snapshot policies, and aggregate alerts well before 90%.

How it works, step by step

1What the user sees

Linux users see “No space left on device” (ENOSPC) and Windows users see “There is not enough space on the disk”. Databases on LUNs may stop, and a LUN can even go offline (Lesson 48). Note which volume or share it is.

ONTAP volume full: what fills a volume, from user data to snapshot spill

2Where to look, in order

QuestionCommandWhat to look for
How full is the volume?volume show -fields size,used,available,percent-usedAvailable near 0
What is using it?volume show-spaceSnapshot Spill, big metadata, or real user data
Which snapshots are big?volume snapshot showOld or manual copies holding many blocks
Is the aggregate full?storage aggregate showUsed% near 100, Available near 0
What else lives there?volume show -aggregate <aggr> -fields size,used,space-guaranteeMany thin volumes, total size far above the aggregate
When did it start?event log show -severity <=ERRORnearlyFull and full events

3How to fix a full volume

Grow it (volume modify -size) and turn on autosize, delete Snapshot copies nobody needs (check with the owner, and never delete one a SnapMirror relationship depends on), or clean up data from the client side. Adjust the Snapshot policy so it can’t happen again.

ONTAP volume full: how to tell a full volume from a full aggregate

4How to fix a full aggregate

Move volumes to an aggregate with space (volume move works while clients stay connected), add disks, delete unused volumes, or tier cold data with FabricPool. Then fix the habit: track overcommitment and alert at 80% aggregate use. In System Manager, Storage › Volumes and Storage › Tiers show capacity bars and let you resize or move volumes.
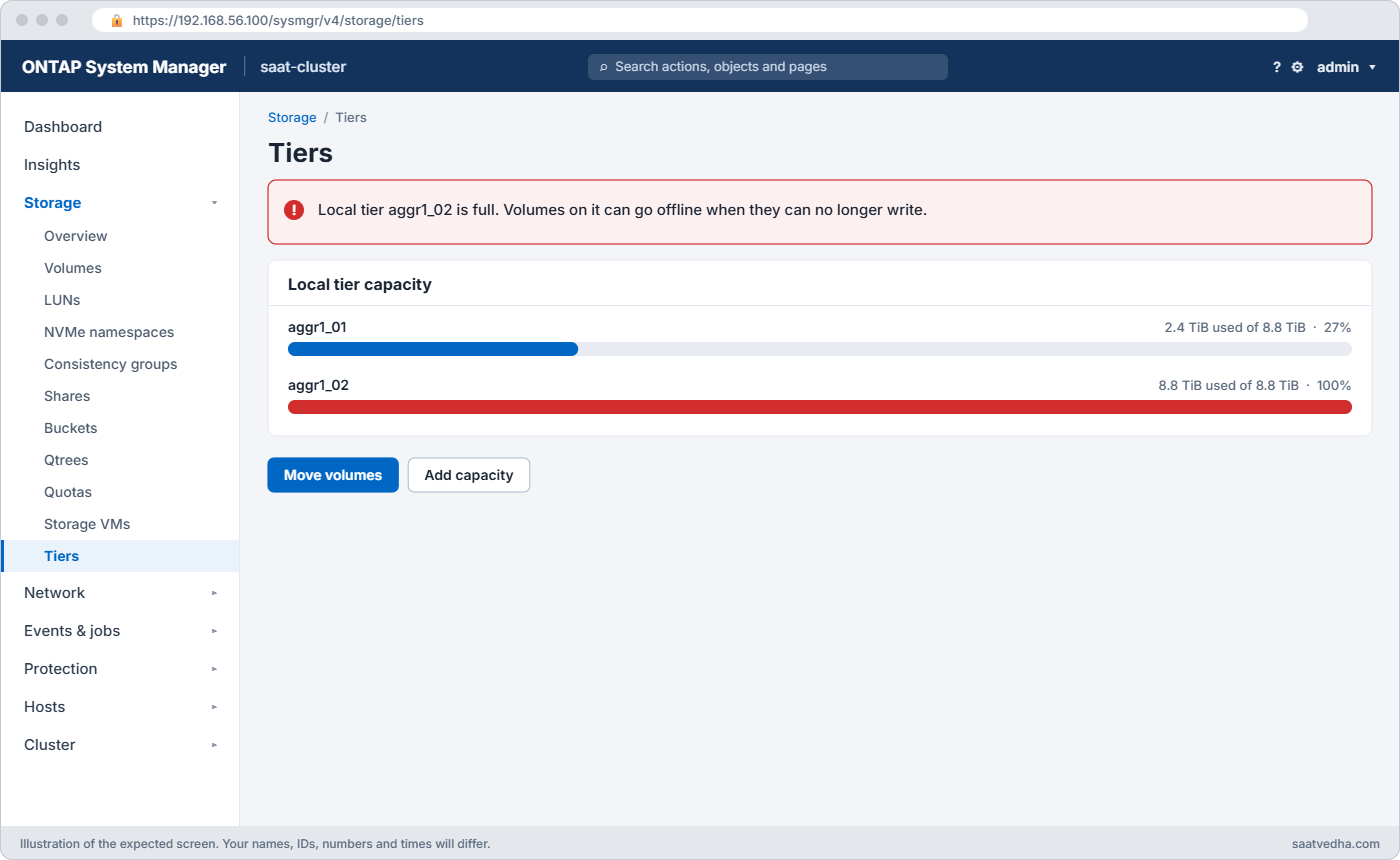
ONTAP aggregate full at 100% in System Manager Storage Tiers
System Manager: aggr1_02 is full; move volumes or add capacity.

Hands-on lab: a share that runs out of space

Before you run any command, double-check it

Read every command twice before you press Enter. Check the target: the server name, the user, the disk or device name, the path and the sizes. These commands are for learning and were tested in our lab, not on your system. At work, run the read-only commands first, follow your change process, make sure a backup exists, and ask a second person to check anything that changes or deletes data. You run them at your own risk.

This lab uses the SaatVedha ONTAP practice shell, our own learning tool. It is not NetApp software: real ONTAP output looks like this but is not identical.

1Create a home share and a safety snapshot

Reset and run setup-p4.txt, log in, and set up a thin 100 GB volume. simctl write and simctl overwrite play users adding and changing files.

volume create -vserver svm1 -volume vol_home -aggregate aggr1_02 -size 100g -junction-path /home -space-guarantee none
simctl write svm1 vol_home 60g files
volume snapshot create -vserver svm1 -volume vol_home -snapshot before_cleanup
simctl overwrite svm1 vol_home 30g

The last line warns you:

Note: Snapshot copies now use 30GB, more than the 5% reserve (5GB). The extra spills into the active file system space.
Client changed 30GB of existing data in svm1:vol_home.

Real ONTAP doesn’t print that note; you’d only find out later. Changing 30 GB of files means the snapshot now keeps 30 GB of old blocks.

✅ Checkpoint: You see the spill note.

2A user can’t save

simctl write svm1 vol_home 20g files

You’ll get this:

simctl: write failed. The client sees "No space left on device". Volume vol_home is full (85.03GB used of 95GB usable).

✅ Checkpoint: The write fails with No space left on device.

3Find what is using the space

volume show -vserver svm1 -volume vol_home -fields size,used,available,percent-used
volume show-space -vserver svm1 -volume vol_home
volume snapshot show -vserver svm1 -volume vol_home

You should see this:

vserver volume   size  used    available percent-used
------- -------- ----- ------- --------- ------------
svm1    vol_home 100GB 85.03GB 9.97GB    90%
saat-cluster::> volume show-space -vserver svm1 -volume vol_home
Vserver : svm1
      Volume  : vol_home
Feature                                    Used      Used%
      --------------------------------     ----------     ------
      User Data                               60.03GB        60%
      Filesystem Metadata                     246.1MB         0%
      Inodes                                  15.11MB         0%
      Snapshot Reserve                            5GB         5%
      Snapshot Spill                             25GB        25%
Total Used                                 90.29GB        90%
Total Physical Used                        90.03GB        90%
saat-cluster::> volume snapshot show -vserver svm1 -volume vol_home
                                                                 ---Blocks---
Vserver  Volume   Snapshot                                  Size Total% Used%
-------- -------- ------------------------------------- -------- ------ -----
svm1     vol_home
                  before_cleanup                            30GB    30%   33%

Users only have 60 GB of files. The other 25 GB of “used” space is Snapshot Spill from one manual snapshot someone forgot. The 20 GB write needed more than the 9.97 GB left.

✅ Checkpoint: You can say how much is user data and how much is spill.

Practice shell: 25 GB of snapshot spill from one forgotten snapshot
Only 60 GB of user files, but one snapshot holds 30 GB of old blocks.

4Free it, and stop it happening again

Confirm with the owner that before_cleanup isn’t needed, then delete it and turn on autosize:

volume snapshot delete -vserver svm1 -volume vol_home -snapshot before_cleanup
volume modify -vserver svm1 -volume vol_home -autosize-mode grow -max-autosize 150g
simctl write svm1 vol_home 20g files
volume show -vserver svm1 -volume vol_home -fields size,used,available,percent-used,autosize-mode,max-autosize

You should see this:

Client wrote 20GB to svm1:vol_home.
saat-cluster::> volume show -vserver svm1 -volume vol_home -fields size,used,available,percent-used,autosize-mode,max-autosize
vserver volume   size  used    available percent-used autosize-mode max-autosize
------- -------- ----- ------- --------- ------------ ------------- ------------
svm1    vol_home 100GB 80.03GB 14.97GB   84%          grow          150GB

✅ Checkpoint: The write works and autosize is on with a 150 GB limit.

Break It, Then Fix It

Now a full volume where the volume itself has plenty of room.

1Fill the aggregate underneath

Start again: reset, run setup-p4.txt, create vol_home and write 60 GB as in step 1 (no snapshot this time). Then other teams fill aggr1_02:

simctl break aggr-fill aggr1_02 100
simctl write svm1 vol_home 10g files

You’ll get this:

simctl: write failed. The client sees "No space left on device" (ENOSPC). Aggregate aggr1_02 is full (thin volume vol_home could not get blocks).

✅ Checkpoint: The write fails.

2Read the clues

volume show -vserver svm1 -volume vol_home -fields size,used,available,percent-used
storage aggregate show
event log show -severity <=ERROR

You’ll see this (aggregate list shortened):

vserver volume   size  used    available percent-used
------- -------- ----- ------- --------- ------------
svm1    vol_home 100GB 60.03GB 0B        63%
...
aggr1_01    8.80TB    8.75TB    1% online       2 saat-cluster-01  raid_dp,
                                                                   normal
aggr1_02    8.80TB        0B  100% online       2 saat-cluster-02  raid_dp,
                                                                   normal
...
11/7/2026 06:55:51  saat-cluster-02  ERROR         monitor.volume.full / wafl.aggr.full: Aggregate aggr1_02 is full

The volume says 63% used but 0 B available. That combination is the giveaway for a thin volume on a full aggregate: growing the volume would do nothing.

✅ Checkpoint: You spotted 63% used with 0B available.

Practice shell: thin volume at 63 percent with 0B available on a full aggregate
The volume has room; the aggregate under it does not.

3Move the volume to space

volume move start -vserver svm1 -volume vol_home -destination-aggregate aggr1_01
simctl tick 3
volume show -vserver svm1 -volume vol_home -fields aggregate,available,percent-used
simctl write svm1 vol_home 10g files

You should see:

vserver volume   aggregate available percent-used
------- -------- --------- --------- ------------
svm1    vol_home aggr1_01  34.97GB   63%
saat-cluster::> simctl write svm1 vol_home 10g files
Client wrote 10GB to svm1:vol_home.

The volume moved to aggr1_01, which has room, and writes work again. On a real full aggregate you’d move the volumes that grow fastest first, then add capacity or clean up so aggr1_02 has headroom again.

✅ Checkpoint: vol_home is on aggr1_01 and the write succeeds.

This happened at work

Forty promises, one store room

A sports goods manufacturer in Meerut kept product design files on about forty thin-provisioned volumes in one aggregate. On paper the volumes added up to roughly three times the aggregate’s size, which had been fine for two years because most teams never used half of what they asked for.

Then the design team started saving high-resolution 3D renders for a new catalogue. Over one weekend the aggregate went from 82% to 100%, and on Monday morning every team’s share failed writes, even though each share still showed free space in Windows Explorer.

The storage admin moved the render volume and two others to an aggregate on the second HA pair with volume move, which got everyone writing again before lunch. Afterwards the team set aggregate alerts at 75% and 85%, capped autosize on the big volumes, and started reporting the overcommit ratio every month.

Common mistakes and troubleshooting

MistakeWhat happensDo this instead
Growing a thin volume when the aggregate is fullNothing changes; writes still failCheck storage aggregate show first
Deleting snapshots without askingYou lose the only restore point, or break SnapMirrorCheck owner and SnapMirror before deleting
Ignoring Snapshot SpillVolumes fill though user data hasn’t grownRead volume show-space and size the reserve
Autosize with no maximum in mindOne volume eats the whole aggregateSet -max-autosize and watch the aggregate
Overcommitting thin volumes without alertsEvery volume on the aggregate fails togetherAlert at 75–85% and track the overcommit ratio

Interview questions

Click a question to open it. Each one is written the way an interviewer would ask it. Under it you will see why they ask it and one way you could answer, in your own words.

Fresher level

1. A user says the share is full but they’ve hardly added files. What would you look at?

Why they ask this: They want to see you know snapshots use space too.

How you might answer: I’d run volume show-space on the volume. If Snapshot Spill is large, old Snapshot copies are holding changed blocks, so I’d check volume snapshot show for big or forgotten copies before deciding what to delete or how much to grow.

2. What is thin provisioning in simple words?

Why they ask this: They’re checking a basic capacity concept.

How you might answer: The volume promises a size but only takes real space from the aggregate as data is written. It saves space, but if you promise more than you have and everyone fills up, the aggregate runs out first.

2–5 years experience

3. A thin volume shows 60% used but 0 bytes available. What’s going on?

Why they ask this: They want to see you connect volume and aggregate space.

How you might answer: The aggregate under it is full, so the volume can’t get more blocks even though it hasn’t used its own size. Growing the volume won’t help; I’d free space in the aggregate or move the volume to another aggregate with volume move.

4. How do you decide whether to delete a Snapshot copy to free space?

Why they ask this: They’re testing care with data protection.

How you might answer: I’d check who created it and why, whether it’s the newest common snapshot for a SnapMirror relationship, and whether there’s a backup copy elsewhere. Scheduled policy snapshots I’d rather manage by changing the policy; manual ones I delete only with the owner’s OK.

Senior level

5. How would you manage overcommitment on a cluster full of thin volumes?

Why they ask this: They want a capacity management approach, not a one-off fix.

How you might answer: I’d report each aggregate’s used percentage and overcommit ratio every month, alert at 75 and 85 percent, and keep enough free space to move the largest volume. Autosize would have sensible maximums, and fast-growing volumes would get their own aggregates or FabricPool tiering.

6. An aggregate hits 100% at 2 a.m. and several databases stop. What do you do in the first hour?

Why they ask this: They want calm prioritisation under pressure.

How you might answer: First I’d free some room fast: delete clearly unneeded manual snapshots or move one large, less critical volume to another aggregate, so writes resume. Then I’d bring any offline LUNs back after checking space, confirm the databases recovered, and only after that work on the cause and a proper capacity plan.

Quick quiz

Q1. Which command shows Snapshot Spill for a volume?

  1. volume show-space
  2. storage disk show
  3. lun show
  4. vserver show
Show answer

A — it splits used space into user data, metadata, reserve and spill.

Q2. A thin volume reports 63% used and 0B available. What is most likely full?

  1. The volume
  2. The aggregate
  3. The Snapshot reserve
  4. The LIF
Show answer

B — a thin volume can’t get blocks from a full aggregate.

Q3. What does -autosize-mode grow do?

  1. Shrinks the volume at night
  2. Grows the volume when it nears full, up to -max-autosize
  3. Deletes snapshots
  4. Moves the volume
Show answer

B — it adds space automatically within the limit you set.

Q4. Why check SnapMirror before deleting a snapshot?

  1. Deleting is always slow
  2. The relationship may need it as its common snapshot
  3. It changes the LIF
  4. It resets quotas
Show answer

B — losing the common snapshot can force a new baseline.

Q5. Which fix works while clients stay connected?

  1. volume move to an aggregate with space
  2. Deleting the aggregate
  3. Rebooting the node
  4. Changing the SVM name
Show answer

A — volume move is nondisruptive.

Quick recap

  • Full volume: check volume show-space; Snapshot Spill often takes the space.
  • Fix with resize and autosize, or delete unneeded snapshots after checking owner and SnapMirror.
  • Thin volume with free percent but 0 B available means the aggregate is full.
  • Fix a full aggregate by moving volumes, adding disks or cleaning up.
  • Alert early and track overcommitment.

Next lesson

Lesson 53: LIF and network problems → You’ll fix LIFs that are down, away from home, or can’t reach their gateway.

Further reading: ONTAP volume full

Want to go deeper into ONTAP volume full? NetApp’s ONTAP concepts guide explains aggregates, FlexVol volumes and Snapshot copies, the three things behind every “disk full” call. You can also see the full plan for this course on the NetApp ONTAP Storage Administration course page.

Scroll to Top

This website uses cookies

We use a few cookies to keep this site working. If you allow it, we also use Google Analytics to count visits so we can improve our lessons. You can accept all, deny the optional ones, or choose what to allow.