

5Fix the placement if needed
If capping isn’t enough, move the noisy volume to a less busy aggregate (Lesson 3’s volume move) and keep a sensible cap on it. Placement fixes the cause; QoS limits the damage.
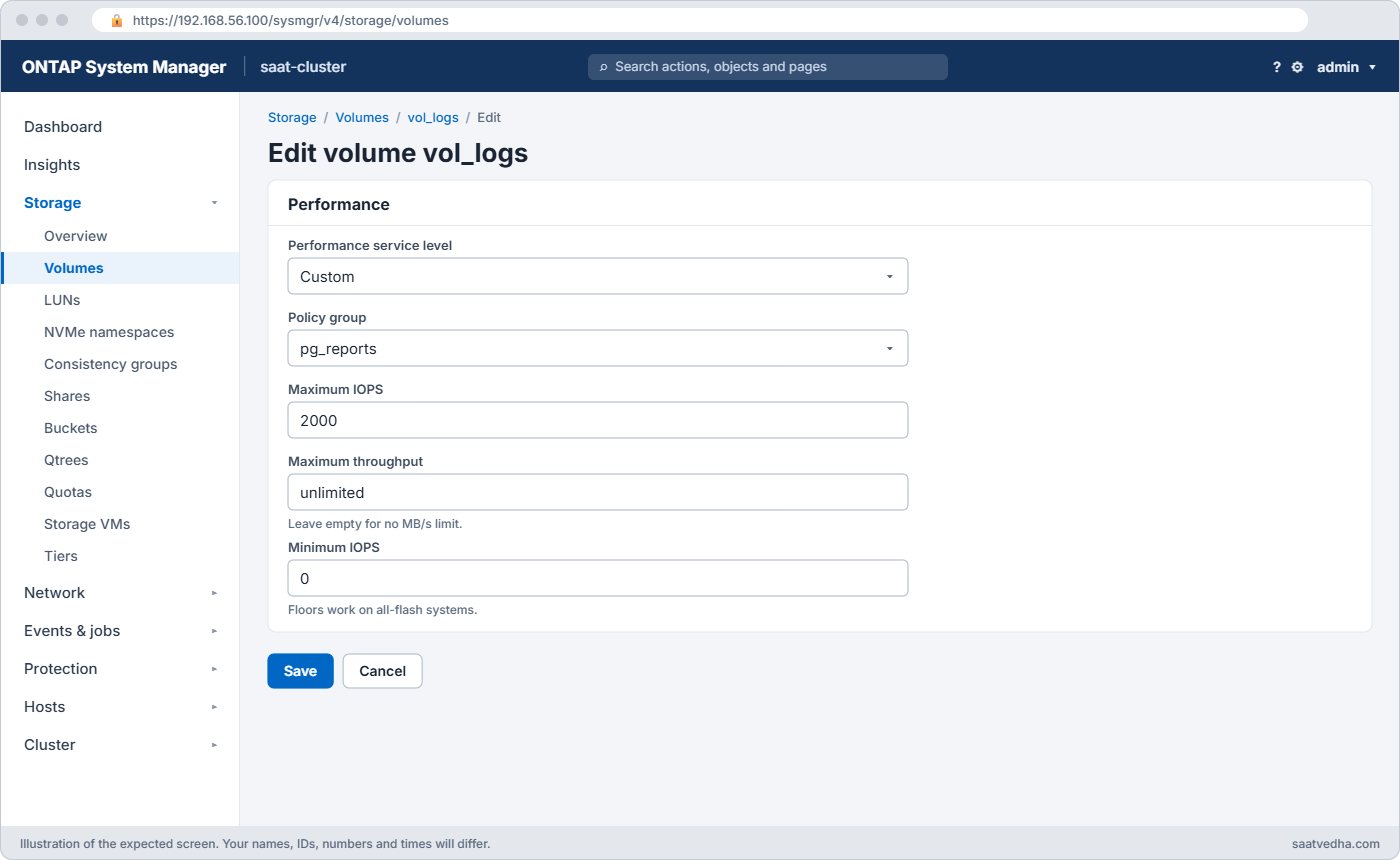
In System Manager, edit a volume under Storage › Volumes and choose a Performance service level, or Custom to type IOPS and MB/s limits. Policies are listed under Storage › Storage VMs, select the SVM, Settings › QoS policies.
Good to know: let ONTAP choose where a new volume goes
When you provision from System Manager, you usually don’t pick an aggregate. Balanced placement looks at the space and performance headroom of every local tier and places the new volume or LUN where it fits best.
For common applications such as databases or virtual servers, System Manager can also apply recommended settings for you, including a performance service level that sets QoS limits. Use it for routine requests, and use the CLI when you need exact control over the aggregate, the policy or the layout.
Before you run any command, double-check it
Read every command twice before you press Enter. Check the target: the server name, the user, the disk or device name, the path and the sizes. These commands are for learning and were tested in our lab, not on your system. At work, run the read-only commands first, follow your change process, make sure a backup exists, and ask a second person to check anything that changes or deletes data. You run them at your own risk.
This lab uses the SaatVedha ONTAP practice shell, our own learning tool. It is not NetApp software: real ONTAP output looks like this but is not identical.
Start from the usual setup with svm1, aggr1_01 and aggr1_02. Your numbers will differ a little on each run; compare the patterns, not the exact values. Real ONTAP keeps printing statistics until you press Ctrl-C, while -iterations 1 prints one sample.
1Two volumes on one aggregate, one busy ERP
volume create -vserver svm1 -volume vol_erp -aggregate aggr1_01 -size 200g -junction-path /erp
volume create -vserver svm1 -volume vol_reports -aggregate aggr1_01 -size 200g -junction-path /reports
simctl load svm1 vol_erp 3000 40 0.5
qos statistics volume latency show -iterations 1
You should see something like this:
Workload            ID    Latency    Network    Cluster       Data       Disk    QoS Max    QoS Min      NVRAM      Cloud  FlexCache    SM Sync         VA     AVSCAN
--------------- ------ ---------- ---------- ---------- ---------- ---------- ---------- ---------- ---------- ---------- ---------- ---------- ---------- ----------
-total-              -    15.72ms    60.21us        0ms   150.53us    15.51ms        0ms        0ms        0ms        0ms        0ms        0ms        0ms        0ms
vol_erp-wid2709   2709    15.72ms    60.21us        0ms   150.53us    15.51ms        0ms        0ms        0ms        0ms        0ms        0ms        0ms        0ms
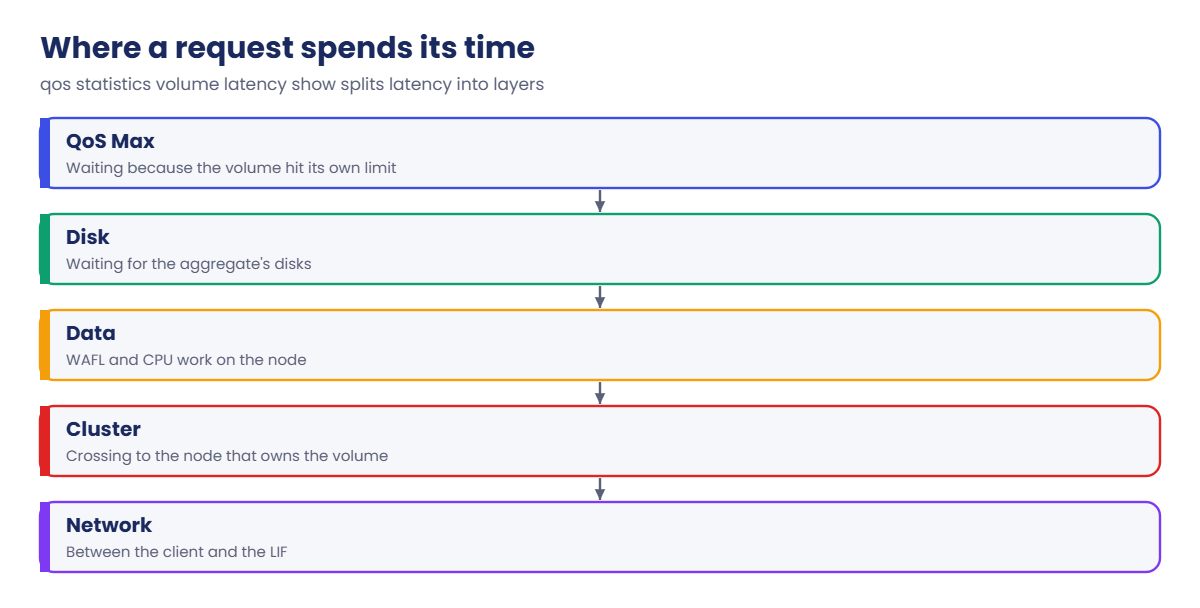
The ERP volume runs at about 15 ms, almost all of it in the Disk column, which is normal for SAS hard disks. Scroll the output sideways to see every column.
✅ Checkpoint: vol_erp shows about 15 ms, mostly Disk.
2The report job starts
simctl break noisy-neighbor svm1 vol_reports
qos statistics volume latency show -iterations 1
qos statistics volume performance show -iterations 1
You should see something like this:
Workload            ID    Latency    Network    Cluster       Data       Disk    QoS Max    QoS Min      NVRAM      Cloud  FlexCache    SM Sync         VA     AVSCAN
--------------- ------ ---------- ---------- ---------- ---------- ---------- ---------- ---------- ---------- ---------- ---------- ---------- ---------- ----------
-total-              -    50.66ms    59.46us        0ms   607.45us    50.00ms        0ms        0ms        0ms        0ms        0ms        0ms        0ms        0ms
vol_reports-wid   9745    60.57ms    57.45us        0ms   586.98us    59.93ms        0ms        0ms        0ms        0ms        0ms        0ms        0ms        0ms
vol_erp-wid2709   2709    40.76ms    61.46us        0ms   627.92us    40.07ms        0ms        0ms        0ms        0ms        0ms        0ms        0ms        0ms
saat-cluster::> qos statistics volume performance show -iterations 1
Workload            ID     IOPS       Throughput    Latency
--------------- ------ -------- ---------------- ----------
-total-              -    45904        897.56MB/s          -
vol_erp           2709     3079         41.06MB/s    40.85ms
vol_reports       9745    42824        856.50MB/s    60.20ms
ERP latency nearly tripled and the extra time is in Disk. The performance view shows why: vol_reports is pushing over 40,000 IOPS on the same aggregate.
✅ Checkpoint: You can name the noisy volume and the busy layer.
3Cap the noisy volume
qos policy-group create -policy-group pg_reports -vserver svm1 -max-throughput 2000iops
volume modify -vserver svm1 -volume vol_reports -qos-policy-group pg_reports
qos policy-group show
qos statistics volume latency show -iterations 1
You should see something like this:
Volume modify successful on volume vol_reports of Vserver svm1.
saat-cluster::> qos policy-group show
Name             Vserver     Class        Wklds Throughput
---------------- ----------- ------------ ----- ------------
pg_reports       svm1        user-defined 1     0-2000IOPS
saat-cluster::> qos statistics volume latency show -iterations 1
Workload            ID    Latency    Network    Cluster       Data       Disk    QoS Max    QoS Min      NVRAM      Cloud  FlexCache    SM Sync         VA     AVSCAN
--------------- ------ ---------- ---------- ---------- ---------- ---------- ---------- ---------- ---------- ---------- ---------- ---------- ---------- ----------
-total-              -   102.00ms    59.17us        0ms   147.92us    49.90ms    51.90ms        0ms        0ms        0ms        0ms        0ms        0ms        0ms
vol_reports-wid   9745   164.42ms    57.93us        0ms   144.82us    60.42ms   103.79ms        0ms        0ms        0ms        0ms        0ms        0ms        0ms
vol_erp-wid2709   2709    39.59ms    60.41us        0ms   151.02us    39.38ms        0ms        0ms        0ms        0ms        0ms        0ms        0ms        0ms
The cap works: vol_reports now spends about 100 ms per request in QoS Max. But ERP is still near 40 ms, because even 2000 IOPS of random reads is a lot for eight SAS disks. The limit alone isn’t enough here.
✅ Checkpoint: vol_reports shows QoS Max latency; vol_erp is still slow.
4Move the reports volume to the other aggregate
volume move start -vserver svm1 -volume vol_reports -destination-aggregate aggr1_02
simctl tick 3
qos statistics volume latency show -iterations 1
qos statistics volume performance show -iterations 1
You should see something like this:
Workload            ID    Latency    Network    Cluster       Data       Disk    QoS Max    QoS Min      NVRAM      Cloud  FlexCache    SM Sync         VA     AVSCAN
--------------- ------ ---------- ---------- ---------- ---------- ---------- ---------- ---------- ---------- ---------- ---------- ---------- ---------- ----------
-total-              -    76.92ms    59.02us        0ms   147.55us    22.20ms    54.52ms        0ms        0ms        0ms        0ms        0ms        0ms        0ms
vol_reports-wid   9746   138.91ms    60.86us        0ms   152.14us    29.66ms   109.04ms        0ms        0ms        0ms        0ms        0ms        0ms        0ms
vol_erp-wid2709   2709    14.93ms    57.18us        0ms   142.96us    14.73ms        0ms        0ms        0ms        0ms        0ms        0ms        0ms        0ms
saat-cluster::> qos statistics volume performance show -iterations 1
Workload            ID     IOPS       Throughput    Latency
--------------- ------ -------- ---------------- ----------
-total-              -     4914         78.80MB/s          -
vol_erp           2709     2923         38.98MB/s    15.27ms
vol_reports       9746     1990         39.82MB/s   136.33ms
ERP is back to about 15 ms. The reports volume keeps its QoS cap on its new aggregate, so it can’t hurt whatever lives there either. Its workload ID changed because the volume moved.
✅ Checkpoint: vol_erp is back near 15 ms.
5Try an adaptive policy
qos adaptive-policy-group create -policy-group apg_db -vserver svm1 -expected-iops 2000IOPS/TB -peak-iops 4000IOPS/TB
qos adaptive-policy-group show
You should see this:
Name             Vserver    Wklds Expected IOPS  Peak IOPS
---------------- ---------- ----- -------------- ------------
apg_db           svm1       0     2000IOPS/TB    4000IOPS/TB
A 2 TB volume in this group could burst to 8000 IOPS, and if it grows to 4 TB the ceiling grows with it. That’s how service catalogues offer “gold” and “silver” storage without editing limits by hand.
✅ Checkpoint: apg_db shows 2000 and 4000 IOPS per TB.

Try it yourself: Build a QoS limit in the Command Builder.
Continue from the end of the lab.

1Set the limit far too low
qos policy-group modify -policy-group pg_reports -max-throughput 500iops
qos statistics volume performance show -iterations 1
You’ll get something like this:
Workload            ID     IOPS       Throughput    Latency
--------------- ------ -------- ---------------- ----------
-total-              -     3373         48.31MB/s          -
vol_erp           5330     2872         38.30MB/s    28.05ms
vol_reports       5757      500         10.01MB/s  1828.63ms
The report job now waits almost two seconds per request and will run all night, yet nothing is broken: the limit is doing exactly what you asked. Agree limits with the workload’s owner, start generous, and lower them in steps while you watch both volumes. Put it back with -max-throughput 2000iops.
✅ Checkpoint: pg_reports is back at 2000 IOPS.
2Delete a policy group that is still in use
qos policy-group delete -policy-group pg_reportsYou’ll get this:
Error: command failed: Policy group "pg_reports" is assigned to: vol_reports. Remove it from the workloads first.Detach it first with volume modify -vserver svm1 -volume vol_reports -qos-policy-group none, then delete the group. Before you do, ask why it was added; a limit that disappears quietly brings the noisy neighbour back.
✅ Checkpoint: You know the order: detach, then delete.