The troubleshooting workflow (EMS, event log, AutoSupport)
-
Phase 0: Start here
-
Phase 1: Architecture and foundation
-
Phase 2: Protocols and day-to-day administration
-
Phase 3: Data protection and enterprise integrations
-
Phase 4: Troubleshooting blueprint
-
Phase 5: Final project and career
Phase 4 is different from everything before it. Until now you built things; from here on, something is already broken and a user is waiting on the phone.
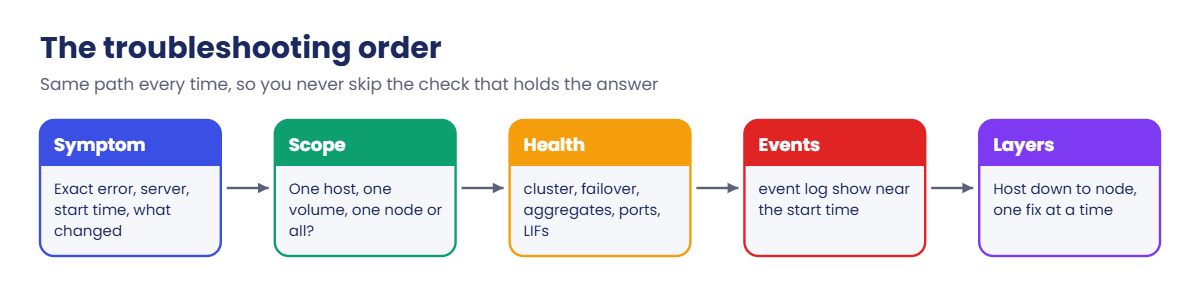
Good storage engineers don’t fix problems faster because they know more commands. They fix them faster because they look in the same order every time, so they never skip the boring check that holds the answer.
This lesson gives you that order. The next seven lessons use it on the problems you’ll meet most: LUNs that vanish, stale NFS handles, SMB access errors, slow volumes, full volumes, LIF trouble and SnapMirror or takeover failures.
Where this lesson fits
Lesson 47 of 56 in NetApp ONTAP Storage Administration · Phase 4: Troubleshooting blueprint · Before this: Lesson 46, FabricPool tiering to S3 · Next: Lesson 48, LUN offline or not visible on the host
| Time | You need | By the end you can |
|---|---|---|
| 60 minutes | The practice shell and the setup file from this lesson | Follow a fixed troubleshooting order, read the EMS event log, and prove AutoSupport reaches NetApp |
What it is, in one line
ONTAP troubleshooting means walking one fixed path: write down the symptom, find out how wide it is, check cluster health, read the event log, then test each layer from the client down to the disk until one of them doesn’t look right.
In Simple Words
How a good family doctor works
When you visit a good family doctor with a headache, she doesn’t start by ordering a brain scan. She asks when it started and whether anyone else at home has it, then checks your temperature and blood pressure, and only after that does she look closer at the one thing that seems off.
She also keeps your file. Last year’s blood report tells her what “normal” looks like for you, so a small change stands out.
ONTAP gives you the same tools: health commands are the temperature check, the event log is the patient file, and AutoSupport is the copy of that file the specialist (NetApp support) already has when you call.
Engineer's View
How an engineer describes it
Every ONTAP node runs the Event Management System (EMS). Each event has a message name such as vifmgr.portdown or raid.disk.failed, a node and a severity: EMERGENCY, ALERT, ERROR, NOTICE, INFORMATIONAL or DEBUG. You read them with event log show, and you can filter by severity, node, message name or time.
You can also push events out as they happen. event notification destination create defines where they go (e-mail, syslog server, SNMP trap host or a REST webhook), and event notification create links a filter such as the built-in important-events to that destination. Monitoring tools like Active IQ Unified Manager read the same events.
AutoSupport is the health report each node sends to NetApp, every week and also when key events happen, for example a failed disk. NetApp uses it to open support cases automatically and to feed Digital Advisor (the portal earlier called Active IQ). If AutoSupport can’t get out, NetApp only finds out about a dead disk when you call them.
How it works, step by step
1Write down the symptom exactly
“Storage is slow” isn’t a symptom. Ask what the user sees (an error text, a timeout, a slow screen), on which server, since when, and what changed. Copy the exact error message into your ticket.
2Find how wide it is
One client, one volume, one SVM, one node, or everything? A problem on one host points to that host or its path. A problem on every volume of one node points to the node, its ports or its aggregates.
3Check cluster health
Run the same short list every time: cluster show, storage failover show, storage aggregate show, network port show -link down and network interface show -is-home false. Anything red here comes first.
4Read the event log around the start time
event log show -severity <=ERROR shows only the serious events. Match the time stamps with the time the user first saw the problem, and search for the message name in the NetApp Knowledge Base.
5Walk the layers, then fix and prove it
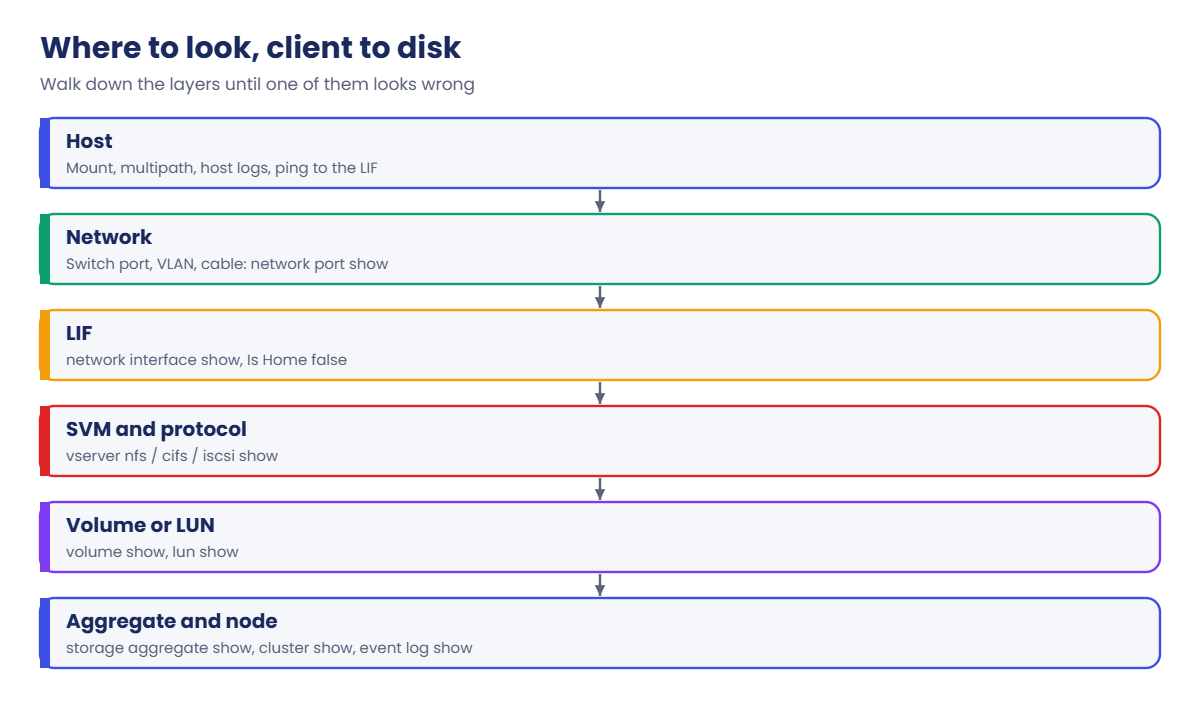
Go from the client down: host, network, LIF, SVM and protocol, volume or LUN, aggregate, node. Change one thing at a time, check the user’s symptom is gone, and write the cause and fix in the ticket.
| Layer | Where to look | First commands |
|---|---|---|
| Host | The server or PC that sees the problem | Host logs, mount or multipath output, ping to the LIF |
| Network | Switch ports, VLANs, cables | network port show, network ping |
| LIF | The address the client uses | network interface show, -is-home false |
| SVM and protocol | NFS, SMB, iSCSI, FC services | vserver show, vserver nfs show, vserver iscsi show |
| Volume or LUN | The data object itself | volume show, lun show |
| Aggregate | Space and RAID state | storage aggregate show |
| Node | Health, HA, events | cluster show, storage failover show, event log show |
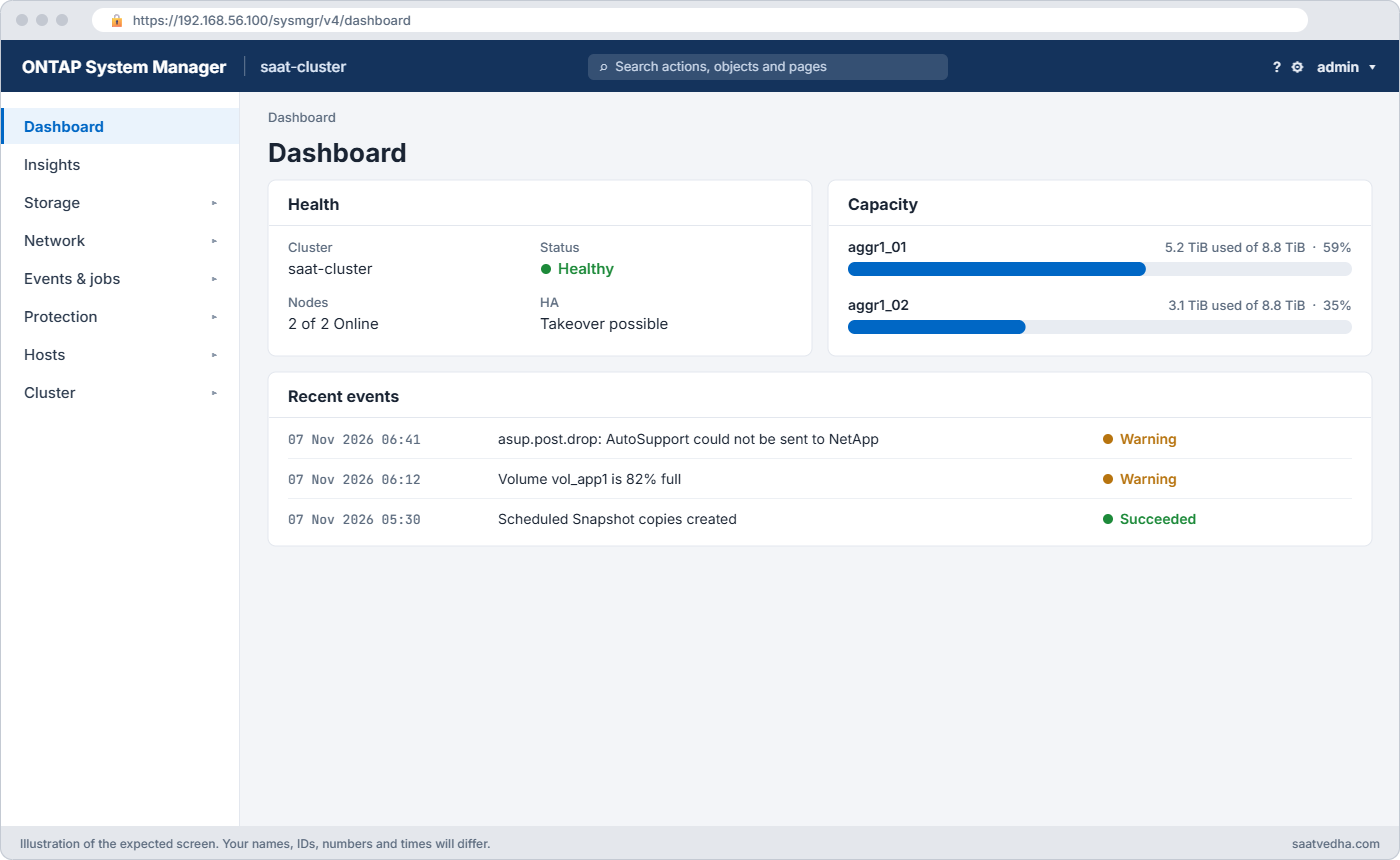
In System Manager, start at the Dashboard for health and capacity, then Events & Jobs › Events for the event log and Cluster › Settings › AutoSupport for AutoSupport status.
Hands-on lab: find a failed port the right way
Before you run any command, double-check it
Read every command twice before you press Enter. Check the target: the server name, the user, the disk or device name, the path and the sizes. These commands are for learning and were tested in our lab, not on your system. At work, run the read-only commands first, follow your change process, make sure a backup exists, and ask a second person to check anything that changes or deletes data. You run them at your own risk.
This lab uses the SaatVedha ONTAP practice shell, our own learning tool. It is not NetApp software: real ONTAP output looks like this but is not identical.
All the Phase 4 lessons start from the same small environment. Build it once here, and reuse the same file in Lessons 48 to 54.
1Build the Phase 4 lab
In your lab folder create setup-p4.txt with these lines:
storage aggregate create -aggregate aggr1_01 -node saat-cluster-01 -diskcount 8 -disktype SAS
storage aggregate create -aggregate aggr1_02 -node saat-cluster-02 -diskcount 8 -disktype SAS
vserver create -vserver svm1 -aggregate aggr1_01 -rootvolume-security-style unix
network interface create -vserver svm1 -lif svm1_nas1 -service-policy default-data-files -home-node saat-cluster-01 -home-port e0c -address 192.168.56.130 -netmask 255.255.255.0
network interface create -vserver svm1 -lif svm1_iscsi1 -service-policy default-data-iscsi -home-node saat-cluster-01 -home-port e0d -address 192.168.56.131 -netmask 255.255.255.0
network interface create -vserver svm1 -lif svm1_iscsi2 -service-policy default-data-iscsi -home-node saat-cluster-02 -home-port e0d -address 192.168.56.132 -netmask 255.255.255.0
vserver nfs create -vserver svm1 -v3 enabled -v4.1 enabled
vserver export-policy rule create -vserver svm1 -policyname default -clientmatch 192.168.56.0/24 -rorule sys -rwrule sys -superuser sys
vserver iscsi create -vserver svm1
volume create -vserver svm1 -volume vol_app1 -aggregate aggr1_01 -size 50g -junction-path /app1Reset the lab and run the file from your terminal:
python ontapsim.py -c "simctl reset"
python ontapsim.py --run setup-p4.txtYou get two data aggregates, an SVM called svm1 with an NFS LIF and two iSCSI LIFs, and a 50 GB volume mounted at /app1.
✅ Checkpoint: No line in the output starts with Error.
2Take a healthy baseline
Log in (admin / saatlab1) and run the health list. Save this output; it’s your “last year’s blood report”.
cluster show
storage failover show
event log show -severity <=ERRORYou should see this:
saat-cluster::> cluster show
Node Health Eligibility
--------------------- ------- ------------
saat-cluster-01 true true
saat-cluster-02 true true
2 entries were displayed.
saat-cluster::> storage failover show
Takeover
Node Partner Possible State Description
--------------- --------------- -------- -------------------------------------
saat-cluster-01 saat-cluster-02 true Connected to saat-cluster-02
saat-cluster-02 saat-cluster-01 true Connected to saat-cluster-01
2 entries were displayed.
saat-cluster::> event log show -severity <=ERROR
There are no entries matching your query.Both nodes healthy, takeover possible, no serious events. That’s what normal looks like.
✅ Checkpoint: No ERROR, ALERT or EMERGENCY events yet.
3Something breaks
A Linux team says their NFS mount “froze for a few seconds” a minute ago. Play that event with the lab control below, then forget you did it and work only with ONTAP commands.
simctl break port-down saat-cluster-01 e0c
simctl tick 1✅ Checkpoint: simctl says the fault is active.
4Follow the order: health, then events
network port show -link down
network interface show -is-home false
event log show -severity <=ERRORYou should see this (times will differ):
saat-cluster::> network port show -link down
Node: saat-cluster-01
Ignore
Speed(Mbps) Health Health
Port IPspace Broadcast Domain Link MTU Admin/Oper Status Status
--------- ------------ ---------------- ---- ---- ----------- -------- ------
e0c Default Default down 1500 auto/- healthy false
saat-cluster::> network interface show -is-home false
Logical Status Network Current Current Is
Vserver Interface Admin/Oper Address/Mask Node Port Home
----------- ---------- ---------- ------------------ --------------- ------- ----
svm1
svm1_nas1 up/up 192.168.56.130/24 saat-cluster-01 e0d false
saat-cluster::> event log show -severity <=ERROR
Time Node Severity Event
------------------- ---------------- ------------- ------------------------
11/7/2026 06:42:04 saat-cluster-01 ERROR vifmgr.portdown: A link down event was received on node saat-cluster-01, port e0c.Three commands tell the whole story. Port e0c lost its link, the NAS LIF failed over to e0d on the same node (that was the short freeze), and the event log has the exact time. The next place to look is outside ONTAP: the cable and the switch port.
✅ Checkpoint: You can name the port, the LIF that moved and the event message name.

5Fix it and prove it
In real life the network team replaces a cable or re-enables a switch port. In the lab, simctl fix plays that part. Then send the LIF home, because a data LIF stays where it failed over to unless auto-revert is on.
simctl fix port-down
simctl tick 1
network interface revert -vserver svm1 -lif svm1_nas1
network interface show -is-home falseYou should see this:
saat-cluster::> network interface revert -vserver svm1 -lif svm1_nas1
saat-cluster::> network interface show -is-home false
There are no entries matching your query.✅ Checkpoint: No LIF is away from its home port.
6Check that NetApp would hear about it
system node autosupport invoke -node * -type test -message "lab test"
simctl tick 1
system node autosupport history show -node *You should see this:
Node Seq Num Destination Last Update Status
--------------- ------- ----------- ------------------- ----------------------
saat-cluster-01 100 https 11/7/2026 06:43:48 sent-successful
saat-cluster-02 100 https 11/7/2026 06:43:48 sent-successful
2 entries were displayed.sent-successful on both nodes means the reports reach NetApp over HTTPS. Make this test part of every firewall or proxy change.
✅ Checkpoint: Both nodes show sent-successful.
Try it yourself: Open the cluster health check in the Command Builder.
Break It, Then Fix It
The quiet failure: AutoSupport stops getting out and nobody notices, because nothing on the cluster looks broken.
1Block AutoSupport and send a test
simctl break asup-blocked
system node autosupport invoke -node * -type test -message "after proxy change"
simctl tick 1
system node autosupport history show -node *You’ll get this:
Node Seq Num Destination Last Update Status
--------------- ------- ----------- ------------------- ----------------------
saat-cluster-01 100 https 11/7/2026 06:43:48 sent-successful
saat-cluster-02 100 https 11/7/2026 06:43:48 sent-successful
saat-cluster-01 101 https 11/7/2026 06:43:48 transmission-failed
saat-cluster-02 101 https 11/7/2026 06:43:48 transmission-failed
4 entries were displayed.Your lab test from step 6 got through, but the new one (101) failed on both nodes. The cluster is healthy and users are happy, yet every report to NetApp now fails. On a real system you’d now check that the nodes can resolve and reach support.netapp.com on port 443 through your proxy, and look at system node autosupport show -node * -instance for the transport and proxy settings.
✅ Checkpoint: Sequence 101 shows transmission-failed on both nodes.

2Fix the path and test again
simctl fix asup-blocked
system node autosupport invoke -node * -type test -message "after firewall fix"
simctl tick 1
system node autosupport history show -node *You should now see new lines like these:
saat-cluster-01 102 https 11/7/2026 06:43:48 sent-successful
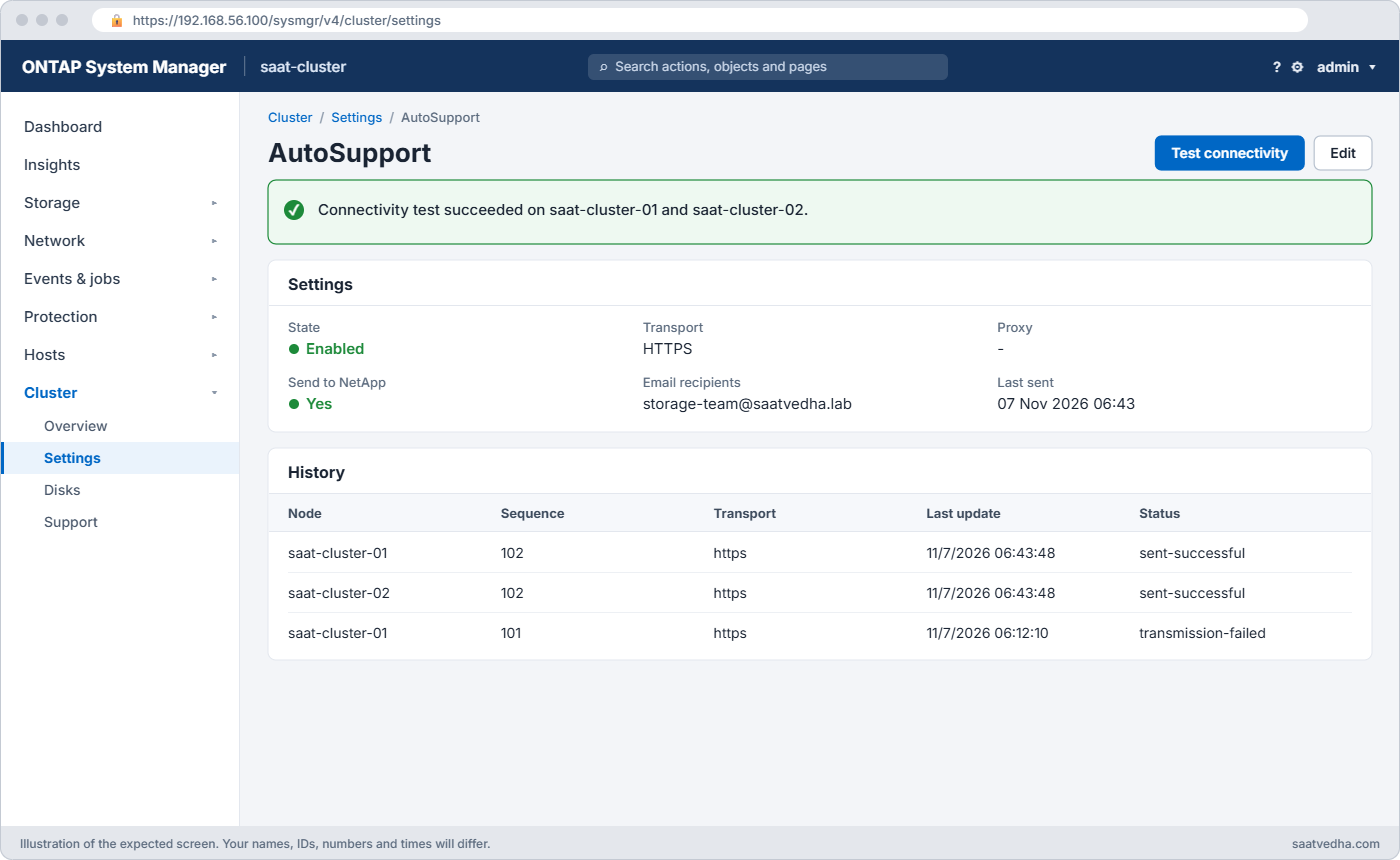
saat-cluster-02 102 https 11/7/2026 06:43:48 sent-successfulKeep the failed lines in the history; they prove when the problem started. In System Manager, Cluster › Settings › AutoSupport has a Test connectivity button that does the same check.
✅ Checkpoint: The newest entries show sent-successful.
Try it yourself: Build the AutoSupport check in the Command Builder.
This happened at work
Nine days of silence
A power distribution company in Bhopal ran its billing database and customer document store on a FAS pair. In March their IT team moved to a new web proxy, and the change plan covered browsers and Windows updates but not the storage controllers.
Nine days later the morning batch ran slowly. A storage engineer ran storage aggregate show and saw RAID Status “reconstruct” on the busiest aggregate.
The event log showed one disk had failed nine days earlier and a second disk in the same RAID group had failed that morning. RAID-DP had survived both, but there was no spare left of that size, and no support case had been opened because AutoSupport had been failing since the proxy change.
NetApp shipped disks the same day once the team opened a case by phone. Afterwards they sent important events to their syslog server with event notification, added the AutoSupport test to the firewall change checklist, and put system node autosupport history show in the Monday health check.
Common mistakes and troubleshooting
| Mistake | What happens | Do this instead |
|---|---|---|
| Jumping straight to a fix | You change three things and never learn which one helped, or you make it worse | Write the symptom, check health, read events, then change one thing |
| Reading the whole event log | Thousands of NOTICE lines hide the one ERROR you need | Filter with -severity <=ERROR, -node or -message-name |
| No baseline | You can’t tell if a number is bad or normal for this cluster | Save health output weekly and before every change |
| Trusting AutoSupport without testing it | Failed disks don’t open support cases | Invoke a test after network changes and check the history |
| Leaving LIFs away from home after a fix | Traffic keeps using the backup port and the next failure hurts more | Run network interface show -is-home false and revert |
Interview questions
Click a question to open it. Each one is written the way an interviewer would ask it. Under it you will see why they ask it and one way you could answer, in your own words.
Fresher level
1. A user calls and says, “The storage is slow.” What’s the first thing you do?
Why they ask this: They want to see that you collect facts before you touch anything, which is what separates a calm engineer from a panicked one.
How you might answer: First I’d ask what exactly is slow, on which server, since when, and whether anything changed. Then I’d check if it’s one host or many, and run my health list: cluster show, storage failover show, storage aggregate show and event log show -severity <=ERROR.
2. What is AutoSupport, and why should a storage admin care about it?
Why they ask this: They’re checking that you know how NetApp support finds out about hardware faults.
How you might answer: AutoSupport is the health report each node sends to NetApp every week and when important events happen, like a failed disk. NetApp uses it to open cases and ship parts automatically, so if it’s blocked, a failed disk can sit there unnoticed. I check system node autosupport history show after any firewall or proxy change.
2–5 years experience
3. How do you find the events that matter when the event log has thousands of lines?
Why they ask this: They want to know you can filter fast under pressure instead of scrolling.
How you might answer: I filter by severity first, event log show -severity <=ERROR, and then by node or by the time the problem started. If I see a message name like vifmgr.portdown, I filter on -message-name to see how often it happened and search for it in the NetApp Knowledge Base.
4. An NFS client froze for a few seconds and then recovered. Nothing is broken now. Would you close the ticket?
Why they ask this: They’re testing whether you chase the root cause of a short blip or ignore it until it becomes an outage.
How you might answer: Not yet. A short freeze often means a LIF failed over, so I’d check network interface show -is-home false and the event log around that time. If a port went down, I’d ask the network team to check the cable and switch port, revert the LIF, and only then close it with the cause written down.
Senior level
5. How would you set up alerting so your team hears about serious ONTAP events before users do?
Why they ask this: They want to see you design monitoring, not just react to it.
How you might answer: I’d create an event notification destination for our syslog server or e-mail and link the built-in important-events filter to it with event notification create. On top of that I’d have Active IQ Unified Manager watch capacity, latency and protection, and I’d keep AutoSupport on HTTPS so NetApp opens cases for hardware faults.
6. You’re writing the troubleshooting runbook for a new storage team. What would you put on the first page?
Why they ask this: They want to see that you can turn your own habits into a process other people can follow.
How you might answer: The fixed order: write the exact symptom, find the scope, run the health list, read events around the start time, then check layer by layer from host to node. I’d add who to call for network, hosts and NetApp support, and a rule that every change is one change at a time and written in the ticket.
Quick quiz
Q1. What should you do before changing anything during an incident?
- Reboot the node
- Write down the symptom and check how wide it is
- Delete old snapshots
- Open System Manager
Show answer
B — a clear symptom and its scope tell you which layer to check first.
Q2. Which command shows only the serious events?
- event log show -severity <=ERROR
- event log show -node *
- system node show
- cluster show -events
Show answer
A — the severity filter hides NOTICE and INFORMATIONAL lines.
Q3. Port e0c went down and the NAS LIF moved to e0d. What does network interface show -is-home false show?
- Nothing, LIFs never move
- The LIF, now on e0d, with Is Home false
- The port as down
- An error
Show answer
B — a LIF that failed over is listed with its current port and Is Home false.
Q4. What does transmission-failed in the AutoSupport history mean?
- A disk failed
- The node can’t send its report to NetApp
- The cluster is unhealthy
- SnapMirror failed
Show answer
B — the report was made but could not get out, often a proxy or firewall issue.
Q5. Where in System Manager do you read the event log?
- Storage › Tiers
- Events & Jobs › Events
- Network › Overview
- Protection › Relationships
Show answer
B — Events & Jobs › Events lists EMS events with severity and time.
Quick recap
- Troubleshoot in a fixed order: symptom, scope, health, events, layers, then one fix at a time.
- The health list: cluster show, storage failover show, storage aggregate show, network port show -link down, network interface show -is-home false.
- EMS events have a message name, node and severity; filter with -severity <=ERROR.
- Send important events to syslog or e-mail with event notification.
- Test AutoSupport after every network change and read its history.
Next lesson
Lesson 48: LUN offline or not visible on the host → You’ll use this order on the most common SAN call: a server that can’t see its disk.
Further reading: ONTAP troubleshooting
Want to go deeper into ONTAP troubleshooting? Read NetApp’s ONTAP concepts guide for how nodes, HA pairs and SVMs fit together, which is the map you walk during troubleshooting. You can also see the full plan for this course on the NetApp ONTAP Storage Administration course page.
