High latency on a FlexVol

“The ERP is slow” is the vaguest call you’ll get, and also one of the most common. Slow can mean the network, the host, a busy node, busy disks, or a limit someone set on purpose months ago.

ONTAP measures latency for every volume and splits it into parts: time on the network, in the cluster, in the node’s data layer, on disk, and time spent waiting on a QoS limit. Reading that split tells you which part to fix, so you stop guessing.

In the lab a noisy neighbour slows down an ERP volume, and in Break It a forgotten QoS policy does the same job from a different column.

Where this lesson fits

Lesson 51 of 56 in NetApp ONTAP Storage Administration · Phase 4: Troubleshooting blueprint · Before this: Lesson 50, SMB share access problems · Next: Lesson 52, volume or aggregate full

TimeYou needBy the end you can
60 minutesThe practice shell with setup-p4.txt from Lesson 47Read ONTAP volume latency by layer, find a noisy neighbour, and tell disk delay from QoS delay

What it is, in one line

High latency on a FlexVol means each read or write takes too long to finish, and qos statistics volume latency show tells you whether the time is lost in the network, the node, the disks or a QoS limit.

In Simple Words

A slow lunch order

Your food takes 40 minutes at a busy canteen. It might be the queue at the counter, a cook who is juggling too many orders, a gas stove that only has two burners, or the manager telling the cook to serve your office last because of a rule.

If the canteen wrote down how many minutes each order spent at each stage, you’d know at once which one to fix. Adding a cook doesn’t help if the stove is the problem.

ONTAP keeps that kind of note for every volume: the counter is the network, the cook is the node, the burners are the disks, and the manager’s rule is QoS.

Engineer's View

How an engineer describes it

qos statistics volume latency show lists, per volume workload, the average latency and how much of it each component added: Network (the protocol layer talking to the client), Cluster (traffic between nodes when the LIF and the volume sit on different nodes), Data (WAFL and node processing), Disk (waiting for drives), QoS Max and QoS Min (time held back by a policy), plus NVRAM, Cloud (FabricPool), FlexCache, SM Sync and antivirus columns.

qos statistics volume performance show gives IOPS, throughput and latency per volume, which is how you spot the noisy neighbour. statistics aggregate show and the nodeshell sysstat -M 1 show disk and CPU load. On HDD aggregates more than about 20 ms usually hurts databases; on AFF most workloads expect around a millisecond.

Typical causes: another volume on the same aggregate eating the disks, a dedupe scan or other background job at peak time, a busy node CPU, a LIF on one node and the volume on another, a QoS limit that is too tight, and client or network problems that ONTAP can’t see.

How it works, step by step

1What the user sees

Slow screens, timeouts in application logs, high await times in iostat -x on Linux, or high Avg. Disk sec/Transfer in Windows Performance Monitor. Get the time it started and which volume or LUN is behind the application.

ONTAP high latency: the parts of volume latency from network to QoS

2Where to look, in order

Big column in latency showMeansNext check
DiskDrives are busystatistics aggregate show, qos statistics volume performance show for the top talkers
DataNode busy, background worksysstat -M 1, volume efficiency show, volume move show
QoS MaxA limit is slowing it on purposevolume show -fields qos-policy-group, qos policy-group show
ClusterIndirect traffic between nodesWhere the LIF lives compared with the volume
Network, or all smallMost of the time is outside ONTAPHost, switches, application

3How to fix it

Move a noisy volume to a quieter aggregate with volume move, cap it with a QoS max policy, move background scans to the night, move a LIF to the volume’s node, or fix a QoS policy that is too tight. Change one thing and measure again.

ONTAP high latency: which column is biggest and what to check next

4In System Manager and Unified Manager

In System Manager, the Dashboard performance panel and Storage › Volumes (select a volume, then the performance view) show latency, IOPS and throughput over time. Active IQ Unified Manager keeps longer history and flags workloads that cross a threshold.

ONTAP high latency on volume in System Manager performance chart
System Manager: latency jumps when vol_logs starts heavy I/O.

Hands-on lab: catch a noisy neighbour

Before you run any command, double-check it

Read every command twice before you press Enter. Check the target: the server name, the user, the disk or device name, the path and the sizes. These commands are for learning and were tested in our lab, not on your system. At work, run the read-only commands first, follow your change process, make sure a backup exists, and ask a second person to check anything that changes or deletes data. You run them at your own risk.

This lab uses the SaatVedha ONTAP practice shell, our own learning tool. It is not NetApp software: real ONTAP output looks like this but is not identical.

1Create two volumes on the same aggregate

Reset and run setup-p4.txt, log in, and add an ERP volume and a log archive volume, both on aggr1_01. simctl load plays the ERP users.

volume create -vserver svm1 -volume vol_erp -aggregate aggr1_01 -size 100g -junction-path /erp
volume create -vserver svm1 -volume vol_logs -aggregate aggr1_01 -size 200g -junction-path /logs
simctl load svm1 vol_erp 3000 40 0.6
simctl tick 1
qos statistics volume latency show -iterations 1

You should see this (workload IDs will differ):

Workload            ID    Latency    Network    Cluster       Data       Disk    QoS Max    QoS Min      NVRAM      Cloud  FlexCache    SM Sync         VA     AVSCAN
--------------- ------ ---------- ---------- ---------- ---------- ---------- ---------- ---------- ---------- ---------- ---------- ---------- ---------- ----------
-total-              -     7.41ms    59.96us        0ms   149.90us     7.20ms        0ms        0ms        0ms        0ms        0ms        0ms        0ms        0ms
vol_erp-wid1019   1019     7.41ms    59.96us        0ms   149.90us     7.20ms        0ms        0ms        0ms        0ms        0ms        0ms        0ms        0ms

About 7 ms, almost all of it Disk, which is normal for SAS hard disks. Save it: this is the ERP’s baseline. On a real cluster the command keeps printing until you press Ctrl-C; the practice shell stops after the iterations you ask for.

✅ Checkpoint: vol_erp shows about 7 ms total latency.

2The month-end log job starts

simctl break noisy-neighbor svm1 vol_logs
simctl tick 1
qos statistics volume latency show -iterations 1

You should see this:

Workload            ID    Latency    Network    Cluster       Data       Disk    QoS Max    QoS Min      NVRAM      Cloud  FlexCache    SM Sync         VA     AVSCAN
--------------- ------ ---------- ---------- ---------- ---------- ---------- ---------- ---------- ---------- ---------- ---------- ---------- ---------- ----------
-total-              -    46.08ms    58.64us        0ms   599.11us    45.42ms        0ms        0ms        0ms        0ms        0ms        0ms        0ms        0ms
vol_logs-wid326   3267    60.00ms    56.91us        0ms   581.42us    59.36ms        0ms        0ms        0ms        0ms        0ms        0ms        0ms        0ms
vol_erp-wid1019   1019    32.16ms    60.37us        0ms   616.80us    31.48ms        0ms        0ms        0ms        0ms        0ms        0ms        0ms        0ms

The ERP went from 7 ms to 32 ms, and nearly all of the increase is in the Disk column. QoS Max is zero, so no limit is involved: the drives are simply busier.

✅ Checkpoint: vol_erp Disk latency is above 30 ms.

3Find who is using the disks

qos statistics volume performance show -iterations 1
statistics aggregate show

You should see this:

Workload            ID     IOPS       Throughput    Latency
--------------- ------ -------- ---------------- ----------
-total-              -    45900        898.41MB/s          -
vol_erp           1019     2940         39.20MB/s    31.33ms
vol_logs          3267    42960        859.21MB/s    60.39ms

(practice shell: stopped after 1 iterations.)
saat-cluster::> statistics aggregate show
Aggregate            Node             Total Ops Disk Util%
-------------------- ---------------- --------- ----------
aggr0_saat_cluster_01
                     saat-cluster-01          0         3%
aggr0_saat_cluster_02
                     saat-cluster-02          0         3%
aggr1_01             saat-cluster-01      48000       100%
aggr1_02             saat-cluster-02          0         3%
4 entries were displayed.

vol_logs is pushing about 43,000 IOPS, aggr1_01 is at 100% disk use, and aggr1_02 on the other node is almost idle. That’s the textbook noisy neighbour.

✅ Checkpoint: You can name the noisy volume and the busy aggregate.
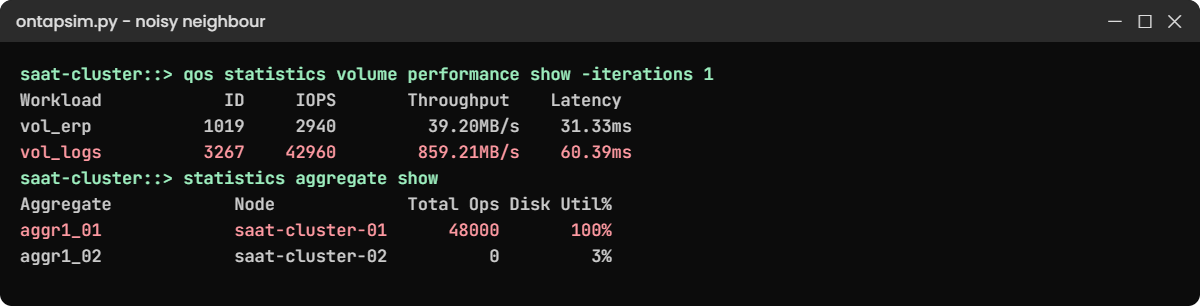
Practice shell: a log volume doing 42,960 IOPS and the aggregate at 100 percent
One volume floods the aggregate the ERP shares.

4Move the noisy volume away

volume move start -vserver svm1 -volume vol_logs -destination-aggregate aggr1_02
simctl tick 3
volume move show -vserver svm1 -volume vol_logs -fields state,phase
qos statistics volume latency show -iterations 1

You should see this:

vserver volume   state phase
------- -------- ----- ---------
svm1    vol_logs done  completed
saat-cluster::> qos statistics volume latency show -iterations 1
Workload            ID    Latency    Network    Cluster       Data       Disk    QoS Max    QoS Min      NVRAM      Cloud  FlexCache    SM Sync         VA     AVSCAN
--------------- ------ ---------- ---------- ---------- ---------- ---------- ---------- ---------- ---------- ---------- ---------- ---------- ---------- ----------
-total-              -    36.62ms    59.98us        0ms   341.71us    36.22ms        0ms        0ms        0ms        0ms        0ms        0ms        0ms        0ms
vol_logs-wid326   3268    66.18ms    62.87us        0ms   540.72us    65.58ms        0ms        0ms        0ms        0ms        0ms        0ms        0ms        0ms
vol_erp-wid1019   1019     7.06ms    57.08us        0ms   142.69us     6.86ms        0ms        0ms        0ms        0ms        0ms        0ms        0ms        0ms

The ERP is back at its 7 ms baseline. vol_logs is still slow, but now it only hurts itself on aggr1_02. Next you’d agree a QoS max limit with the log job’s owner so it can’t flood its new neighbours either.

✅ Checkpoint: vol_erp is back near 7 ms.

Break It, Then Fix It

A slow volume with quiet disks. This time the cause is a setting, not load.

1Attach a tight QoS policy to the ERP volume

Start again from setup-p4.txt with only vol_erp and its load (step 1 of the lab without vol_logs). Then someone attaches a “bronze” policy meant for test systems:

qos policy-group create -policy-group pg_bronze -vserver svm1 -max-throughput 500iops
volume modify -vserver svm1 -volume vol_erp -qos-policy-group pg_bronze
simctl tick 1
qos statistics volume latency show -iterations 1

You’ll get this:

Workload            ID    Latency    Network    Cluster       Data       Disk    QoS Max    QoS Min      NVRAM      Cloud  FlexCache    SM Sync         VA     AVSCAN
--------------- ------ ---------- ---------- ---------- ---------- ---------- ---------- ---------- ---------- ---------- ---------- ---------- ---------- ----------
-total-              -   105.87ms    62.26us        0ms   155.64us     1.89ms   103.76ms        0ms        0ms        0ms        0ms        0ms        0ms        0ms
vol_erp-wid4210   4210   105.87ms    62.26us        0ms   155.64us     1.89ms   103.76ms        0ms        0ms        0ms        0ms        0ms        0ms        0ms

Over 100 ms, but Disk is under 2 ms. Almost all the time sits in QoS Max, which means ONTAP is holding I/O back on purpose.

✅ Checkpoint: QoS Max is the biggest column.

Practice shell: 103 ms in the QoS Max column and a 500 IOPS policy
Quiet disks, high latency: the QoS Max column gives it away.

2Find the policy and remove it

volume show -vserver svm1 -volume vol_erp -fields qos-policy-group
qos policy-group show
volume modify -vserver svm1 -volume vol_erp -qos-policy-group none
simctl tick 1
qos statistics volume latency show -iterations 1

You should see:

vserver volume  qos-policy-group
------- ------- ----------------
svm1    vol_erp pg_bronze
saat-cluster::> qos policy-group show
Name             Vserver     Class        Wklds Throughput
---------------- ----------- ------------ ----- ------------
pg_bronze        svm1        user-defined 1     0-500IOPS
...
vol_erp-wid4210   4210     7.38ms    59.65us        0ms   149.13us     7.17ms        0ms        0ms        0ms        0ms        0ms        0ms        0ms        0ms

A 500 IOPS ceiling on a 3,000 IOPS workload. Removing the policy brings latency back to about 7 ms. Before removing a policy on a real system, ask who set it and why; maybe the ERP needs its own, bigger limit instead.

✅ Checkpoint: vol_erp has no QoS policy and is back near 7 ms.

This happened at work

The archive job that moved in next door

A hospital group in Agra kept its radiology image store (PACS) on an aggregate of SAS disks. One Monday at 9 a.m., doctors complained that X-ray images took half a minute to open instead of two or three seconds.

The PACS vendor blamed the network, and the network team found nothing. The storage engineer ran qos statistics volume latency show and saw the PACS volume at around 40 ms, almost all Disk. qos statistics volume performance show pointed at a new volume, created on Friday on the same aggregate, where a backup team had started copying years of old logs every morning.

They moved the log volume to a FAS aggregate on the other HA pair during the day with volume move, and capped it with a QoS max policy. The team also made a rule that new volumes go through a placement check against statistics aggregate show instead of landing on whichever aggregate has the most free space.

Common mistakes and troubleshooting

MistakeWhat happensDo this instead
Looking only at total latencyYou don’t know which layer to fixRead the Network, Data, Disk and QoS columns
Adding disks when QoS Max is highMoney spent, nothing changesCheck the volume’s QoS policy first
Placing new volumes by free space onlyA busy workload lands next to a critical oneCheck aggregate load before placing volumes
Running dedupe scans during business hours on HDDData and Disk latency rise for every volumeSchedule scans at night with an efficiency policy
Measuring onceYou can’t tell a spike from a trendCompare with a baseline and Unified Manager history

Interview questions

Click a question to open it. Each one is written the way an interviewer would ask it. Under it you will see why they ask it and one way you could answer, in your own words.

Fresher level

1. What does the Disk column in qos statistics volume latency show tell you?

Why they ask this: They want to see that you can read ONTAP’s latency breakdown.

How you might answer: It’s the part of each I/O’s time spent waiting for the drives. If Disk is most of the latency, the aggregate is busy or too slow for the load, so I’d look at statistics aggregate show and which volumes are doing the most I/O.

2. What is a noisy neighbour in storage?

Why they ask this: They’re checking a common real-world idea in simple words.

How you might answer: It’s one workload using so much of a shared resource, usually the disks of an aggregate, that other volumes on it slow down. You find it with qos statistics volume performance show and fix it by moving it or capping it with QoS.

2–5 years experience

3. A volume shows 100 ms latency, but the disks look quiet. What would you suspect?

Why they ask this: They want to see that you know QoS can cause latency on purpose.

How you might answer: I’d check the QoS Max column. If that’s where the time goes, a QoS policy is limiting the volume, so I’d look at volume show -fields qos-policy-group and qos policy-group show and ask who set it before changing anything.

4. Users say an NFS application is slow, but ONTAP shows 1 ms latency for its volume. What now?

Why they ask this: They’re testing whether you can prove storage isn’t the cause and still help.

How you might answer: If ONTAP’s latency is low, the delay is likely outside it, on the client, the network, or in the application. I’d compare with the client’s view, like nfsiostat or iostat -x, check for retransmits and switch errors, and share the numbers with the app team instead of just saying “not storage”.

Senior level

5. How would you stop noisy neighbours from becoming a monthly problem?

Why they ask this: They want a design answer: placement, limits and monitoring.

How you might answer: I’d give important workloads their own aggregates or performance tiers and put QoS max limits, or adaptive QoS, on test and batch volumes. New volumes would get a placement check, and Unified Manager would alert on latency against each workload’s baseline.

6. When would you add hardware for a latency problem instead of tuning?

Why they ask this: They want to see judgement and a data-driven approach to spending.

How you might answer: Only after I’ve ruled out the cheap fixes: misplaced volumes, background jobs, QoS, LIF placement. If the cluster as a whole is running near its disk or CPU limit for long periods and the trend is rising, then adding flash or an HA pair and moving volumes onto it is the right call.

Quick quiz

Q1. Which column shows time held back by a QoS limit?

  1. Network
  2. Disk
  3. QoS Max
  4. Cluster
Show answer

C — QoS Max is delay added by a maximum throughput policy.

Q2. Which command finds the volume doing the most IOPS?

  1. qos statistics volume performance show
  2. volume show-space
  3. lun show
  4. event log show
Show answer

A — it lists IOPS and throughput per volume.

Q3. ERP latency rises and nearly all of it is Disk. What is a good first fix if another volume is flooding the aggregate?

  1. Delete the ERP volume
  2. Move the noisy volume to a quieter aggregate
  3. Turn off NFS
  4. Reboot the node
Show answer

B — volume move spreads the load without downtime.

Q4. What can the Cluster column point to?

  1. A LIF on one node while the volume lives on another
  2. A failed disk
  3. A full volume
  4. Wrong NTP
Show answer

A — I/O crossing the cluster network adds Cluster latency.

Q5. Why schedule dedupe scans at night on HDD systems?

  1. They only work at night
  2. They add CPU and disk load that slows other volumes
  3. They need the cluster offline
  4. They delete snapshots
Show answer

B — background scans compete with users for the same disks and CPU.

Quick recap

  • qos statistics volume latency show splits latency into Network, Cluster, Data, Disk and QoS.
  • Big Disk: busy aggregate, find the top talker with performance show and statistics aggregate show.
  • Big QoS Max: a policy is slowing the volume on purpose.
  • Fix with volume move, QoS limits, night-time scans or LIF placement, one change at a time.
  • Always compare with a baseline.

Next lesson

Lesson 52: Volume or aggregate full → You’ll clear space safely when a volume or aggregate hits 100%.

Further reading: ONTAP high latency

Want to go deeper into ONTAP high latency? NetApp’s ONTAP concepts guide explains how aggregates, volumes and nodes share work, which is the map behind every latency number. You can also see the full plan for this course on the NetApp ONTAP Storage Administration course page.

Scroll to Top

This website uses cookies

We use a few cookies to keep this site working. If you allow it, we also use Google Analytics to count visits so we can improve our lessons. You can accept all, deny the optional ones, or choose what to allow.