WAFL, NVRAM and the memory cache
-
Phase 0: Start here
-
Phase 1: Architecture and foundation
-
Phase 2: Protocols and day-to-day administration
-
Phase 3: Data protection and enterprise integrations
-
Phase 4: Troubleshooting blueprint
-
Phase 5: Final project and career
A database team says “the NetApp acknowledged my write in half a millisecond, but your disks are slow hard drives. How?” The answer is in three pieces that sit inside every ONTAP node: the WAFL file system, NVRAM and the memory cache.
Once you understand how a write and a read travel through a node, numbers like cache hit, CP time and disk utilisation stop being noise. You’ll read them in the lab with sysstat -x, the command senior engineers still open first when a node feels slow.
Where this lesson fits
Lesson 14 of 56 in NetApp ONTAP Storage Administration · Phase 1: Architecture and foundation · Before this: Lesson 13, aggregates and ADP · Next: Lesson 15, Flash Cache and Flash Pool
| Time | You need | By the end you can |
|---|---|---|
| 50 minutes | The practice shell from Lesson 2 (Python 3.8 or newer) | Explain how ONTAP acknowledges writes, what a consistency point is, and read cache and CP columns in sysstat |
What it is, in one line
WAFL is ONTAP’s file system: writes are logged safely in NVRAM, acknowledged at once, collected in memory and then written to disk in large batches called consistency points, while reads are served from the memory cache whenever possible.
In Simple Words
The bank clerk and the ledger
Picture a busy bank branch. When you hand in a cheque, the clerk writes it in a small fireproof notebook and gives you a receipt straight away, so you can walk off without waiting for the big ledger to be updated.
Every few seconds, or when the notebook page fills up, the clerk copies all the new entries into the main ledger in one go, always on fresh pages, never by rubbing out old lines. If the power goes off in between, the fireproof notebook still has every entry, so nothing is lost.
In ONTAP the notebook is NVRAM, the receipt is the write acknowledgement, the main ledger is the disks and the “fresh pages” rule is WAFL’s write-anywhere design.
Engineer's View
How an engineer describes it
WAFL (Write Anywhere File Layout) never overwrites a block in place. Changed data goes to new free 4 KB blocks, and the pointers in the file’s block tree are updated to point at them. Because old blocks aren’t overwritten, a Snapshot copy is just a saved set of pointers, which is why it takes a second and uses no space at first.
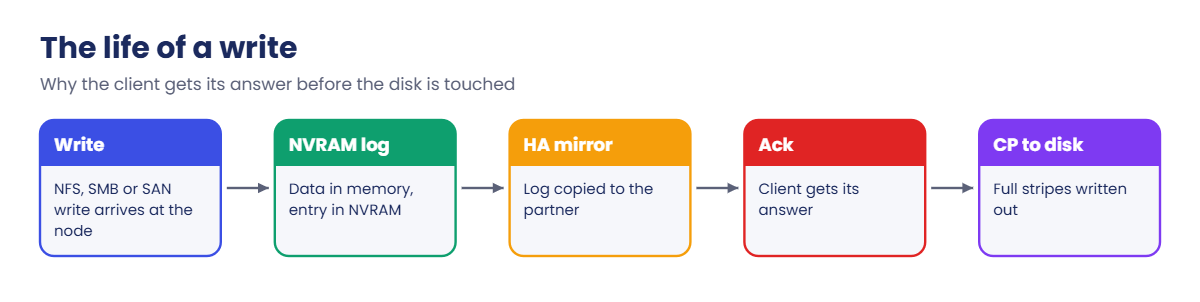
A client write lands in system memory and is also logged in NVRAM (battery- or flash-backed memory). In an HA pair the log is mirrored to the partner’s NVRAM over the HA interconnect, and only then does ONTAP acknowledge the write. NVRAM is a safety log, not a cache: in normal running it’s never read back.
Data reaches disk in a consistency point (CP), which writes everything changed in memory as full RAID stripes. A CP starts on a timer (about every 10 seconds), when half of the NVRAM log fills up, and for other reasons such as a Snapshot copy. Reads are answered from the WAFL buffer cache in memory when the block is there (a cache hit), and from Flash Cache or disk when it isn’t.
How it works, step by step
1The write arrives and is logged
An NFS, SMB or SAN write reaches the node that owns the aggregate. ONTAP puts the data in memory and writes a log entry into its NVRAM.
2The partner gets a copy, then the client gets its answer
The NVRAM entry is mirrored to the HA partner over the HA interconnect. As soon as both copies exist, the client gets its acknowledgement, which is why writes are fast even on hard disks.
3A consistency point writes to disk
Every few seconds, or when one half of the NVRAM log is full, WAFL starts a CP. It picks free blocks, builds full RAID stripes with parity and writes them out in one efficient pass, while new writes keep logging into the other half of NVRAM.
4Reads look in memory first
A read is checked against the buffer cache in memory. A hit returns in microseconds; a miss goes to Flash Cache (if fitted, Lesson 15) and then to the disks, which takes milliseconds on hard drives.
5If a node crashes
Data that was acknowledged but not yet in a CP is still in NVRAM. When the node boots, or when the partner takes over, ONTAP replays that NVRAM log, so no acknowledged write is lost.
| sysstat -x column | What it tells you | Worry when |
|---|---|---|
| Cache hit | Share of reads answered from memory | It drops sharply and latency rises |
| CP time | Share of the second spent in consistency points | It stays near 100% |
| CP ty | Why the CP started: T timer, F NVRAM log full, H memory high-water mark, B back-to-back | You see B often: a new CP had to start before the last one finished |
| Disk util | How busy the busiest disk is | It sits at 90 to 100% for minutes |
In System Manager you won’t see CPs directly. The nearest view is Cluster › Overview or the Dashboard performance panels (latency, IOPS, throughput).

Good to know: how reads use the cache
For a read, ONTAP looks in system memory first, then in Flash Cache if the controller has one, and only then on disk. Data read from disk is kept in memory, and the most recently used blocks stay near the top while older ones are pushed out.
WAFL also watches for patterns. When it sees a file being read in order, readahead fetches the next blocks before the client asks, so sequential reads are mostly served from memory.
If the client’s request lands on a node that doesn’t own the data, that node forwards it over the cluster network to the owner, which serves it from its own cache or disks.
Hands-on lab: watch writes, cache hits and consistency points
Before you run any command, double-check it
Read every command twice before you press Enter. Check the target: the server name, the user, the disk or device name, the path and the sizes. These commands are for learning and were tested in our lab, not on your system. At work, run the read-only commands first, follow your change process, make sure a backup exists, and ask a second person to check anything that changes or deletes data. You run them at your own risk.
This lab uses the SaatVedha ONTAP practice shell, our own learning tool. It is not NetApp software: real ONTAP output looks like this but is not identical.
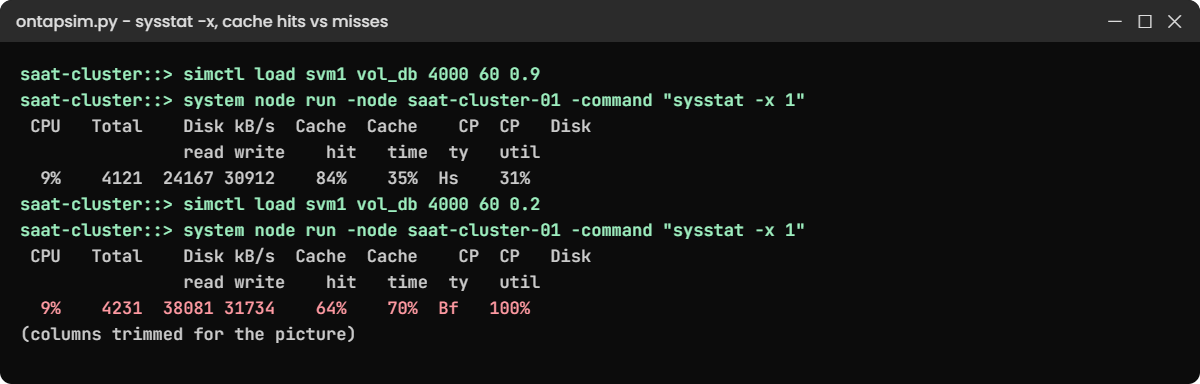
You’ll put a database-like workload on a volume and watch a node handle it twice: once with most reads in memory, and once with most reads missing the cache. The practice shell supports sysstat -M 1 and sysstat -x 1 in the nodeshell.
1Build the lab with a setup file
Create setup-14.txt in your lab folder with these lines:
storage aggregate create -aggregate aggr1_01 -node saat-cluster-01 -diskcount 8 -disktype SAS
vserver create -vserver svm1 -aggregate aggr1_01 -rootvolume-security-style unix
volume create -vserver svm1 -volume vol_db -aggregate aggr1_01 -size 100g
simctl write svm1 vol_db 20g dbThen run these two commands from your terminal:
python ontapsim.py -c "simctl reset"
python ontapsim.py --run setup-14.txtThe last line is a lab control: a client writes 20 GB of database files to the volume.
✅ Checkpoint: The output ends with “Client wrote 20GB to svm1:vol_db.” and has no Error lines.
2Look at a quiet node
Log in (admin / saatlab1) and run:
system node run -node saat-cluster-01 -command "sysstat -x 1"You should see this:
CPU NFS CIFS HTTP Total Net kB/s Disk kB/s Tape kB/s Cache Cache CP CP Disk
in out read write read write age hit time ty util
5% 0 0 0 0 0 0 0 0 0 0 >60 92% 22% Hs 5%
4% 0 0 0 0 0 0 0 0 0 0 >60 92% 22% Hs 4%
(practice shell: 3 samples.)No client operations, disks almost idle. Real sysstat keeps printing a line every second until you press Ctrl-C; the practice shell stops after three.
✅ Checkpoint: Total is 0 and Disk util is in single digits.
3Add a workload that mostly hits the cache
simctl load svm1 vol_db 4000 60 0.9
simctl tick 1
system node run -node saat-cluster-01 -command "sysstat -x 1"
qos statistics volume latency show -iterations 1The load line starts 4,000 IOPS at 60 MB/s, with 90% of reads already in memory. You should see this (your numbers will move a little):
CPU NFS CIFS HTTP Total Net kB/s Disk kB/s Tape kB/s Cache Cache CP CP Disk
in out read write read write age hit time ty util
9% 2703 772 0 3862 23175 34762 22648 28968 0 0 >60 84% 35% Hs 29%
9% 2885 824 0 4121 24729 37094 24167 30912 0 0 >60 84% 35% Hs 31%
8% 2645 755 0 3779 22676 34014 22160 28345 0 0 >60 84% 35% Hs 28%
saat-cluster::> qos statistics volume latency show -iterations 1
Workload ID Latency Network Cluster Data Disk QoS Max ...
--------------- ------ ---------- ---------- ---------- ---------- ---------- ---------- ...
-total- - 673.82us 56.94us 0ms 142.36us 474.52us 0ms ...
vol_db-wid2703 2703 673.82us 56.94us 0ms 142.36us 474.52us 0ms ...About 4,000 ops a second, cache hit 84%, disks around 30% busy and an average latency under a millisecond. The qos output is wider than shown here; the columns after QoS Max are all 0ms in this lab. Your workload ID will differ.
✅ Checkpoint: Latency is shown in us (microseconds), below 1 ms.
4See write-anywhere at work with a Snapshot copy
volume snapshot create -vserver svm1 -volume vol_db -snapshot before_change
simctl overwrite svm1 vol_db 2g
volume snapshot show -vserver svm1 -volume vol_dbYou should see this:
saat-cluster::> simctl overwrite svm1 vol_db 2g
Client changed 2GB of existing data in svm1:vol_db.
saat-cluster::> volume snapshot show -vserver svm1 -volume vol_db
---Blocks---
Vserver Volume Snapshot Size Total% Used%
-------- -------- ------------------------------------- -------- ------ -----
svm1 vol_db
before_change 2GB 2% 9%The Snapshot copy was free when you took it. Then the client changed 2 GB, WAFL wrote the new data to new blocks and the snapshot kept the old 2 GB, so now it “owns” 2 GB. Nothing was copied at snapshot time.
✅ Checkpoint: before_change shows a size of 2GB.
5Make the reads miss the cache
simctl load svm1 vol_db 4000 60 0.2
simctl tick 1
system node run -node saat-cluster-01 -command "sysstat -x 1"
qos statistics volume latency show -iterations 1You should see this:
CPU NFS CIFS HTTP Total Net kB/s Disk kB/s Tape kB/s Cache Cache CP CP Disk
in out read write read write age hit time ty util
9% 2690 768 0 3843 23061 34591 34591 28826 0 0 >60 64% 70% Bf 96%
9% 2961 846 0 4231 25387 38081 38081 31734 0 0 >60 64% 70% Bf 100%
9% 2889 825 0 4128 24769 37153 37153 30961 0 0 >60 64% 70% Bf 100%
saat-cluster::> qos statistics volume latency show -iterations 1
Workload ID Latency Network Cluster Data Disk QoS Max ...
--------------- ------ ---------- ---------- ---------- ---------- ---------- ---------- ...
-total- - 63.03ms 60.23us 0ms 150.57us 62.82ms 0ms ...
vol_db-wid2703 2703 63.03ms 60.23us 0ms 150.57us 62.82ms 0ms ...Same IOPS, very different node. Cache hit fell to 64%, disk reads jumped, the disks are at 100% and CP ty shows B: consistency points are running back to back because the disks can’t keep up. Latency went from under 1 ms to about 63 ms, and almost all of it is in the Disk column.
✅ Checkpoint: Disk util is near 100%, CP ty starts with B, and latency is in ms.
6Stop the workload
simctl load svm1 vol_db offThe workload stops, so the next lesson starts with a quiet node.
Try it yourself: Open “Find a slow volume” in the Command Builder.
Break It, Then Fix It
Two mistakes people make when they first chase a performance problem.
1Point sysstat at a node that does not exist
system node run -node saat-cluster-1 -command "sysstat -x 1"You’ll get this:
Error: command failed: Node "saat-cluster-1" does not exist.Node names must be exact. List them first, then run sysstat on the node that owns the busy aggregate (storage aggregate show shows the owner):
system node show -fields nodenode
---------------
saat-cluster-01
saat-cluster-02
2 entries were displayed.A quieter version of this mistake gives no error at all: you run sysstat on saat-cluster-02, see an idle node and decide storage is fine, while the load is on saat-cluster-01.
✅ Checkpoint: You ran sysstat on saat-cluster-01, the owner of aggr1_01.

2Reuse a Snapshot name
volume snapshot create -vserver svm1 -volume vol_db -snapshot before_changeYou’ll get this:
Error: command failed: Snapshot copy "before_change" already exists.Each Snapshot copy in a volume needs its own name. Add a date or a counter and check the list:
volume snapshot create -vserver svm1 -volume vol_db -snapshot before_change_2
volume snapshot show -vserver svm1 -volume vol_db ---Blocks---
Vserver Volume Snapshot Size Total% Used%
-------- -------- ------------------------------------- -------- ------ -----
svm1 vol_db
before_change 2GB 2% 9%
before_change_2 0B 0% 0%
2 entries were displayed.The new copy is 0B because nothing has changed since you took it.
✅ Checkpoint: Both Snapshot copies are listed.
This happened at work
The X-ray system that slowed down every morning
A hospital in Visakhapatnam kept its X-ray and CT images on a FAS pair with SAS disks. From about 8 a.m. the radiologists complained that images took ten or fifteen seconds to open, and by lunch it was fine again. The first guess was the network, and the network team spent two days finding nothing.
A storage engineer ran sysstat -x 1 on the owning node at 8:30 one morning. Cache hit was low, Disk util sat at 100% and the CP ty column kept showing B. A nightly archive job that copied the previous day’s scans to another volume had been growing for months and now ran well into the morning, so the radiologists’ reads and the archive writes were fighting over the same disks.
The team moved the archive job to start at 10 p.m. and finish by 5 a.m., and the slow mornings stopped that week. Later they moved the busiest imaging volumes to an SSD aggregate, and they now keep a sysstat capture from a normal morning so they can compare when someone says “it’s slow”.
Common mistakes and troubleshooting
| Mistake | What happens | Do this instead |
|---|---|---|
| Thinking NVRAM is a big write cache | You expect more NVRAM to fix slow disks | NVRAM is a safety log. Writes still have to reach disk in CPs, so slow disks still slow you down |
| Running sysstat on the wrong node | You see an idle node and close the case | Find the aggregate’s owner with storage aggregate show and run sysstat there |
| Reading one sysstat line | A single spike looks like a problem | Watch at least 30 to 60 seconds and compare with a normal day |
| Ignoring back-to-back CPs | Latency spikes for every write as clients wait for NVRAM space | When CP ty shows B often, reduce the load on that aggregate or add faster disks |
| Fearing Snapshot copies will “copy the volume” | People avoid snapshots before risky changes | WAFL snapshots only keep old blocks as data changes; take one before every change |
Interview questions
Click a question to open it. Each one is written the way an interviewer would ask it. Under it you will see why they ask it and one way you could answer, in your own words.
Fresher level
1. Can you explain in simple words what WAFL is?
Why they ask this: They want to know you understand the core idea behind ONTAP, not just the expansion of the name.
How you might answer: WAFL is ONTAP’s file system, Write Anywhere File Layout. It never overwrites a block in place: changed data goes to new free blocks and the pointers are updated.
That’s why Snapshot copies are so cheap, because a snapshot just keeps the old pointers.
2. What is NVRAM used for in an ONTAP node?
Why they ask this: They’re checking that you know NVRAM protects acknowledged writes and isn’t a general cache.
How you might answer: NVRAM holds a log of every write the node has acknowledged but not yet written to disk. It’s mirrored to the HA partner, so if the node crashes the log is replayed and nothing is lost. It isn’t read back in normal running; the data goes to disk from memory during a consistency point.
2–5 years experience
3. A user says writes are fast but reads are slow on a FAS system. What would you look at?
Why they ask this: They want to see that you can tell read and write paths apart and know which counters to check.
How you might answer: First I’d run sysstat -x 1 on the node that owns the aggregate and look at Cache hit and Disk util. Fast writes and slow reads usually mean reads are missing the memory cache and going to busy disks.
Then I’d use qos statistics volume latency show to confirm the Disk column is where the time goes, and find which volumes are doing the reads.
4. What does it mean when sysstat shows CP type B?
Why they ask this: They’re checking if you can read real node counters, which comes up in every performance case.
How you might answer: B means back-to-back consistency points: a new CP had to start before the previous one finished, because the NVRAM log half filled up again. Clients can see write latency jump while they wait. It points to disks that can’t absorb the write rate, so I’d look at disk utilisation and what’s writing to that aggregate.
Senior level
5. How would you explain to an application team why a Snapshot copy doesn’t hurt performance or space at the moment it’s taken?
Why they ask this: They want to see you can explain an internal design simply to non-storage people and set the right expectations.
How you might answer: I’d tell them ONTAP never overwrites data in place, so taking a snapshot just freezes the current list of pointers. It takes a second and uses no space at that moment.
Space grows only as their data changes, because the snapshot keeps the old blocks. So the cost depends on their change rate, and I’d size the snapshot reserve from that.
6. An HA pair is planned for a write-heavy logging app. What would you check about NVRAM and consistency points before go-live?
Why they ask this: They want to see you think about write paths, HA mirroring and disk capacity together.
How you might answer: I’d confirm the HA interconnect is healthy, because every write is mirrored to the partner’s NVRAM before it’s acknowledged. Then I’d load test and watch sysstat -x for CP time and back-to-back CPs.
If CPs run back to back, the aggregate needs more or faster disks, or the load should be split across aggregates on both nodes.
Quick quiz
Q1. When does ONTAP send the write acknowledgement to the client?
- After the data is on disk
- After the data is logged in NVRAM and mirrored to the HA partner
- After the next Snapshot copy
- After the read cache is updated
Show answer
B — the write is safe once it is in NVRAM on both nodes, so the client gets its answer then.
Q2. What does WAFL do when a block is changed?
- Overwrites it in place
- Writes the new data to a free block and updates pointers
- Copies the whole file
- Sends it to NVRAM only
Show answer
B — WAFL writes anywhere: new data goes to new blocks, which is what makes snapshots cheap.
Q3. Which of these starts a consistency point?
- A client mounting a volume
- Half of the NVRAM log filling up
- A LIF moving to another port
- A user logging in to System Manager
Show answer
B — a CP starts on a timer, when the NVRAM log half fills, and for some other events such as Snapshot copies.
Q4. In sysstat -x, what does a falling Cache hit with Disk util near 100% suggest?
- The network is slow
- Reads are missing memory and the disks are overloaded
- NVRAM has failed
- The node is idle
Show answer
B — more reads go to disk, the disks saturate and latency rises.
Q5. Is NVRAM read back during normal running?
- Yes, every read comes from NVRAM
- Yes, during every CP
- No, it is only replayed after a crash or takeover
- Only for SMB clients
Show answer
C — CPs write from memory; NVRAM is only replayed when a node recovers from a failure.
Quick recap
- WAFL writes changed data to new blocks and never overwrites in place.
- Writes are logged in NVRAM, mirrored to the HA partner, then acknowledged.
- Consistency points write everything to disk in full RAID stripes, about every 10 seconds or when half the log fills.
- Reads come from the memory cache first; misses go to Flash Cache or disk.
- sysstat -x shows Cache hit, CP time, CP type and Disk util; B means back-to-back CPs.
Next lesson
Lesson 15: Flash Cache, Flash Pool and storage pools → You’ll add SSDs as a cache for a hard-disk aggregate and see what it does to reads.
Further reading: NetApp WAFL
Want to go deeper into NetApp WAFL? Read NetApp’s ONTAP concepts guide for how nodes, HA pairs and storage fit together, and search the NetApp Knowledge Base for “What is Consistency Point” for more detail on CP types. You can also see the full plan for this course on the NetApp ONTAP Storage Administration course page.
