Active IQ Unified Manager monitoring
-
Phase 0: Start here
-
Phase 1: Architecture and foundation
-
Phase 2: Protocols and day-to-day administration
-
Phase 3: Data protection and enterprise integrations
-
Phase 4: Troubleshooting blueprint
-
Phase 5: Final project and career
With one cluster you can log in each morning and run the health check from Lesson 1. With twelve clusters in four cities, you need something that watches all of them all the time and tells you before an aggregate fills or a SnapMirror lag grows.
NetApp’s tool for that is Active IQ Unified Manager (people say “AIQUM” or “Unified Manager”). It runs on your own server, so it isn’t something you can install inside the practice shell, but everything it reports comes from numbers you can read with ONTAP commands. You’ll check those numbers yourself, learn its default thresholds, and set up the alerting habits that matter.
Where this lesson fits
Lesson 45 of 56 in NetApp ONTAP Storage Administration · Phase 3: Data protection and integrations · Before this: Lesson 44, QoS limits · Next: Lesson 46, FabricPool tiering
| Time | You need | By the end you can |
|---|---|---|
| 45 minutes | The practice shell with svm1 and two data aggregates | Explain what Unified Manager collects, name its default capacity thresholds, spot overcommitment and full aggregates, and check AutoSupport |
What it is, in one line
Active IQ Unified Manager is NetApp’s on-premises monitoring server for ONTAP: it polls your clusters, compares capacity, performance and protection data against thresholds, and raises events and alerts when something needs attention.
In Simple Words
The building’s security control room
A big apartment complex doesn’t send a guard to every floor every hour. One control room shows camera feeds, lift status and water tank levels from all the towers on one wall of screens.
The operator sets rules like “ring the bell if a tank falls below 20%”, so nobody has to stare at every screen all night. Unified Manager is that control room for your clusters, and the alert rules are only as good as the person who set them.
Engineer's View
How an engineer describes it
Unified Manager is deployed as a virtual appliance on VMware or installed on Linux or Windows. You add each cluster with its management IP and an account, and it collects configuration, capacity and performance data on a schedule. It keeps history, so it can show trends such as days until an aggregate is full, and performance views per volume, node and aggregate, much like the QoS statistics from Lesson 44.
Data is compared with thresholds. For aggregates the defaults are 80% nearly full, 90% full, 95% nearly overcommitted, 100% overcommitted and 15 days until full; volumes have similar settings. A breach raises an event (information, warning, error or critical), and alerts send chosen events by e-mail or SNMP, or run a script.
It also watches SnapMirror and vault relationships for lag and failures, shows cluster and SVM health, and can export reports. Its cloud cousin, Digital Advisor (formerly called Active IQ), analyses the AutoSupport messages the clusters send to NetApp, which is why a working AutoSupport matters too.
How it works, step by step
1Deploy and add clusters
Deploy the appliance, give it an IP and DNS name, and add each cluster with an account that has the rights Unified Manager needs. The first full collection takes a little while.
2Review thresholds
Keep the defaults to start, then tighten them where it matters: a fast-growing aggregate might need nearly full at 70%, a SnapMirror relationship a lag threshold that matches its schedule.
3Set alerts
Send error and critical events for capacity, node health and protection to a team mailbox or your ticketing tool, not to one person. Too many warnings and people stop reading them.
4Use the trends
Days until full and growth rate turn surprises into planned purchases. A monthly capacity report built from Unified Manager data is often what convinces finance to approve new shelves.
| Unified Manager shows | You can check it on the cluster with |
|---|---|
| Aggregate space and thresholds | storage aggregate show -fields percent-used |
| Overcommitment of thin volumes | volume show -fields size,space-guarantee |
| Volume latency and IOPS | qos statistics volume latency show |
| SnapMirror lag and health | snapmirror show -fields healthy,lag-time |
| Cluster and node events | event log show -severity <=ERROR |
5Act on events
Each event has a page with the cause and suggested actions. Assign it, add notes and resolve it, so the next shift knows what happened.
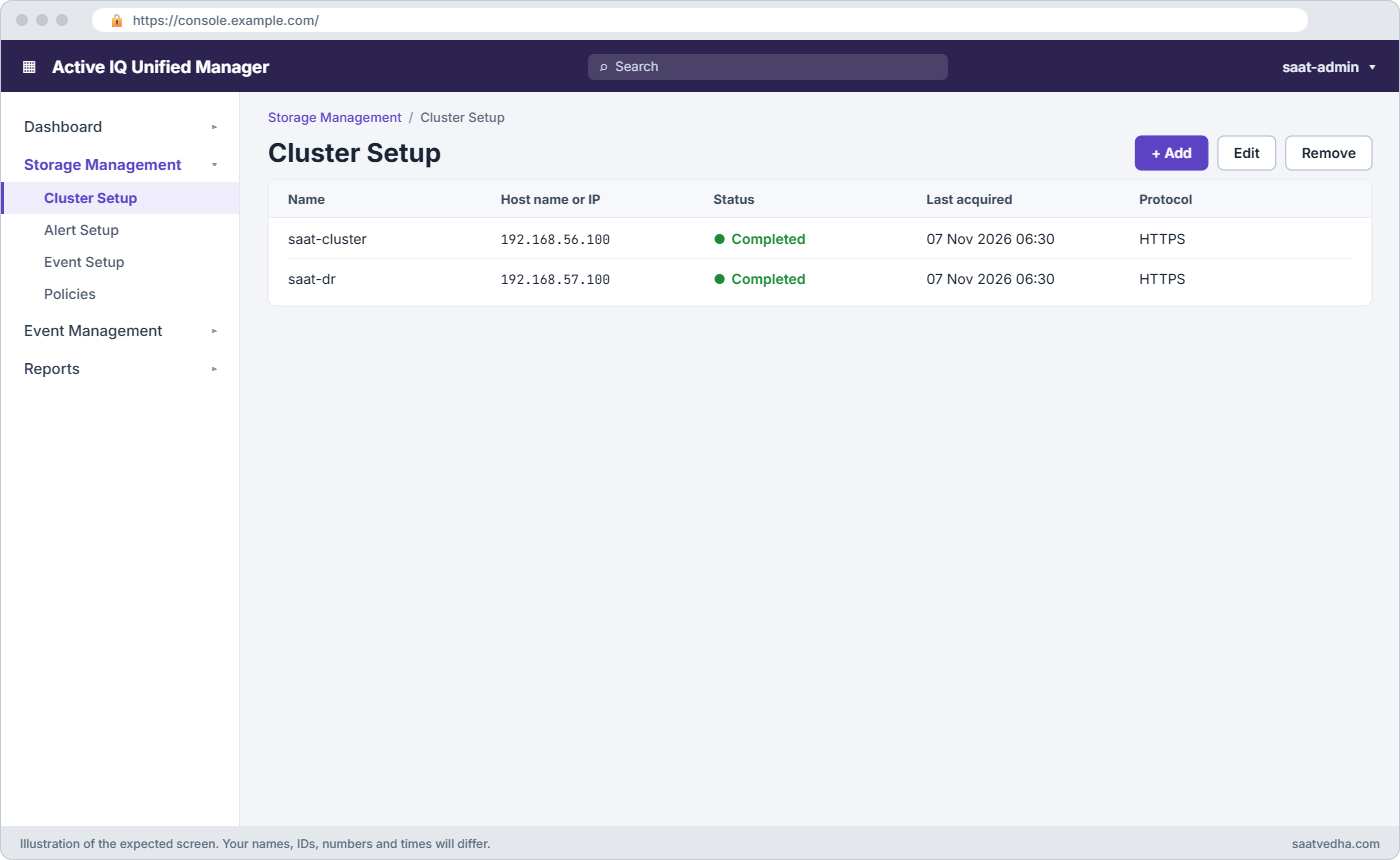
In Unified Manager’s web UI, Storage Management › Cluster Setup › Add adds a cluster, Storage Management › Alert Setup creates alerts, and Storage Management › Event Setup or the threshold settings change thresholds. Menu names vary between versions.
Good to know: the management family and its old names
NetApp’s management tools have been renamed several times, and team documents often use the old names. OnCommand Unified Manager became Active IQ Unified Manager, and the separate Performance Manager was folded into it, so one appliance now covers capacity, protection and performance.
OnCommand Workflow Automation (WFA) automated provisioning and cloning; most teams now use the ONTAP REST API or Ansible for that work. OnCommand Insight, the multi-vendor monitoring tool, became Cloud Insights and was renamed Data Infrastructure Insights in December 2024.
Cloud Manager, used to deploy Cloud Volumes ONTAP, became BlueXP, which NetApp renamed NetApp Console in 2025. Active IQ, the cloud analysis of AutoSupport data, is now called Digital Advisor.
Hands-on lab: check capacity the way a monitoring server does
Before you run any command, double-check it
Read every command twice before you press Enter. Check the target: the server name, the user, the disk or device name, the path and the sizes. These commands are for learning and were tested in our lab, not on your system. At work, run the read-only commands first, follow your change process, make sure a backup exists, and ask a second person to check anything that changes or deletes data. You run them at your own risk.
This lab uses the SaatVedha ONTAP practice shell, our own learning tool. It is not NetApp software: real ONTAP output looks like this but is not identical.
Unified Manager itself can’t run in the practice shell, so you’ll do its job by hand: read the same capacity numbers and judge them against its default thresholds. Start from the usual setup with svm1, aggr1_01 and aggr1_02.
1A thick volume and the aggregate view
volume create -vserver svm1 -volume vol_cctv -aggregate aggr1_01 -size 2t -junction-path /cctv
storage aggregate show -fields size,usedsize,availsize,percent-usedYou should see this:
aggregate size usedsize availsize percent-used
--------------------- ------ -------- --------- ------------
aggr0_saat_cluster_01 1.47TB 140.0GB 1.33TB 9%
aggr0_saat_cluster_02 1.47TB 140.0GB 1.33TB 9%
aggr1_01 8.80TB 2.00TB 6.80TB 23%
aggr1_02 8.80TB 187.6MB 8.80TB 0%
4 entries were displayed.vol_cctv has a volume guarantee, so its full 2 TB is reserved in aggr1_01 even though no camera has written anything yet. 23% is well below the 80% nearly full threshold.
✅ Checkpoint: aggr1_01 shows about 23% used.
2Promise more than you have
volume create -vserver svm1 -volume vol_dev1 -aggregate aggr1_02 -size 4t -space-guarantee none
volume create -vserver svm1 -volume vol_dev2 -aggregate aggr1_02 -size 4t -space-guarantee none
volume create -vserver svm1 -volume vol_dev3 -aggregate aggr1_02 -size 4t -space-guarantee none
volume show -vserver svm1 -aggregate aggr1_02 -fields size,used,space-guarantee
storage aggregate show -aggregate aggr1_02 -fields size,usedsize,percent-usedYou should see this:
vserver volume size used space-guarantee
------- -------- ---- ------ ---------------
svm1 vol_dev1 4TB 1.23GB none
svm1 vol_dev2 4TB 1.23GB none
svm1 vol_dev3 4TB 1.23GB none
3 entries were displayed.
saat-cluster::> storage aggregate show -aggregate aggr1_02 -fields size,usedsize,percent-used
aggregate size usedsize percent-used
--------- ------ -------- ------------
aggr1_02 8.80TB 3.87GB 0%The aggregate says 0% used, but three thin volumes promise 12 TB on 8.8 TB of space, which is about 136% committed. percent-used alone hides that; Unified Manager would raise an Overcommitted event because it’s over 100%. Thin provisioning is fine (Lesson 33), as long as someone watches the real usage.
✅ Checkpoint: You can work out the 136% commitment.
3Fill an aggregate past the full threshold
simctl break aggr-fill aggr1_01 92
storage aggregate show -fields size,usedsize,availsize,percent-usedYou should see this:
aggregate size usedsize availsize percent-used
--------------------- ------ -------- --------- ------------
aggr0_saat_cluster_01 1.47TB 140.0GB 1.33TB 9%
aggr0_saat_cluster_02 1.47TB 140.0GB 1.33TB 9%
aggr1_01 8.80TB 8.10TB 721.1GB 92%
aggr1_02 8.80TB 3.87GB 8.80TB 0%
4 entries were displayed.92% is above the 90% full threshold, so Unified Manager would raise an Aggregate Space Full error and send the alert you configured. The fixes are the ones you know: move a volume to aggr1_02, delete old snapshots, or add disks. Clear the lab fault with simctl fix aggr-fill.
✅ Checkpoint: aggr1_01 shows 92% and you can name two fixes.
4Check the AutoSupport settings
system node autosupport show -node * -fields state,transport,toYou should see this:
Node State From To Mail Hosts
--------------------- -------- --------------------- -------------------- ---------------
saat-cluster-01 enable admin@localhost - mailhost
saat-cluster-02 enable admin@localhost - mailhost
2 entries were displayed.AutoSupport is on. Unified Manager watches the cluster from inside your network; AutoSupport is how NetApp and Digital Advisor see it from outside, and it’s what opens support cases for failed disks automatically.
✅ Checkpoint: Both nodes show State enable.

Try it yourself: Build the capacity check in the Command Builder.
Break It, Then Fix It
A firewall change can quietly cut a cluster off from NetApp. Here’s how it looks and how to prove the fix.

1AutoSupport can’t reach NetApp
simctl break asup-blocked
system node autosupport invoke -node saat-cluster-01 -type test -message "aiqum test"
system node autosupport history show -node saat-cluster-01You’ll get this:
The AutoSupport was successfully invoked on node "saat-cluster-01". To view the status
of the AutoSupport, use the "system node autosupport history show" command.
Note: It may take several minutes for the AutoSupport to appear in the history list.
saat-cluster::> system node autosupport history show -node saat-cluster-01
Node Seq Num Destination Last Update Status
--------------- ------- ----------- ------------------- ----------------------
saat-cluster-01 100 https 11/7/2026 07:17:52 transmission-failed
saat-cluster-02 100 https 11/7/2026 07:17:52 transmission-failed
2 entries were displayed.“Successfully invoked” only means the message was created. The history shows the truth: transmission-failed. Until this is fixed, NetApp won’t hear about failed disks and Digital Advisor’s view of the cluster gets older every day.
2Fix and prove it
simctl fix asup-blocked
system node autosupport invoke -node saat-cluster-01 -type test -message "aiqum test 2"
simctl tick 1
system node autosupport history show -node saat-cluster-01The new lines should say:
saat-cluster-01 101 https 11/7/2026 07:18:02 sent-successful
saat-cluster-02 101 https 11/7/2026 07:18:02 sent-successfulOn a real cluster the fix is usually a firewall or proxy rule for HTTPS to NetApp’s AutoSupport address, and system node autosupport check show-details helps find which step fails. The practice shell shows both nodes even when you filter by one. Make a Unified Manager alert for AutoSupport failures so the next firewall change doesn’t go unnoticed.
✅ Checkpoint: The newest history entry says sent-successful.
This happened at work
Alerts nobody received
A university in Shillong had Unified Manager watching two clusters, with alerts set up by a contractor during installation. One Monday the student records portal stopped saving files: the aggregate under it was 100% full.
Unified Manager had raised Nearly Full on the Tuesday before and Full on the Thursday. Both events were sitting in its event list, and both alert e-mails had gone to the contractor’s address, which had stopped working when his contract ended months earlier.
The team freed space by deleting old manual snapshots and moving an archive volume, which took an hour. Then they pointed every alert at a team mailbox, added the ticketing system as a second target, and put “check Unified Manager alert recipients” on the list of things to do whenever someone leaves.
Common mistakes and troubleshooting
| Mistake | What happens | Do this instead |
|---|---|---|
| Alerts sent to one person | Events are missed when that person is away or leaves | Send to a team mailbox and a ticketing system |
| Watching only percent-used | Thin volumes overcommit an aggregate without anyone noticing | Watch committed capacity and days until full too |
| Alerting on every warning | People get hundreds of mails and ignore them all | Alert on error and critical; review warnings in a weekly report |
| Never updating thresholds | A fast-growing aggregate fills between the 80% and 90% alerts | Use days until full and tighten thresholds where growth is fast |
| Assuming AutoSupport works because it’s enabled | NetApp never hears about failures | Check autosupport history and alert on transmission failures |
Interview questions
Click a question to open it. Each one is written the way an interviewer would ask it. Under it you will see why they ask it and one way you could answer, in your own words.
Fresher level
1. What is Active IQ Unified Manager used for?
Why they ask this: They want to know you understand monitoring at scale.
How you might answer: It’s NetApp’s on-premises monitoring server for ONTAP. It collects capacity, performance and protection data from all our clusters, compares it with thresholds and raises events and alerts, so we find problems before users do.
2. What are the default aggregate space thresholds in Unified Manager?
Why they ask this: They’re checking practical knowledge of the tool.
How you might answer: Nearly full at 80% and full at 90%. There are also commitment thresholds, nearly overcommitted at 95% and overcommitted at 100%, and a days-until-full threshold of 15 days.
2–5 years experience
3. An aggregate shows 10% used, but Unified Manager says it’s overcommitted. Is that a real problem?
Why they ask this: They want to see you understand thin provisioning risk.
How you might answer: It means the thin volumes on it promise more space than the aggregate has, so it’s a risk rather than an outage. I’d look at actual growth and days until full; if growth is slow it can be acceptable, but I’d keep a plan to move volumes or add disks before real usage catches up.
4. How would you set up alerting so the team isn’t flooded but nothing important is missed?
Why they ask this: They want sensible operational judgement.
How you might answer: I’d alert on error and critical events for capacity, node health and SnapMirror to a team mailbox and the ticketing tool. Warnings go into a daily or weekly report instead. I’d tune thresholds for fast-growing aggregates and review the alert list whenever someone joins or leaves.
Senior level
5. You manage twenty clusters across India. How would you build a monitoring and capacity planning process?
Why they ask this: They want a design that combines tools, thresholds and people.
How you might answer: Unified Manager would watch all clusters with tuned thresholds and alerts into our ticketing tool, and AutoSupport plus Digital Advisor would give NetApp’s view and upgrade risks.
Every month I’d export capacity and growth reports, flag anything under 90 days until full, and turn those into purchase or rebalancing plans before they become emergencies.
6. Leadership asks why you need Unified Manager when ONTAP already has System Manager. What do you say?
Why they ask this: They’re testing whether you can explain value in business terms.
How you might answer: System Manager manages one cluster at a time and shows its current state. Unified Manager watches all clusters together, keeps history, predicts when things will fill, tracks replication across sites and sends alerts.
That turns outages into planned work, which costs far less than one failed aggregate.
Quick quiz
Q1. What is the default aggregate “full” threshold in Unified Manager?
- 70%
- 80%
- 90%
- 100%
Show answer
C — nearly full is 80%, full is 90%.
Q2. Three 4 TB thin volumes sit on an 8.8 TB aggregate. What does Unified Manager report?
- Nothing
- Overcommitted
- Space full
- Node down
Show answer
B — 12 TB promised on 8.8 TB is over 100% committed.
Q3. Where does Unified Manager run?
- Inside ONTAP
- On your own VM or server
- Only in the public cloud
- On the SAN switch
Show answer
B — it’s deployed as an appliance or on Linux or Windows.
Q4. Which status in autosupport history means NetApp did not receive the message?
- sent-successful
- transmission-failed
- ignore
- collecting
Show answer
B — transmission-failed means it didn’t get out.
Q5. What is the best place to send critical alerts?
- One engineer’s personal mail
- A team mailbox or ticketing system
- Nowhere; check the UI daily
- The NetApp sales team
Show answer
B — shared destinations survive leave and staff changes.
Quick recap
- Unified Manager watches capacity, performance and protection on all your clusters.
- Default aggregate thresholds: 80% nearly full, 90% full, 100% overcommitted.
- percent-used hides thin overcommitment; watch committed space and days until full.
- Send alerts to a team, not a person, and alert on errors, not every warning.
- Check AutoSupport history; enabled isn’t the same as working.
Next lesson
Lesson 46: FabricPool tiering to S3 → You’ll attach an S3 bucket as a cloud tier and move cold snapshot blocks off your SSDs.
Further reading: Active IQ Unified Manager
Want to go deeper into Active IQ Unified Manager? Read NetApp’s Aggregate Thresholds page for every threshold and its default, and the guide to configuring global aggregate thresholds. You can also see the full plan for this course on the NetApp ONTAP Storage Administration course page.
