Prometheus and Node Exporter dashboards in Grafana
-
Phase 1: Grafana setup and your first dashboards
-
Phase 2: Data sources, logs and metrics
-
Phase 3: Alerting, teams and running Grafana
A good Grafana Node Exporter dashboard takes days to build by hand, and the community has already built one that most Linux teams use: Node Exporter Full, ID 1860 on grafana.com. In this lesson you import it, learn what each row is telling you, and make your own copy so updates never wipe your changes. You also point Prometheus at Grafana’s own /metrics page and build a small “Grafana health” dashboard, so you know when the monitoring tool itself is struggling.
Along the way you’ll add a recording rule for the busiest query, look inside a dashboard’s JSON model and UID, and break imports the three ways they break at work: a data source placeholder nobody filled in, a job label that doesn’t match, and two dashboards fighting over one UID.
Where this lesson fits
Lesson 9 of 14 in Grafana Dashboards and Observability · Phase 2: Data sources, logs and metrics · Before this: Lesson 8, Nginx logs and LogQL · Next: Lesson 10, InfluxDB and Telegraf
| Time | You need | By the end you can |
|---|---|---|
| About 80 minutes | graf01 and app01 from Lesson 8, with Prometheus scraping node_exporter on both (Lesson 4) | Import and safely customise Node Exporter Full, monitor Grafana with Prometheus, and fix the common import errors |
What it is, in one line
Node Exporter exposes hundreds of Linux metrics, Prometheus stores them, and an imported dashboard like Node Exporter Full turns them into ready-made rows of CPU, memory, disk and network panels that you then adapt to your own servers.
In Simple Words
The tailor’s ready-made pattern
A tailor in Coimbatore doesn’t draw a new shirt pattern for every customer. He keeps a ready-made paper pattern that works for most people, traces it onto the cloth, and then adjusts the sleeves and collar for the person in front of him. He never cuts the master pattern itself, because next season the pattern company sends an improved version and he wants to use that too.
Node Exporter Full is the master pattern, your saved copy is the traced cloth you adjust, and the UID is the pattern’s number that tells Grafana which one is which.
Engineer's View
What you are importing and where it lives
A Grafana dashboard is one JSON document. It holds the panels and their queries, the variables, the time settings, a uid (the stable identifier used in URLs and the API), a title and a version that goes up on every save. When you import from grafana.com, Grafana downloads that JSON, lets you choose a folder, a title and a UID, and saves it in its database (/var/lib/grafana/grafana.db in this lab).
| Piece | In Node Exporter Full | Why it matters |
|---|---|---|
| uid | rYdddlPWk (kept on import unless you change it) | Two dashboards can’t share a UID in one organisation |
| ds_prometheus variable | Data source picker, type prometheus | Panels follow whatever Prometheus you pick, no hard-coded UID |
| job variable | label_values(node_uname_info, job) | Works whether your job is called node, node_exporter or linux |
| nodename and node variables | nodename from node_uname_info, then instance for that nodename | Pick a server by hostname, query it by instance |
| Rows | Quick CPU / Mem / Disk, Basic CPU / Mem / Net / Disk, then collapsed detail rows | The first two rows answer 90% of questions; open the others when digging |
Exported dashboards come in two shapes. A normal export keeps the real data source UIDs. An export for another instance replaces them with placeholders such as ${DS_PROMETHEUS} and lists them under __inputs; the Import page asks you to map each input, but the API and file provisioning don’t, which is the source of Break 1.
Grafana is also a Prometheus target. With [metrics] enabled = true (the default) it serves /metrics on its own port, including grafana_build_info, grafana_http_request_duration_seconds with handler, method and status_code labels, grafana_stat_totals_dashboard and the usual process_ and go_ metrics.
How it works, step by step
1Grafana fetches the JSON and asks a few questions
On Dashboards > New > Import you type an ID (or paste JSON). Grafana downloads the latest revision from grafana.com, shows its name, folder and UID, and, if the JSON has __inputs, a drop-down for each data source it needs. When you click Import it saves the dashboard like any other, so from then on it’s yours and grafana.com isn’t involved any more.
The diagram follows a dashboard from grafana.com to a panel on your screen.
2Variables resolve before any panel runs
When the dashboard opens, Grafana first runs the variable queries in order: job, then nodename filtered by job, then node filtered by both. Only then does it run the panel queries, with $job and $node replaced by the chosen values. If a variable comes back empty, every panel below it shows No data, which is the first place to look when an imported dashboard looks dead.
3Prometheus scrapes three kinds of target
After this lesson Prometheus on graf01 scrapes itself, node_exporter on both VMs and Grafana. Each job adds its own job label, and that label is what dashboards filter on, so its value has to match what the dashboard expects. The diagram below shows the three jobs and what each one feeds.
4Recording rules make heavy panels cheap
A panel query runs on every refresh, for every viewer. CPU busy over 5 minutes for 200 servers on a TV screen refreshing every 30 seconds is a lot of repeated work. A recording rule runs that expression once per evaluation interval and stores the answer as a new series, so panels read a small, ready-made result.
| Query style | Example | Cost per refresh |
|---|---|---|
| Raw, in every panel | 100 * (1 – avg by (instance) (rate(node_cpu_seconds_total{mode=”idle”}[5m]))) | Reads every CPU core series for the range |
| Recorded once | instance:node_cpu_utilisation:rate5m | Reads one series per server |
| Rule name format | level:metric:operations | Tells readers what was aggregated and how |
Hands-on lab: import Node Exporter Full, scrape Grafana and build a Grafana health dashboard
Before you run any command, double-check it
Read every command twice before you press Enter. Check the target: the server name, the user, the disk or device name, the path and the sizes. These commands are for learning and were tested in our lab, not on your system. At work, run the read-only commands first, follow your change process, make sure a backup exists, and ask a second person to check anything that changes or deletes data. You run them at your own risk.
Most steps are in Grafana at https://graf01.lab/ (log in as admin with Lab@Grafana2026). The Prometheus changes run on graf01 (192.168.56.70). app01 (192.168.56.71) only needs node_exporter running, which it has had since Lesson 4.
1Check what Prometheus already scrapes
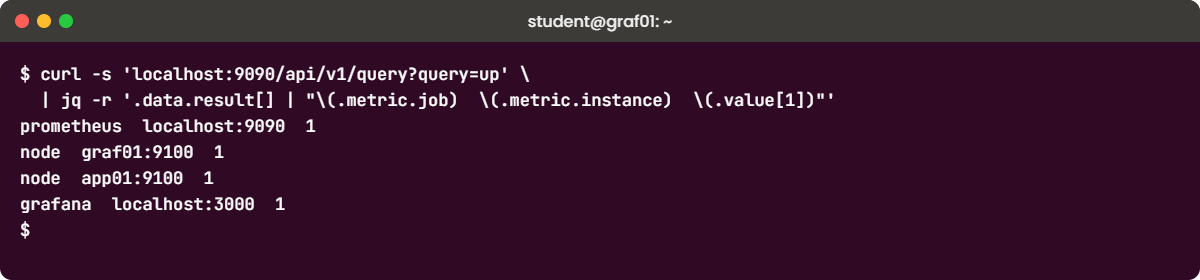
Run this on graf01:
curl -s 'localhost:9090/api/v1/query?query=up' \
| jq -r '.data.result[] | "\(.metric.job) \(.metric.instance) \(.value[1])"'
curl -s 'localhost:9090/api/v1/query?query=node_uname_info' \
| jq -r '.data.result[] | "\(.metric.job) \(.metric.instance) \(.metric.nodename)"'You should see this (the lines can come in a different order):
prometheus localhost:9090 1
node graf01:9100 1
node app01:9100 1
node graf01:9100 graf01
node app01:9100 app01Both node_exporters are up under job="node", and node_uname_info carries the hostname as nodename. Node Exporter Full builds its drop-downs from this metric. If app01 shows 0, check systemctl status node_exporter on app01 and its ufw rule for 9100 from graf01.
✅ Checkpoint: up returns 1 for prometheus, graf01:9100 and app01:9100.
2Import Node Exporter Full (1860)
In Grafana go to Dashboards > New > Import. Type 1860 in the grafana.com box and click Load. Grafana (on graf01, which has internet through its NAT adapter) downloads the latest revision.
Leave the name as Node Exporter Full, pick the folder SaatVedha Lab, leave the UID as it is and click Import.

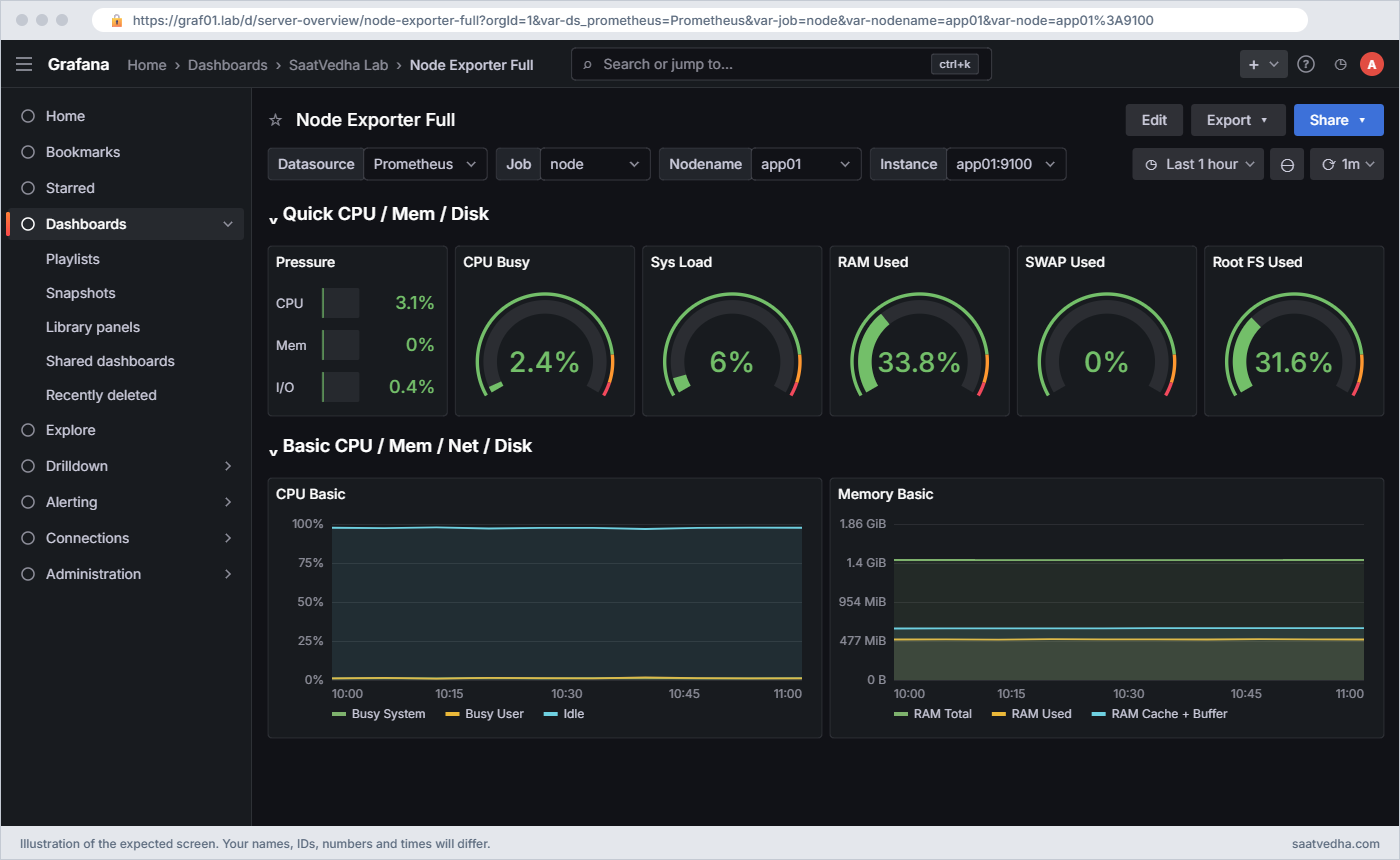
At the top pick Job node, Nodename app01 and the panels fill in. Switch to graf01 and they change. If your laptop shows an error about reaching grafana.com, download the JSON on your laptop from the dashboard’s page and use Upload dashboard JSON file instead.
✅ Checkpoint: Node Exporter Full is in SaatVedha Lab and shows data for both app01 and graf01.
3Read the rows like an engineer
Spend five minutes on app01’s view with the time range set to the last 1 hour. The first two rows are open, the rest are collapsed; click a row title to open it.
| Row | What to look at first | What it tells you |
|---|---|---|
| Quick CPU / Mem / Disk | CPU Busy, Sys Load, RAM Used, SWAP Used, Root FS Used | A one-glance health check; Sys Load is load per CPU in percent |
| Basic CPU / Mem / Net / Disk | CPU Basic split by mode, Memory Basic, Network Traffic Basic | Whether CPU is user work, system work or iowait (waiting on disk) |
| CPU / Memory / Net / Disk | Disk IOps, I/O utilisation, network errors | Which resource is saturated when the server is slow |
| Memory Details | Active vs inactive, page faults, OOM kills | Whether “high memory” is cache (fine) or real pressure |
| Storage | Filesystem space and inodes per mount, disk latency | A full /var/log or running out of inodes |
| Network Traffic / Sockstat / Netstat | Per-interface bytes, drops, TCP states, retransmits | Packet loss and connection storms |
| Systemd and Node Exporter | Unit states, scrape duration per collector | Failed units, and whether node_exporter itself is slow |
On a 1.5 GB app01 with MySQL, the RAM Used gauge may look high, and the Memory Details row shows most of it is page cache that Linux gives back when needed. Reading that before raising a ticket saves a lot of embarrassment.
✅ Checkpoint: You can point to CPU Busy, RAM Used and Root FS Used for app01 and explain what iowait means.
4Save your own copy and leave the original alone
Open Node Exporter Full, click Edit, then the arrow next to Save dashboard and choose Save as copy. Name it Node Exporter (SaatVedha), folder SaatVedha Lab, and save. Grafana gives the copy a new UID.
Now make one change in the copy only: on Root FS Used set thresholds to green base, orange 75 and red 90, then save with the note “lab thresholds”.
Run this on graf01 to list both:
curl -s -u admin:Lab@Grafana2026 'localhost:3000/api/search?query=Node%20Exporter' \
| jq -r '.[] | "\(.uid) \(.title) [\(.folderTitle)]"'You should see this (your copy gets its own UID):
rYdddlPWk Node Exporter Full [SaatVedha Lab]
dg3oenca811aca Node Exporter (SaatVedha) [SaatVedha Lab]The original keeps rYdddlPWk, which is the UID the community JSON ships with. When a new revision comes out you can import it over the original (same UID) without touching your copy, compare the two, and move over the panels you like.
✅ Checkpoint: Two dashboards exist: the untouched original with UID rYdddlPWk and your copy with a new UID and changed thresholds.
5Let Prometheus scrape Grafana itself
Grafana is bound to 127.0.0.1:3000 since Lesson 3, which is fine because Prometheus runs on the same VM. First look at the page, then add a grafana job. The new file is the Lesson 4 file plus the grafana job and a rule_files line you’ll use in step 7.
Paste this whole block on graf01:
curl -s localhost:3000/metrics | grep -E '^grafana_build_info|^grafana_stat_totals_dashboard '
sudo tee /etc/prometheus/prometheus.yml >/dev/null <<'EOF'
global:
scrape_interval: 15s
evaluation_interval: 15s
rule_files:
- /etc/prometheus/rules/*.yml
scrape_configs:
- job_name: "prometheus"
static_configs:
- targets: ["localhost:9090"]
- job_name: "node"
static_configs:
- targets: ["graf01:9100", "app01:9100"]
- job_name: "grafana"
static_configs:
- targets: ["localhost:3000"]
EOF
sudo mkdir -p /etc/prometheus/rules
promtool check config /etc/prometheus/prometheus.yml
curl -s -X POST localhost:9090/-/reload && echo reloadedThe first line of output is grafana_build_info, a constant 1 whose labels carry version="13.3.0", edition="oss", the Go version and the commit Grafana was built from. After it you should see this (your dashboard count will differ):
grafana_stat_totals_dashboard 6
Checking /etc/prometheus/prometheus.yml
SUCCESS: /etc/prometheus/prometheus.yml is valid prometheus config file syntax
reloadedThe reload endpoint works because Lesson 4 started Prometheus with --web.enable-lifecycle. Open Status > Target health in the Prometheus UI (http://192.168.56.70:9090) and the grafana job shows one target, UP.
✅ Checkpoint: Target health shows job grafana with localhost:3000 UP.
6Stop /metrics leaking through Nginx
Nginx forwards everything under https://graf01.lab/ to Grafana, so right now anyone on the network can read /metrics through it. Prometheus reads it locally, so block it at the proxy:
Paste this whole block on graf01:
curl -sk -o /dev/null -w "%{http_code}\n" https://graf01.lab/metrics
sudo sed -i '0,/location \/ {/s//location = \/metrics { deny all; }\n\n location \/ {/' /etc/nginx/sites-available/grafana
sudo nginx -t && sudo systemctl reload nginx
curl -sk -o /dev/null -w "%{http_code}\n" https://graf01.lab/metricsYou should see:
200
nginx: the configuration file /etc/nginx/nginx.conf syntax is ok
nginx: configuration file /etc/nginx/nginx.conf test is successful
403The sed adds a location = /metrics block just before the first location / in the site. If you’d rather keep it reachable for a remote Prometheus, set basic_auth_username and basic_auth_password under [metrics] in grafana.ini instead.
✅ Checkpoint: https://graf01.lab/metrics returns 403 while curl localhost:3000/metrics on graf01 still works.
7Add a recording rule for CPU busy
Paste this whole block on graf01:
sudo tee /etc/prometheus/rules/node.yml >/dev/null <<'EOF'
groups:
- name: node-recording
interval: 30s
rules:
- record: instance:node_cpu_utilisation:rate5m
expr: 100 * (1 - avg by (instance, job) (rate(node_cpu_seconds_total{mode="idle"}[5m])))
EOF
promtool check rules /etc/prometheus/rules/node.yml
curl -s -X POST localhost:9090/-/reload && sleep 35
curl -s 'localhost:9090/api/v1/query?query=instance:node_cpu_utilisation:rate5m' \
| jq -r '.data.result[] | "\(.metric.instance) \(.value[1])"'You should see this (your CPU numbers will differ):
Checking /etc/prometheus/rules/node.yml
SUCCESS: 1 rules found
graf01:9100 6.833333333333329
app01:9100 2.1666666666666714The avg by (instance, job) keeps the labels a dashboard filters on. In your copy of the dashboard you can now replace the CPU Busy query with instance:node_cpu_utilisation:rate5m{instance="$node", job="$job"}. On two servers you won’t feel a difference; on two hundred, with a TV screen refreshing all day, you will.
✅ Checkpoint: promtool reports 1 rule found and the recorded series returns one value per server.
8Build the Grafana health dashboard
Create a dashboard called Grafana health in SaatVedha Lab with the Prometheus data source and these panels:
| Panel | Visualisation | Query |
|---|---|---|
| Version | Stat (Text mode Name, legend {{version}}) | grafana_build_info{job=”grafana”} |
| Requests per second by status | Time series, legend {{status_code}} | sum by (status_code) (rate(grafana_http_request_duration_seconds_count{job=”grafana”}[$__rate_interval])) |
| p95 response time | Time series, unit seconds | histogram_quantile(0.95, sum by (le) (rate(grafana_http_request_duration_seconds_bucket{job=”grafana”}[$__rate_interval]))) |
| Dashboards | Stat | grafana_stat_totals_dashboard{job=”grafana”} |
| Memory | Time series, unit bytes (IEC) | process_resident_memory_bytes{job=”grafana”} |
| Scrape OK | Stat, value mappings 1 = UP green, 0 = DOWN red | up{job=”grafana”} |
Open a few dashboards in another tab and watch the request rate move. A climbing p95 with few requests usually means a slow data source, and a jump in 5xx status codes points at a plugin, the database or the proxy.
✅ Checkpoint: Grafana health shows the version 13.3.x, a request rate, p95 latency, dashboard count, memory and Scrape OK = UP.
9Look at the JSON model and UID
In Grafana health click Edit > Settings > JSON Model and scroll to the bottom: you’ll see "title", "uid" and "version". The same JSON is available from the API:
Run this on graf01:
curl -s -u admin:Lab@Grafana2026 localhost:3000/api/dashboards/uid/rYdddlPWk \
| jq '{title: .dashboard.title, uid: .dashboard.uid, version: .dashboard.version, folder: .meta.folderTitle, panels: (.dashboard.panels | length)}'You should see:
{
"title": "Node Exporter Full",
"uid": "rYdddlPWk",
"version": 1,
"folder": "SaatVedha Lab",
"panels": 28
}The UID appears in the URL (/d/rYdddlPWk/...), in links between dashboards and in API calls, so pick meaningful UIDs for your own dashboards (for example grafana-health) and never change them once people bookmark them. The panel count is top-level panels and rows; collapsed rows hold more inside.
✅ Checkpoint: The API returns the title, UID rYdddlPWk, folder SaatVedha Lab and a panel count for Node Exporter Full.
10Snapshot graf01
Run this on your laptop:
VBoxManage snapshot graf01 take node-dashboardsYou should see this (your UUID will differ):
0%...10%...20%...30%...40%...50%...60%...70%...80%...90%...100%
Snapshot taken. UUID: 7f2c4e81-0b9d-4a63-b5e7-29c8d1f4a036✅ Checkpoint: graf01 has a snapshot called node-dashboards.
Break It, Then Fix It
These three account for most “the imported dashboard doesn’t work” tickets. Nothing here damages the lab.
1Datasource ${DS_PROMETHEUS} was not found
A colleague exports Grafana health “for another instance” and pushes it to a second Grafana with a script. Do the same against your own Grafana. In Grafana health click Export > Export as code, turn on Share dashboard with another instance (older versions call it “Export for sharing externally”), download the file and copy it to graf01 as ~/grafana-health-ext.json.
Then:
Run this on graf01:
grep -m2 -o '"uid": "\${DS_PROMETHEUS}"' ~/grafana-health-ext.json
jq '{dashboard: (del(.__inputs, .__requires, .__elements) | .uid = null | .title = "Grafana health (API copy)"), overwrite: false}' \
~/grafana-health-ext.json > ~/body.json
curl -s -u admin:Lab@Grafana2026 -H 'Content-Type: application/json' \
-X POST localhost:3000/api/dashboards/db -d @$HOME/body.json | jq -c '{status, uid, url}'You’ll get this, and then the error in the browser:
"uid": "${DS_PROMETHEUS}"
{"status":"success","uid":"b7c1e0f2-5d3a-4c8e-9a61-0f2e4d6c8b13","url":"/d/b7c1e0f2-5d3a-4c8e-9a61-0f2e4d6c8b13/grafana-health-api-copy"}
(on every panel) Datasource ${DS_PROMETHEUS} was not foundThe external export swapped the real data source UID for a placeholder and listed it in __inputs. The Import page would have asked you which Prometheus to use, but the API stores the JSON as it is, so each panel looks for a data source literally named ${DS_PROMETHEUS}. File provisioning (Lesson 13) has the same behaviour.
Fix: put the real UID in before pushing:
DSUID=$(curl -s -u admin:Lab@Grafana2026 localhost:3000/api/datasources/name/Prometheus | jq -r .uid)
echo "Prometheus UID is $DSUID"
sed "s/\${DS_PROMETHEUS}/$DSUID/g" ~/body.json | jq '.overwrite = true | .dashboard.uid = "grafana-health-copy"' > ~/body-fixed.json
curl -s -u admin:Lab@Grafana2026 -H 'Content-Type: application/json' \
-X POST localhost:3000/api/dashboards/db -d @$HOME/body-fixed.json | jq -c '{status, uid}'Prometheus UID is de4kq7x1z0dmof
{"status":"success","uid":"grafana-health-copy"}Your UID will differ. For dashboards that move between Grafana servers, a data source variable (like ds_prometheus in Node Exporter Full or ds from Lesson 5) avoids the problem completely. Delete the broken “API copy” from the dashboard list afterwards.
✅ Checkpoint: Grafana health copy (UID grafana-health-copy) shows data on every panel, and the broken API copy is deleted.
2Panels empty because the job label differs
Team B sends you their “Linux load” dashboard. Go to Dashboards > New > Import, paste this JSON into the text box, click Load, pick folder SaatVedha Lab and Import:
Paste this JSON:
{
"title": "Linux load (Team B)",
"uid": "teamb-linux-load",
"schemaVersion": 41,
"time": { "from": "now-1h", "to": "now" },
"panels": [
{
"type": "timeseries",
"title": "Load 1m",
"gridPos": { "x": 0, "y": 0, "w": 12, "h": 8 },
"targets": [ { "refId": "A", "expr": "node_load1{job=\"node_exporter\"}", "legendFormat": "{{instance}}" } ]
}
]
}You’ll see this on the panel:
No dataNo error, no red triangle, only an empty panel. Team B’s Prometheus names the job node_exporter; yours is node. A label matcher that matches nothing returns an empty result, which Grafana shows as No data.
Check what exists in Explore:
count by (job) (node_load1){job="node"} 2Fix: edit the panel query to use the real job, or better a variable:
node_load1{job="node"}
# or add a query variable job = label_values(node_load1, job) and use:
node_load1{job=~"$job"}Hard-coded labels are the most common reason shared dashboards look dead. Renaming your Prometheus job to match someone else’s dashboard is the wrong way round, because it breaks your own dashboards and alert rules.
✅ Checkpoint: Linux load (Team B) shows one line per server after the job matcher is fixed and saved.
3Two dashboards, one UID
Team B sends an “updated” version with the same UID. Import the same JSON again, but change the title in it to Linux load (Team B) v2 before clicking Load.
You’ll get this on the import form:
Dashboard named 'Linux load (Team B)' in folder 'SaatVedha Lab' has the same UID
[ Import (Overwrite) ]The UID must be unique in an organisation. The button turns into Import (Overwrite), and clicking it replaces your fixed dashboard from step 2 with Team B’s broken one, which is how people lose work. At work the dangerous version is a teammate re-importing a community dashboard over a copy someone had customised without changing the UID.
Fix: give the import its own UID
In the import form click Change uid, type teamb-linux-load-v2 and the button goes back to plain Import. If you did overwrite by mistake, open the dashboard’s Settings > Versions, pick the version before the import and click Restore, as you did in Lesson 4.
✅ Checkpoint: Both Team B dashboards exist with different UIDs, and your fixed version still uses job=”node”.
This happened at work
The plant manager’s missing panels
A colleague of mine ran monitoring for the ERP team of a manufacturing group near Coimbatore. The plant manager loved one dashboard: Node Exporter Full, imported a year earlier, with four extra panels someone had added at the top for the ERP database servers, which he checked every morning at 7 during the shift change.
One Monday he called to say the panels had gone. The weekend on-call engineer had seen a newer revision of 1860 on grafana.com, imported it by ID, and clicked Import (Overwrite) when Grafana warned about the UID. The first thing my colleague tried was the browser cache and another user’s login, which only wasted twenty minutes.
Then he opened Settings > Versions and saw the new version 1 sitting on top of 34 earlier versions.
The restore button brought the old dashboard back in a minute. The team then wrote three rules on the wiki: community dashboards are imported untouched into a “Vendor” folder, anything customised is a Save as copy with a team UID like erp-node-overview, and the Overwrite button needs a second person to look at the screen first.
Common mistakes and troubleshooting
| Mistake | What happens | What to do instead |
|---|---|---|
| Editing the imported community dashboard directly | The next import with Overwrite wipes your changes | Keep the original untouched and work in a Save as copy with its own UID |
| Pushing an “external” export through the API or provisioning | Every panel shows Datasource ${DS_PROMETHEUS} was not found | Import through the UI, replace the placeholder with the real UID, or use a data source variable |
| Hard-coding job or instance values in shared dashboards | Panels show No data on any Prometheus with different job names | Use variables built with label_values() and =~”$job” |
| Clicking Import (Overwrite) without reading the warning | Another dashboard with that UID is replaced | Change the UID in the import form, or restore from Versions if it already happened |
| Leaving Grafana /metrics open through the reverse proxy | Anyone on the network can read internal stats and versions | Deny /metrics in Nginx or set basic auth under [metrics] |
| Putting heavy rate() expressions on a TV dashboard for hundreds of servers | Prometheus CPU climbs and panels time out | Record the expression with a recording rule and query the recorded series |
Interview questions
Click a question to open it. Each one is written the way an interviewer would ask it. Under it you will see why they ask it and one way you could answer, in your own words.
Fresher level
1. How would you get a full Linux server dashboard into Grafana quickly without building it by hand?
Why they ask this: A practical question to see if you know the import workflow.
How you might answer: I’d import Node Exporter Full, ID 1860, from Dashboards > New > Import, choose the folder and keep it as is. It needs node_exporter scraped by Prometheus, and its variables are built from node_uname_info, so it works with whatever job name we use.
Then I’d make a Save as copy for any changes, so a future import of a newer revision doesn’t overwrite our version.
2. What is a dashboard UID and why does it matter?
Why they ask this: They check that you understand how Grafana identifies dashboards.
How you might answer: The UID is the stable identifier of a dashboard inside an organisation; it’s in the URL, in links and in API calls like /api/dashboards/uid/ plus the UID. Two dashboards can’t share it, so importing a JSON with an existing UID asks to overwrite.
I set readable UIDs for our own dashboards and never change them after people bookmark them.
2–5 years experience
3. An imported dashboard shows “Datasource ${DS_PROMETHEUS} was not found” on every panel. What happened and how do you fix it?
Why they ask this: They want the cause, not only the click that makes it go away.
How you might answer: The JSON was exported for sharing with another instance, so the data source UID became a placeholder listed in __inputs. It was then loaded through the API or provisioning, which don’t ask you to map inputs.
I’d either re-import it through the UI and pick Prometheus, or replace the placeholder with the real UID from /api/datasources/name/Prometheus before pushing. Long term I prefer a data source variable in shared dashboards.
4. How do you monitor Grafana itself?
Why they ask this: They want to see that you treat the monitoring stack as a service too.
How you might answer: Grafana exposes Prometheus metrics on /metrics by default, so I add a grafana scrape job and build a small dashboard: up, grafana_build_info for the version, request rate and p95 from grafana_http_request_duration_seconds, and process memory.
I also make sure /metrics isn’t exposed through the public proxy, by denying it in Nginx or using the basic auth settings under [metrics].
Senior level
5. A 200-server NOC wall runs Node Exporter Full for every server and Prometheus CPU is high. What would you change?
Why they ask this: They are checking whether you can tune dashboards and queries at scale.
How you might answer: First I’d look at which panels are expensive, usually rate() over node_cpu_seconds_total and per-disk series, and at refresh rates; a wall rarely needs 5 second refresh. Then I’d build a lighter overview dashboard for the wall and keep 1860 for drill-down.
The heavy expressions go into recording rules like instance:node_cpu_utilisation:rate5m, evaluated once every 30 seconds, and the wall panels query those series. That turns hundreds of repeated raw queries into reads of one series per server.
6. How would you manage community and team dashboards across several Grafana servers?
Why they ask this: They want process and governance, not clicks.
How you might answer: I’d keep dashboards as JSON in Git with fixed UIDs, using data source variables instead of hard-coded UIDs, and deploy them with provisioning or the API from a pipeline. Community dashboards go into a vendor folder untouched, and our changes live in copies with our own UIDs.
Before pushing, a check fails the build if a JSON still contains ${DS_ placeholders or hard-coded job values, which catches the two most common import failures.
Quick quiz
Q1. What is the grafana.com ID of Node Exporter Full?
- 1860
- 3662
- 7362
- 12486
Show answer
A — Node Exporter Full is dashboard 1860.
Q2. Which metric does Node Exporter Full use to build its job, nodename and node drop-downs?
- up
- node_uname_info
- node_load1
- node_exporter_build_info
Show answer
B — All three variables are label_values() queries on node_uname_info.
Q3. A panel query uses job=”node_exporter” but your Prometheus job is “node”. What does the panel show?
- An error about the job
- No data
- Data from all jobs
- Data from the first job
Show answer
B — A matcher that matches nothing returns an empty result, shown as No data.
Q4. What does the Import (Overwrite) button mean?
- A dashboard with the same UID or title exists and will be replaced
- The JSON is invalid
- The data source will be overwritten
- Grafana will create a copy
Show answer
A — The UID (or title in that folder) already exists, and importing will replace that dashboard.
Q5. Where does Grafana expose its own Prometheus metrics by default?
- /api/metrics on port 9090
- /metrics on Grafana’s HTTP port
- /debug/vars
- Only through an exporter plugin
Show answer
B — With [metrics] enabled = true (default), Grafana serves /metrics on its own port, 3000 here.
Quick recap
- Node Exporter Full (1860) builds its job, nodename and node variables from node_uname_info, so it fits any job name.
- Keep imported community dashboards untouched and customise a Save as copy with its own UID.
- Prometheus now scrapes Grafana on localhost:3000 as job grafana, and Nginx denies /metrics from outside.
- Recording rules such as instance:node_cpu_utilisation:rate5m make heavy panels cheap on big walls.
- ${DS_PROMETHEUS} placeholders, hard-coded job labels and duplicate UIDs cause most broken imports.
Next lesson
Lesson 10: InfluxDB and Telegraf in Grafana, including SNMP → You install InfluxDB 3 Core on graf01, send Linux and SNMP interface metrics from Telegraf on app01 and graph them in Grafana with SQL.
Further reading: Grafana Node Exporter dashboard
Want to go deeper into Grafana Node Exporter dashboard? The Node Exporter Full page and its source on GitHub, Grafana’s guide to importing dashboards, monitoring Grafana with Prometheus and the Prometheus page on recording rules cover this lesson in depth. The Prometheus course goes further with Node Exporter and recording rules.
You can also see the full plan for this course on the Grafana Dashboards and Observability course page.
