Your first Grafana dashboard: data sources and panels

In this lesson you create a Grafana dashboard from real data. First you give Grafana something to read: Prometheus on graf01 scraping node_exporter on both VMs. Then you add Prometheus as a data source and build a “Server Overview” dashboard with the five panel types you’ll use most (time series, stat, gauge, bar gauge and table), with proper units, thresholds, a legend, an override and a row.

You also learn the boring parts that save you at work: where dashboard settings live, how saving and version history work, how to restore a version someone broke, and how to export the dashboard as JSON.

Where this lesson fits

Lesson 4 of 14 in Grafana Dashboards and Observability · Phase 1: Grafana setup and your first dashboards · Before this: Lesson 3, Grafana behind Nginx with HTTPS · Next: Lesson 5, dashboard variables

TimeYou needBy the end you can
About 90 minutesgraf01 with the https snapshot from Lesson 3, app01 from Lesson 1, https://graf01.lab/ working in your browserBuild, save, version, restore and export a five-panel Grafana dashboard fed by Prometheus

What it is, in one line

A Grafana dashboard is a saved page of panels, where each panel runs a query against a data source and draws the answer with its own visualisation, units and thresholds.

In Simple Words

The display board at Mumbai Central

Look up at the departure board at a big railway station. One section lists trains and platforms like a table, a clock shows the time, and a small sign turns red when a train is late. Each piece reads from the same railway control system but shows it in the way that suits that piece of information.

A Grafana dashboard is that board: Prometheus is the control system, and each panel picks the shape (graph, big number, dial or table) that makes its number easy to read from across the room.

Engineer's View

What a dashboard is made of

A dashboard is one JSON document saved in Grafana’s database with a unique UID, a title, a folder, a time range, a refresh interval, optional variables and a list of panels. Since Grafana 13 the editor uses dynamic dashboards: a sidebar edit pane, rows and tabs for grouping, and a choice of Custom or Auto grid layout. Old dashboards are converted automatically when you open them.

Panel typeBest forExample in this lesson
Time seriesHow a value moves over time, many series on one graphCPU busy % per server
StatOne big number, with colour and an optional sparklineMemory available %
GaugeA value against a known maximumRoot disk used %
Bar gaugeComparing one value across several itemsLoad average per server
TableLists with several columns, current stateWhich targets are up

Every panel has three layers: queries (what to ask the data source), transformations (optional reshaping in Grafana) and field options (unit, decimals, min and max, thresholds, colour, legend). Overrides change field options for one series or column only, for example making the graf01 line dashed.

How it works, step by step

1Exporters publish numbers, Prometheus stores them

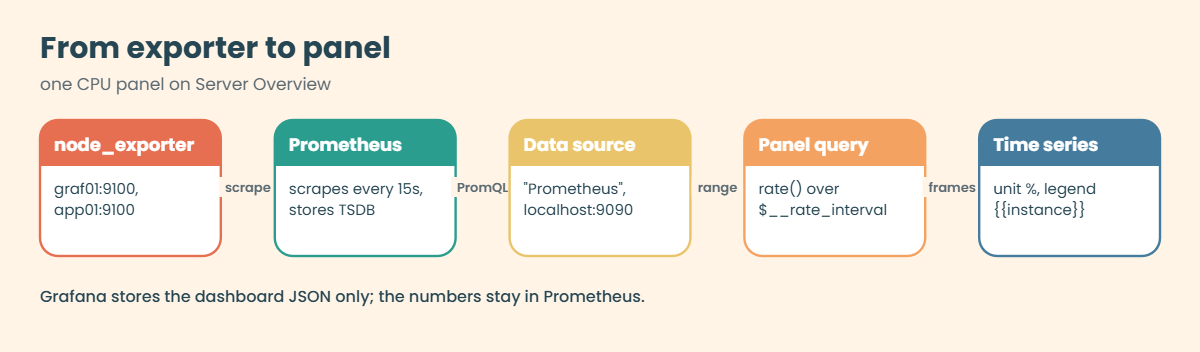
node_exporter on graf01 and app01 answers /metrics on port 9100. Prometheus on graf01 scrapes both every 15 seconds and keeps the samples in its database under /var/lib/prometheus. Grafana stores none of this.

The diagram below follows one panel’s data from the exporter to your screen.

2The data source tells Grafana where Prometheus is

The “Prometheus” data source holds the URL http://localhost:9090 and a scrape interval of 15s. “localhost” is correct because the Grafana server, not your browser, sends the query, and both run on graf01.

Create Grafana dashboard: data path from node_exporter through Prometheus and the data source to a panel

3Each panel sends PromQL over the selected time range

When the dashboard loads, Grafana sends every panel’s query to Prometheus as a range query with a start, an end and a step it works out from the panel width and time range. Prometheus returns series, Grafana turns them into data frames, and the visualisation draws them.

4Field options turn numbers into meaning

A raw value like 5377802240 means nothing until the unit “bytes(IEC)” shows it as 5.01 GiB, and a threshold at 85 turns a gauge red. Overrides and legends finish the job. The second diagram shows the layers a value passes through inside one panel.

Create Grafana dashboard panels: query, data frame, transformations, field options, overrides and visualisation

5Save, version, restore, export

Each save writes a new version of the JSON with your optional note. Grafana keeps 20 versions by default ([dashboards] versions_to_keep in grafana.ini), and you can compare two versions or restore an old one, which itself becomes a new version. Export as code gives you the JSON to keep in Git or import on another Grafana.

SettingWhereWhat it changes
Time range and refreshTop toolbar (time picker, refresh picker)Which period every panel shows and how often it reloads
Title, folder, tagsDashboard options (sidebar) > View all settings > GeneralHow people find the dashboard and who can see it through folder permissions
LayoutDashboard options > Layout: Custom or AutoFree drag-and-drop grid, or panels resized into an even grid
VersionsDashboard options > View all settings > VersionsList, compare and restore saved versions
JSON ModelEdit as code in the toolbar, or settings > JSON ModelThe full document, including the UID

Hands-on lab: Prometheus data source and a five-panel Server Overview dashboard

Before you run any command, double-check it

Read every command twice before you press Enter. Check the target: the server name, the user, the disk or device name, the path and the sizes. These commands are for learning and were tested in our lab, not on your system. At work, run the read-only commands first, follow your change process, make sure a backup exists, and ask a second person to check anything that changes or deletes data. You run them at your own risk.

You install Prometheus and node_exporter the short way here, because the SaatVedha Prometheus course explains every flag in detail. Then everything else happens in Grafana at https://graf01.lab/. Commands run on graf01 unless a step says app01.

1Install node_exporter on graf01 and app01

Paste this whole block on graf01, then again on app01:

VER=1.12.1
cd /tmp && wget -q https://github.com/prometheus/node_exporter/releases/download/v$VER/node_exporter-$VER.linux-amd64.tar.gz
tar xzf node_exporter-$VER.linux-amd64.tar.gz
sudo install -o root -g root -m 0755 node_exporter-$VER.linux-amd64/node_exporter /usr/local/bin/
sudo useradd --system --no-create-home --shell /usr/sbin/nologin node_exporter
sudo tee /etc/systemd/system/node_exporter.service >/dev/null <<'EOF'
[Unit]
Description=Prometheus Node Exporter
Wants=network-online.target
After=network-online.target

[Service]
User=node_exporter
Group=node_exporter
ExecStart=/usr/local/bin/node_exporter
Restart=on-failure

[Install]
WantedBy=multi-user.target
EOF
sudo systemctl daemon-reload && sudo systemctl enable --now node_exporter
curl -s localhost:9100/metrics | grep -E '^node_(load1|memory_MemAvailable_bytes) '

You should see (your values will differ):

Created symlink '/etc/systemd/system/multi-user.target.wants/node_exporter.service' → '/etc/systemd/system/node_exporter.service'.
node_load1 0.2
node_memory_MemAvailable_bytes 2.348716544e+09

Ubuntu 24.04 prints the symlink paths without the quotes. The values differ on every machine. On app01 the memory number is smaller, because app01 has 1.5 GB of RAM against graf01’s 3 GB.

✅ Checkpoint: curl localhost:9100/metrics returns node_load1 on both graf01 and app01.

2Let graf01 reach app01 on port 9100

Run this on app01:

sudo ufw allow OpenSSH
sudo ufw allow from 192.168.56.70 to any port 9100 proto tcp
sudo ufw --force enable
sudo ufw status | grep 9100

You should see:

9100/tcp                   ALLOW       192.168.56.70

Then run this on graf01:

curl -s -m 5 http://app01:9100/metrics | grep '^node_load1 '
node_load1 0.05

Only graf01 may read app01’s metrics now. graf01 needs no rule for its own 9100, because Prometheus reaches graf01:9100 through the loopback interface, which ufw always allows.

✅ Checkpoint: graf01 can curl app01:9100/metrics and ufw on app01 allows 9100 only from 192.168.56.70.

3Install Prometheus on graf01

Paste this whole block on graf01:

VER=3.16.0
cd /tmp && wget -q https://github.com/prometheus/prometheus/releases/download/v$VER/prometheus-$VER.linux-amd64.tar.gz
tar xzf prometheus-$VER.linux-amd64.tar.gz
sudo install -o root -g root -m 0755 prometheus-$VER.linux-amd64/{prometheus,promtool} /usr/local/bin/
sudo useradd --system --no-create-home --shell /usr/sbin/nologin prometheus
sudo mkdir -p /etc/prometheus /var/lib/prometheus
sudo chown prometheus:prometheus /var/lib/prometheus
sudo tee /etc/prometheus/prometheus.yml >/dev/null <<'EOF'
global:
  scrape_interval: 15s
  evaluation_interval: 15s

scrape_configs:
  - job_name: "prometheus"
    static_configs:
      - targets: ["localhost:9090"]

  - job_name: "node"
    static_configs:
      - targets: ["graf01:9100", "app01:9100"]
EOF
promtool check config /etc/prometheus/prometheus.yml

You should see:

Checking /etc/prometheus/prometheus.yml
 SUCCESS: /etc/prometheus/prometheus.yml is valid prometheus config file syntax

✅ Checkpoint: promtool reports SUCCESS for /etc/prometheus/prometheus.yml.

4Run Prometheus as a service

Paste this whole block on graf01:

sudo tee /etc/systemd/system/prometheus.service >/dev/null <<'EOF'
[Unit]
Description=Prometheus
Wants=network-online.target
After=network-online.target

[Service]
User=prometheus
Group=prometheus
ExecStart=/usr/local/bin/prometheus \
  --config.file=/etc/prometheus/prometheus.yml \
  --storage.tsdb.path=/var/lib/prometheus \
  --storage.tsdb.retention.time=15d \
  --web.enable-lifecycle
ExecReload=/bin/kill -HUP $MAINPID
Restart=on-failure

[Install]
WantedBy=multi-user.target
EOF
sudo systemctl daemon-reload && sudo systemctl enable --now prometheus
sudo ufw allow from 192.168.56.0/24 to any port 9090 proto tcp
sleep 20
curl -s localhost:9090/api/v1/query --data-urlencode 'query=up' | python3 -m json.tool | grep -E '"(instance|job)"|"1"'

You should see (the three targets can come in a different order):

                    "instance": "localhost:9090",
                    "job": "prometheus"
                    "1"
                    "instance": "graf01:9100",
                    "job": "node"
                    "1"
                    "instance": "app01:9100",
                    "job": "node"
                    "1"

All three targets report up = 1. Prometheus listens on port 9090 without Nginx in front, and ufw lets only the lab network reach it, so you can open http://192.168.56.70:9090 from your laptop to check targets under Status > Target health.

✅ Checkpoint: up returns 1 for localhost:9090, graf01:9100 and app01:9100.

5Add Prometheus as a data source in Grafana

In Grafana open Connections > Data sources > Add new data source and pick Prometheus. Set these fields and leave the rest as they are:

FieldValue
NamePrometheus
DefaultOn
Prometheus server URLhttp://localhost:9090
Scrape interval (under Interval behaviour)15s

Click Save & test. A green box saying “Successfully queried the Prometheus API.” means Grafana reached Prometheus and ran a test query.
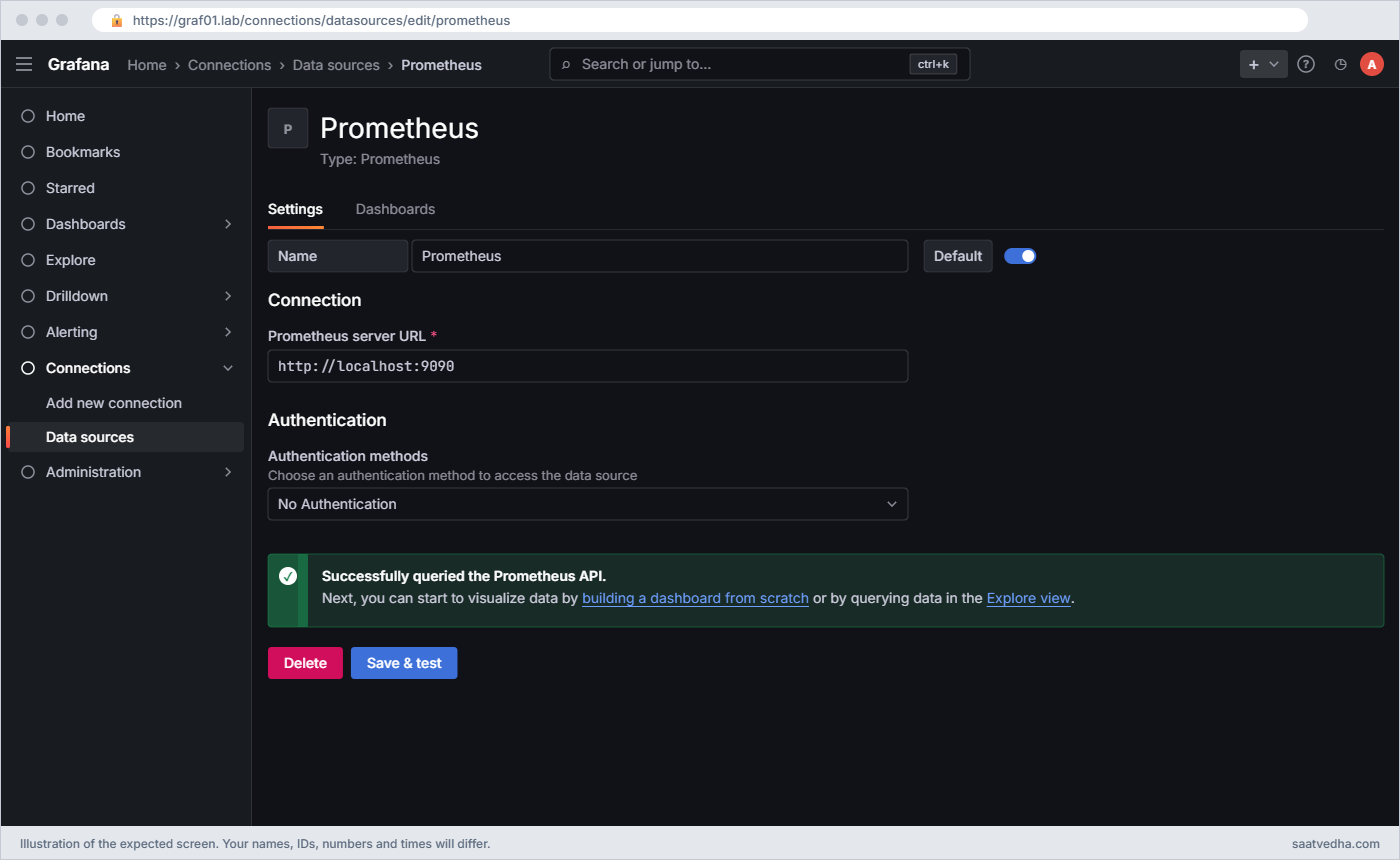
Create Grafana dashboard: Prometheus data source saved and tested on graf01
Save & test on the Prometheus data source: the green box means Grafana reached http://localhost:9090 and ran a test query.

Check from graf01 that Grafana stored it (use your admin password):

curl -s -u admin:'Lab@Grafana2026' --cacert /etc/ssl/graf01/graf01.crt \
  https://graf01.lab/api/datasources/name/Prometheus | python3 -m json.tool | grep -E '"(name|type|url|isDefault)"'

You should see:

    "name": "Prometheus",
    "type": "prometheus",
    "url": "http://localhost:9090",
    "isDefault": true,

Setting the scrape interval to match Prometheus (15s) matters later: Grafana uses it to choose sensible steps and the smallest $__rate_interval, which Lesson 5 explains.

✅ Checkpoint: Save & test shows “Successfully queried the Prometheus API.” and the API lists the data source with isDefault true.

Create Grafana dashboard lab: Prometheus targets up and the Prometheus data source stored in Grafana
All targets up in Prometheus and the Prometheus data source as Grafana stores it.

6Create the folder and the dashboard with a time series panel

Go to Dashboards > New > New folder and call it SaatVedha Lab. Inside it choose New > New dashboard, click the blue Add new element icon, drag a panel onto the page and choose Configure visualization. Select the Prometheus data source, switch the query editor from Builder to Code and paste:

100 * (1 - avg by (instance) (rate(node_cpu_seconds_total{mode="idle"}[$__rate_interval])))

Click Refresh (or press Shift+Enter in the query box). Pick Time series as the visualisation, set the panel title to CPU busy %, and in the options pane set:

OptionValue
Standard options > UnitMisc > Percent (0-100)
Standard options > Min / Max0 / 100
Legend > Mode, PlacementTable, Bottom
Legend > ValuesMean, Max, Last *
Query options > Legend (in the query row)Custom: {{instance}}

You get two lines, graf01:9100 and app01:9100, with a legend table under the graph. Click Save, title the dashboard Server Overview, check the folder is SaatVedha Lab, add the note “first panel” and save. Then click Back to dashboard.

Create Grafana dashboard: panel editor with the CPU busy % time series, PromQL query and legend table
Editing the CPU busy % panel: the PromQL query with {{instance}} as legend, Percent (0-100) from 0 to 100, and the legend as a table with Mean, Max and Last *.

To see the numbers Grafana is drawing, run the same query at Prometheus directly:

Run this on graf01:

curl -s localhost:9090/api/v1/query --data-urlencode \
  'query=100 * (1 - avg by (instance) (rate(node_cpu_seconds_total{mode="idle"}[5m])))'; echo

You should see (your numbers and timestamps will differ):

{"status":"success","data":{"resultType":"vector","result":[{"metric":{"instance":"graf01:9100"},"value":[1794119005.116,"3.71"]},{"metric":{"instance":"app01:9100"},"value":[1794119005.116,"1.28"]}]}}

✅ Checkpoint: Server Overview is saved in folder SaatVedha Lab with a CPU busy % panel showing two series in percent.

7Add stat, gauge, bar gauge and table panels

In edit mode add four more panels the same way. For each, paste the query, pick the visualisation and set the options in the table. Leave the query Type on Range unless the table says Instant.

TitleVisualisationQueryOptions
Memory available %Stat100 * node_memory_MemAvailable_bytes / node_memory_MemTotal_bytesUnit Percent (0-100), Decimals 1, Thresholds: base red, 15 orange, 30 green; Color mode Background
Root disk used %Gauge100 * (1 – node_filesystem_avail_bytes{mountpoint=”/”} / node_filesystem_size_bytes{mountpoint=”/”})Unit Percent (0-100), Min 0, Max 100, Thresholds: base green, 70 orange, 85 red
Load (1m) per serverBar gaugenode_load1Legend {{instance}}, Orientation Horizontal, Display mode Gradient, Thresholds: base green, 1 orange, 2 red
TargetsTableupType Instant, Format Table; Transformations > Organize fields by name: hide Time and __name__, rename Value to Up

Drag and resize so the four new panels sit in one line under the CPU graph. The stat panel shows one tile per server, red if less than 15% memory is free, and the gauge turns orange at 70% disk used. In the Targets table you see three rows with columns instance, job and Up.

Check the memory query from graf01 if a panel looks odd:

curl -s localhost:9090/api/v1/query --data-urlencode \
  'query=100 * node_memory_MemAvailable_bytes / node_memory_MemTotal_bytes'; echo
{"status":"success","data":{"resultType":"vector","result":[{"metric":{"instance":"graf01:9100","job":"node"},"value":[1794119023.061,"63.77"]},{"metric":{"instance":"app01:9100","job":"node"},"value":[1794119023.061,"58.92"]}]}}

✅ Checkpoint: The dashboard shows five panels: CPU time series, memory stat, disk gauge, load bar gauge and targets table, all with sensible units.

8Add an override and a row

Edit the CPU busy % panel and open Overrides > Add field override > Fields with name, pick graf01:9100, then Add override property > Graph styles > Line style and choose Dashes. Now the monitoring server’s own line is dashed, so nobody mistakes it for the application server.

Back on the dashboard, click Add new element > Add row/Group into rows. Your panels move into the new row; name it Linux hosts. Rows can be collapsed, which also stops their panels from querying until someone opens them, a simple way to keep big dashboards fast.

Open Dashboard options > View all settings and on the General page set Time zone to Browser Time, add the tag linux and set the default refresh to 30s. Save with the note “override and row”.

✅ Checkpoint: The graf01 CPU line is dashed, the panels sit in a collapsible row called Linux hosts, and the dashboard has the linux tag.

9Look at the version history

Click Edit > Dashboard options > View all settings > Versions. You should see at least two versions. The newest carries your note “override and row”, and the oldest is labelled “Initial save”, because Grafana always names a dashboard’s first version that way, whatever note you typed.

Tick both and click Compare versions: Grafana lists the changes in plain words, and View JSON diff shows the raw JSON lines added and removed.

You can also read them through the API. The dashboard’s UID is the short code in its URL after /d/, for example https://graf01.lab/d/fe3k9q2xw1ts0d/server-overview; copy yours into the first line.

Run this on graf01:

DUID=fe3k9q2xw1ts0d
curl -s -u admin:'Lab@Grafana2026' --cacert /etc/ssl/graf01/graf01.crt \
  "https://graf01.lab/api/dashboards/uid/$DUID/versions" | grep -oE '"version":[0-9]+,"created":"[^"]*","message":"[^"]*"'

You should see (your times will differ):

"version":2,"created":"2026-11-08T07:40:12Z","message":"override and row"
"version":1,"created":"2026-11-08T07:31:05Z","message":"Initial save"

The answer is one long line of JSON with a versions list, and each entry also carries the full dashboard JSON of that version, so grep -o cuts out the three fields you care about. The UID is the dashboard’s permanent ID, and yours is a different random string.

✅ Checkpoint: Versions lists at least two saves with your notes, and you can compare them.

10Export the dashboard as JSON

Exit edit mode, click Export > Export as code in the toolbar, leave the model on Classic and click Download file. Turn on Share dashboard with another instance first if the file is going to a different Grafana: it replaces your data source with an input you choose at import time.

Copy the file to graf01 and peek inside (on your laptop):

scp ~/Downloads/Server\ Overview-*.json student@192.168.56.70:server-overview.json
ssh student@192.168.56.70 "python3 -c 'import json; d=json.load(open(\"server-overview.json\")); print(d[\"title\"], d[\"uid\"])'"

You should see (with your own UID):

Server Overview fe3k9q2xw1ts0d

The file name your browser gives the download may differ; adjust the scp line to match. Inside, the classic model stores your row as a panel of type row next to the five panels, along with the time range, refresh and tags. Keep this file: Lesson 13 puts dashboards like it under version control and provisions them automatically.

✅ Checkpoint: You have server-overview.json on graf01 with the title Server Overview and the same UID as the dashboard.

Break It, Then Fix It

Three things that waste hours for new Grafana users. Make sure the dashboard is saved first so you have a version to go back to.

1“No data” from a wrong label and a wrong time range

Edit the bar gauge and change the query to use a job name that doesn’t exist:

node_load1{job="nodes"}

You’ll get this in the panel:

No data

Prometheus returned an empty result, which isn’t an error, so Grafana shows “No data” instead of a red message. Check the query directly and you see the empty list:

Run this on graf01:

curl -s localhost:9090/api/v1/query --data-urlencode 'query=node_load1{job="nodes"}'; echo
curl -s localhost:9090/api/v1/label/job/values; echo
{"status":"success","data":{"resultType":"vector","result":[]}}
{"status":"success","data":["node","prometheus"]}

The label values API shows the real job names, and “nodes” isn’t among them. Put the query back to node_load1. Then try the second cause: set the dashboard time picker to an absolute range last month, before Prometheus existed, and every panel says “No data” for the same reason, nothing was stored then.

Fix:

node_load1          # query back to the original
Last 1 hour         # time picker back to a relative range

✅ Checkpoint: The bar gauge shows both servers again and the time picker says Last 1 hour.

2The wrong unit makes memory look 1024 times bigger

Add a quick stat panel with node_memory_MemAvailable_bytes and set its unit to Data > kibibytes, as someone might if they think node_exporter reports kB like /proc/meminfo does.

With the memory values from this lab, the panel shows:

graf01:9100   2.19 TiB
app01:9100    896 GiB

A 3 GB VM can’t have 2 TiB free. node_exporter converts everything to base units, so this metric is already in bytes, and telling Grafana it’s kibibytes multiplies the display by 1024. The same trap with Percent (0.0-1.0) on a 0 to 100 value shows 6377% instead of 63.77%.

Fix: set the unit that matches the metric name:

Standard options > Unit > Data > bytes(IEC)     -> 2.19 GiB
(the _bytes suffix in a Prometheus metric name always means bytes)

✅ Checkpoint: The panel shows about 2 GiB for graf01 and under 1 GiB for app01, matching free -h on each VM.

3Someone broke the dashboard: restore a version

Delete the Targets table and the gauge, change the CPU panel to a bar chart and save with the note “oops”. Now pretend a colleague did it at 2 am and you only notice in the morning.

You’ll see this on the dashboard:

Server Overview: 3 panels, CPU shown as bars, no gauge, no Targets table
Versions tab: 3  oops / 2  override and row / 1  Initial save

Click Edit > Dashboard options > View all settings > Versions, find version 2 (“override and row”) and click Restore. Grafana saves straight away and exits edit mode, and the restore becomes a new version 4 with a note saying which version it came from, so even the restore is traceable.

Check from graf01 (set DUID again as in lab step 9 if you opened a new session):

curl -s -u admin:'Lab@Grafana2026' --cacert /etc/ssl/graf01/graf01.crt \
  "https://graf01.lab/api/dashboards/uid/$DUID/versions" | grep -oE '"version":[0-9]+,"created":"[^"]*","message":"[^"]*"' | head -2
"version":4,"created":"2026-11-08T08:05:47Z","message":"Restored from version 2"
"version":3,"created":"2026-11-08T08:02:10Z","message":"oops"

Deleted a whole dashboard instead? Grafana 13 has Dashboards > Recently deleted, where you can restore it.

✅ Checkpoint: All five panels are back, CPU is a time series again, and Versions shows a restore entry on top.

This happened at work

The sales dashboard that showed terabytes of free memory

This one comes from my own team at a retail chain’s head office in Mumbai, during the run-up to an end-of-season sale. A new store-server dashboard went up on the big screen, and within an hour the regional IT lead called to ask why every store server showed between 2 and 6 TiB of free memory when they had 8 GB each.

The person who built it was sure Prometheus was broken, and spent the afternoon restarting node_exporter on two stores and comparing /proc/meminfo by hand. The numbers in meminfo were in kB, so the raw values looked “too big” to him and he’d set the panel unit to kibibytes to match what he knew.

In the evening I opened the query inspector, saw the metric name ending in _bytes and the raw value of about 5.3 billion, and changed the unit to bytes(IEC). Every panel dropped to a sensible 3 to 6 GiB in one click. Nobody had lost any data; the screen had been lying about a correct number.

We added two habits after that. Every new dashboard gets a second pair of eyes before it goes on the wall screen, and the reviewer checks units against the metric name suffix (_bytes, _seconds, _total). We also started writing a one-line panel description with the unit and source metric, which shows as an “i” icon on the panel.

Common mistakes and troubleshooting

MistakeWhat happensWhat to do instead
Picking the unit by guessValues look 1000 or 1024 times too big or smallMatch the unit to the metric suffix: _bytes is bytes, _seconds is seconds, ratios 0 to 1 use Percent (0.0-1.0)
Using rate() with a fixed tiny range like [15s]Gaps and “No data” when the range holds fewer than two samplesUse [$__rate_interval] and set the data source scrape interval to 15s
Thresholds without Min and Max on a gaugeThe gauge needle sits in the wrong place and colours look randomSet Min 0 and Max 100 for percentages
Saving without a noteVersions list is a wall of numbers when you need to restoreWrite a short note on every save: what and why
Building straight on the wall-screen dashboardA half-finished change appears in front of everyoneUse Save as to work on a copy, then replace the original
Leaving every panel open on a huge dashboardSlow load and heavy load on PrometheusGroup panels in rows and keep rarely used rows collapsed
Exporting with instance details for another GrafanaImport fails to find your data source UIDTurn on Share dashboard with another instance when exporting

Interview questions

Click a question to open it. Each one is written the way an interviewer would ask it. Under it you will see why they ask it and one way you could answer, in your own words.

Fresher level

1. What’s the difference between a stat panel, a gauge and a time series in Grafana?

Why they ask this: They want to see that you choose a visualisation for a reason.

How you might answer: A time series shows how values change over the selected time range, so I use it for CPU or traffic trends. A stat shows one current number per series, with colour from thresholds and an optional sparkline.

A gauge shows a value against a known minimum and maximum, like disk used out of 100%, so it only makes sense when there is a real maximum.

2. A panel shows “No data”. What are the first three things you check?

Why they ask this: A check for a calm, ordered approach.

How you might answer: First the time range, because a range before the data existed or a fixed old range shows nothing. Second, the query in Explore or the query inspector, and the same query run at Prometheus; often a label like job is spelled differently, which I confirm with the label values API.

Third, the data source with Save & test, to make sure Grafana can reach Prometheus at all.

2–5 years experience

3. Walk me through how you would build a CPU panel for many Linux servers that stays correct when scrape intervals change.

Why they ask this: They want PromQL and Grafana settings that work together.

How you might answer: I use 100 * (1 – avg by (instance) (rate(node_cpu_seconds_total{mode=”idle”}[$__rate_interval]))) with unit Percent (0-100) and min 0, max 100. $__rate_interval adapts to the panel step and is never shorter than four times the scrape interval set on the data source, so rate always has enough samples.

I set the legend to {{instance}} in table mode with mean, max and last, and add thresholds or an override for special hosts.

4. Someone changed a shared dashboard and broke it. How do you find what changed and recover?

Why they ask this: They are checking you know version history and its limits.

How you might answer: I open the dashboard settings, Versions tab, tick the last good version and the current one and use Compare versions to see the diff, including the JSON diff. Then I click Restore on the good version, which saves it as a new version, so the history stays complete.

If the whole dashboard was deleted, Grafana 13 has Recently deleted under Dashboards. For important dashboards I also keep the JSON in Git so we have a copy outside Grafana.

Senior level

5. How would you design dashboards for a team of 50 engineers so they stay useful and fast?

Why they ask this: They want structure, ownership and performance thinking.

How you might answer: I’d keep a small set of standard dashboards per service in folders with permissions, each with an owner, a description and units checked in review. Top rows show health at a glance (errors, latency, saturation), and detail sits in collapsed rows so it doesn’t query until opened.

Queries use recording rules for heavy expressions, $__rate_interval and sensible default ranges. The JSON lives in Git and is provisioned, so changes go through review instead of edits on the live screen.

6. When would you use the Auto grid layout instead of Custom in Grafana 13?

Why they ask this: They’re checking you know the newer dashboard features and their trade-offs.

How you might answer: Auto grid resizes panels into an even grid that adapts to screen width, which is good for dashboards opened on laptops and phones or for repeated panels of the same kind. It also supports show and hide rules.

Custom gives exact placement and sizes, which I prefer for a wall screen where a big CPU graph should sit beside small stat tiles. I can set the layout per dashboard, row or tab.

Quick quiz

Q1. Which panel type is best for comparing the current load average across several servers?

  1. Time series
  2. Bar gauge
  3. Text
  4. Logs
Show answer

B — A bar gauge shows one bar per series so values are easy to compare.

Q2. node_memory_MemAvailable_bytes shows 5 TiB on a 3 GB VM. What is most likely wrong?

  1. Prometheus is broken
  2. The panel unit is set to kibibytes instead of bytes
  3. The time range is too long
  4. The data source URL is wrong
Show answer

B — The metric is already in bytes; kibibytes multiplies the display by 1024.

Q3. What does restoring an old dashboard version do?

  1. Deletes newer versions
  2. Saves the old content as a new version
  3. Only shows a preview
  4. Restores data in Prometheus
Show answer

B — The restore creates a new version, so history is kept.

Q4. Why is http://localhost:9090 the right URL for the Prometheus data source here?

  1. Because your laptop runs Prometheus
  2. Because the Grafana server on graf01 sends the queries
  3. Because Nginx forwards 9090
  4. It is wrong, it should be https://graf01.lab:9090
Show answer

B — In server access mode the Grafana backend queries the data source.

Q5. Where do you find a dashboard’s versions in Grafana 13?

  1. Explore
  2. Dashboard options > View all settings > Versions
  3. Connections > Data sources
  4. Administration > Plugins
Show answer

B — The Versions tab lists, compares and restores saved versions.

Quick recap

  • Prometheus on graf01 scrapes node_exporter on graf01 and app01 every 15 seconds; Grafana reads it through the “Prometheus” data source at http://localhost:9090.
  • A dashboard is JSON with a UID; each panel has queries, optional transformations and field options such as unit, min, max, thresholds and overrides.
  • Time series, stat, gauge, bar gauge and table cover most needs; pick the unit from the metric name suffix.
  • Every save is a version; compare and restore from the Versions tab, and use Recently deleted for whole dashboards.
  • Export as code gives you the JSON for Git or another Grafana; Server Overview in folder SaatVedha Lab is your base for the next lessons.

Next lesson

Lesson 5: Grafana dashboard variables and repeating panels → You add an $instance variable to Server Overview, chain job and instance, use $__rate_interval properly and repeat panels and rows for every server.

Further reading: create Grafana dashboard

Want to go deeper into create Grafana dashboard? The official docs on creating dashboards, version history and the Prometheus data source go deeper into each option. For the Prometheus side, the SaatVedha lessons on Node Exporter and PromQL examples explain the queries used here, and Linux performance monitoring explains what CPU, load and memory numbers mean.

You can also see the full plan for this course on the Grafana Dashboards and Observability course page.

Scroll to Top

This website uses cookies

We use a few cookies to keep this site working. If you allow it, we also use Google Analytics to count visits so we can improve our lessons. You can accept all, deny the optional ones, or choose what to allow.