Put Grafana behind Nginx with HTTPS
-
Phase 1: Grafana setup and your first dashboards
-
Phase 2: Data sources, logs and metrics
-
Phase 3: Alerting, teams and running Grafana
A Grafana Nginx reverse proxy is how most companies publish Grafana: Nginx answers on HTTPS port 443 with a proper certificate, and Grafana itself listens only on 127.0.0.1:3000 where nobody else can reach it. In this lesson you set that up on graf01 with a self-signed certificate for graf01.lab, make live dashboard updates work through the proxy and fix the three errors people hit most often.
By the end your laptop opens https://graf01.lab/ instead of http://192.168.56.70:3000, the old port is closed by the firewall, and Grafana builds its links and emails with the right address.
Where this lesson fits
Lesson 3 of 14 in Grafana Dashboards and Observability · Phase 1: Grafana setup and your first dashboards · Before this: Lesson 2, install Grafana on Ubuntu · Next: Lesson 4, your first Grafana dashboard
| Time | You need | By the end you can |
|---|---|---|
| About 70 minutes | graf01 from Lesson 2 (snapshot grafana-installed), admin rights on your laptop to edit its hosts file | Run Grafana behind Nginx with HTTPS, explain every proxy header you set, and debug 502, redirect loops and “origin not allowed” |
What it is, in one line
A reverse proxy sits in front of Grafana, accepts the browser’s HTTPS connection, and forwards each request to Grafana on 127.0.0.1:3000 with the original host name and protocol in the headers.
In Simple Words
The hospital reception desk
In a big hospital you don’t walk straight into the doctor’s cabin. You go to the reception desk at the main gate, show your token, and the receptionist sends you to the right floor and tells the doctor who is coming and from where.
The doctor’s cabin door stays closed to the street, and the reception also checks your ID badge so nobody pretends to be someone else. Nginx is that reception desk, the certificate is its ID badge, and Grafana is the doctor who only sees visitors that came through the desk.
Engineer's View
What the proxy does and what Grafana needs to know
Nginx terminates TLS: it holds the certificate and private key, decrypts the browser’s request and sends it to Grafana over plain HTTP on the loopback interface. Grafana never sees the encryption, so it needs headers and its own settings to know what the browser used.
| Piece | Setting | Why it matters |
|---|---|---|
| Host header | proxy_set_header Host $host | Grafana compares the Origin of every POST with the Host it receives; a wrong Host gives “origin not allowed” |
| Forwarded headers | X-Forwarded-For, X-Forwarded-Proto | Logs and auth plugins see the real client IP and know the request came over https |
| WebSocket upgrade | map $http_upgrade, Upgrade and Connection headers on /api/live/ | Grafana Live pushes updates over a WebSocket; without these headers it falls back or fails |
| http_addr | 127.0.0.1 in [server] | Only local programs (Nginx) can reach port 3000 |
| domain and root_url | graf01.lab and https://graf01.lab/ | Grafana builds redirects, links in alert emails and invite URLs from root_url |
| serve_from_sub_path | false here; true for https://host/grafana/ | Only needed when Grafana lives under a path instead of its own host name |
| enforce_domain | false (default) | If true, Grafana redirects any request whose Host differs from domain |
A certificate is only trusted when its Subject Alternative Name (SAN) lists the name in the browser’s address bar. Modern browsers ignore the old Common Name field completely, so a certificate without SAN shows a warning even if CN matches.
How it works, step by step
1The browser resolves graf01.lab and connects to 443
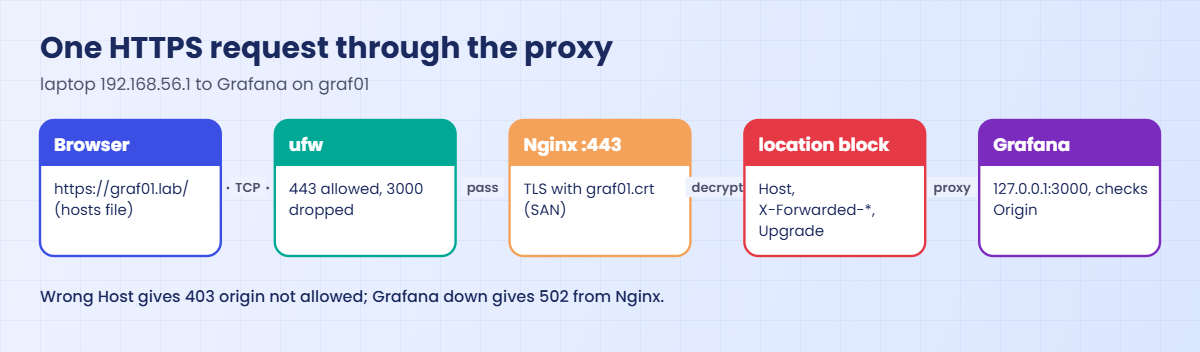
Your laptop’s hosts file maps graf01.lab to 192.168.56.70, so the browser opens TCP 443 on graf01. ufw lets 443 in from the lab network and blocks 3000, so this is the only door.
2Nginx does the TLS handshake and picks a location
Nginx presents graf01.crt, the browser checks that graf01.lab appears in its SAN, and after the handshake Nginx reads the plain request. Normal requests match location /, and the Grafana Live WebSocket matches location /api/live/. The first diagram shows this path from the laptop to Grafana and back.
3Nginx forwards to 127.0.0.1:3000 with headers
proxy_pass http://grafana sends the request to the upstream block, which points at 127.0.0.1:3000. Nginx adds Host: graf01.lab, the client IP in X-Forwarded-For and X-Forwarded-Proto: https. For /api/live/ it also switches to HTTP/1.1 and passes Upgrade: websocket and Connection: upgrade, so the connection can stay open.
4Grafana checks and answers using root_url
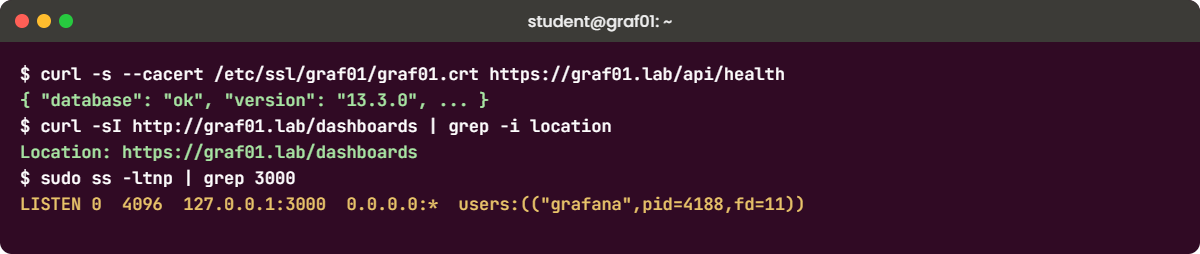
Grafana compares the Origin header of each POST with the Host it received, runs the request, and builds any absolute link (a redirect after login, the link in an alert email) from root_url. The second diagram stacks the settings on graf01 from the network edge down to Grafana.
5Self-signed now, Let’s Encrypt for real names
A self-signed certificate encrypts traffic as well as any other, but nobody vouches for it, so browsers warn until you trust it by hand. That’s fine for a lab with a made-up name like graf01.lab. For a real domain that the internet can resolve, use Let’s Encrypt with certbot --nginx, or your company’s internal CA, and the warnings go away for everyone.
| Choice | Good for | Watch out for |
|---|---|---|
| Self-signed with SAN | Labs, internal test boxes | Every browser and tool must trust it by hand; curl needs --cacert |
| Company internal CA | Internal tools on company laptops | The CA certificate must be in each laptop’s trust store (usually pushed by IT) |
| Let’s Encrypt (certbot) | Public DNS names | Needs port 80 or DNS validation and renews every 90 days, automatically with certbot’s timer |
Hands-on lab: https://graf01.lab/ with Nginx, a SAN certificate and Grafana on 127.0.0.1
Before you run any command, double-check it
Read every command twice before you press Enter. Check the target: the server name, the user, the disk or device name, the path and the sizes. These commands are for learning and were tested in our lab, not on your system. At work, run the read-only commands first, follow your change process, make sure a backup exists, and ask a second person to check anything that changes or deletes data. You run them at your own risk.
Start from the grafana-installed snapshot of graf01. Every command runs on graf01 unless a step says “on your laptop”. You end with Grafana on https://graf01.lab/ and port 3000 closed to the network.
1Map graf01.lab on your laptop
Your laptop needs to know that graf01.lab means 192.168.56.70. Edit the hosts file as administrator: /etc/hosts on Linux and macOS, C:\Windows\System32\drivers\etc\hosts on Windows (open Notepad with “Run as administrator”).
Add this line on your laptop:
192.168.56.70 graf01.labThen run this on your laptop:
ping -c 2 graf01.labOn a Linux laptop you should see (your times will differ):
PING graf01.lab (192.168.56.70) 56(84) bytes of data.
64 bytes from graf01.lab (192.168.56.70): icmp_seq=1 ttl=64 time=0.402 ms
64 bytes from graf01.lab (192.168.56.70): icmp_seq=2 ttl=64 time=0.388 msOn Windows use ping -n 2 graf01.lab; Windows and macOS word the lines a little differently, but the reply must come from 192.168.56.70. The VMs already know the name from Lesson 1, because their /etc/hosts has the graf01.lab line.
✅ Checkpoint: ping graf01.lab from your laptop answers from 192.168.56.70.
2Install Nginx and open the firewall
Run this on graf01:
sudo apt-get install -y nginx
sudo ufw allow OpenSSH
sudo ufw allow from 192.168.56.0/24 to any port 443 proto tcp
sudo ufw allow from 192.168.56.0/24 to any port 80 proto tcp
sudo ufw --force enable
sudo ufw status numberedYou should see:
Status: active
To Action From
-- ------ ----
[ 1] OpenSSH ALLOW IN Anywhere
[ 2] 443/tcp ALLOW IN 192.168.56.0/24
[ 3] 80/tcp ALLOW IN 192.168.56.0/24
[ 4] OpenSSH (v6) ALLOW IN Anywhere (v6)Allow SSH before enabling ufw, or you lock yourself out of your own session. Port 3000 isn’t in the list, so from now on the firewall drops it; port 80 stays open only to redirect people to HTTPS.
✅ Checkpoint: ufw is active with OpenSSH, 443 and 80 allowed, and nothing for 3000.
3Create a self-signed certificate with SAN
Paste this whole block on graf01:
sudo mkdir -p /etc/ssl/graf01
sudo openssl req -x509 -nodes -newkey rsa:2048 -days 825 \
-keyout /etc/ssl/graf01/graf01.key -out /etc/ssl/graf01/graf01.crt \
-subj "/CN=graf01.lab" \
-addext "subjectAltName=DNS:graf01.lab,IP:192.168.56.70"
sudo chmod 600 /etc/ssl/graf01/graf01.key
openssl x509 -in /etc/ssl/graf01/graf01.crt -noout -subject -ext subjectAltName -enddateYou should see (the dots, plus signs and date will differ):
.....+...+++++++++++++++++++++++++++++++++
-----
subject=CN=graf01.lab
X509v3 Subject Alternative Name:
DNS:graf01.lab, IP Address:192.168.56.70
notAfter=Feb 10 06:14:58 2029 GMTThe dots and plus signs are OpenSSL generating the key. That’s OpenSSL 3.5 on Ubuntu 26.04; the OpenSSL 3.0 on 24.04 prints the subject with spaces, as subject=CN = graf01.lab. The -addext option puts the SAN straight into the certificate, and including the IP lets https://192.168.56.70/ pass the name check too. 825 days is the longest lifetime Apple devices accept for a certificate like this.
✅ Checkpoint: openssl x509 shows DNS:graf01.lab and IP Address:192.168.56.70 in the SAN.
4Write the Nginx site for Grafana
Paste this whole block on graf01:
sudo tee /etc/nginx/sites-available/grafana >/dev/null <<'EOF'
# Needed for Grafana Live (WebSocket)
map $http_upgrade $connection_upgrade {
default upgrade;
'' close;
}
upstream grafana {
server 127.0.0.1:3000;
}
server {
listen 80;
server_name graf01.lab 192.168.56.70;
return 301 https://graf01.lab$request_uri;
}
server {
listen 443 ssl;
server_name graf01.lab 192.168.56.70;
ssl_certificate /etc/ssl/graf01/graf01.crt;
ssl_certificate_key /etc/ssl/graf01/graf01.key;
ssl_protocols TLSv1.2 TLSv1.3;
location / {
proxy_set_header Host $host;
proxy_set_header X-Real-IP $remote_addr;
proxy_set_header X-Forwarded-For $proxy_add_x_forwarded_for;
proxy_set_header X-Forwarded-Proto $scheme;
proxy_pass http://grafana;
}
location /api/live/ {
proxy_http_version 1.1;
proxy_set_header Upgrade $http_upgrade;
proxy_set_header Connection $connection_upgrade;
proxy_set_header Host $host;
proxy_pass http://grafana;
}
}
EOF
sudo ln -sf /etc/nginx/sites-available/grafana /etc/nginx/sites-enabled/grafana
sudo rm -f /etc/nginx/sites-enabled/default
sudo nginx -t && sudo systemctl reload nginxYou should see:
nginx: the configuration file /etc/nginx/nginx.conf syntax is ok
nginx: configuration file /etc/nginx/nginx.conf test is successfulThe map sets $connection_upgrade to “upgrade” when the browser asks for a WebSocket and to “close” otherwise. proxy_pass http://grafana has no trailing path, so Nginx passes the URI unchanged, which is what Grafana expects at the root of a host name. Ubuntu 26.04’s newer Nginx also accepts http2 on; inside the server block, but 24.04’s Nginx 1.24 doesn’t, so it’s left out to keep one config for both.
✅ Checkpoint: nginx -t says syntax is ok and test is successful, and nginx reloaded.
5Tell Grafana about the proxy
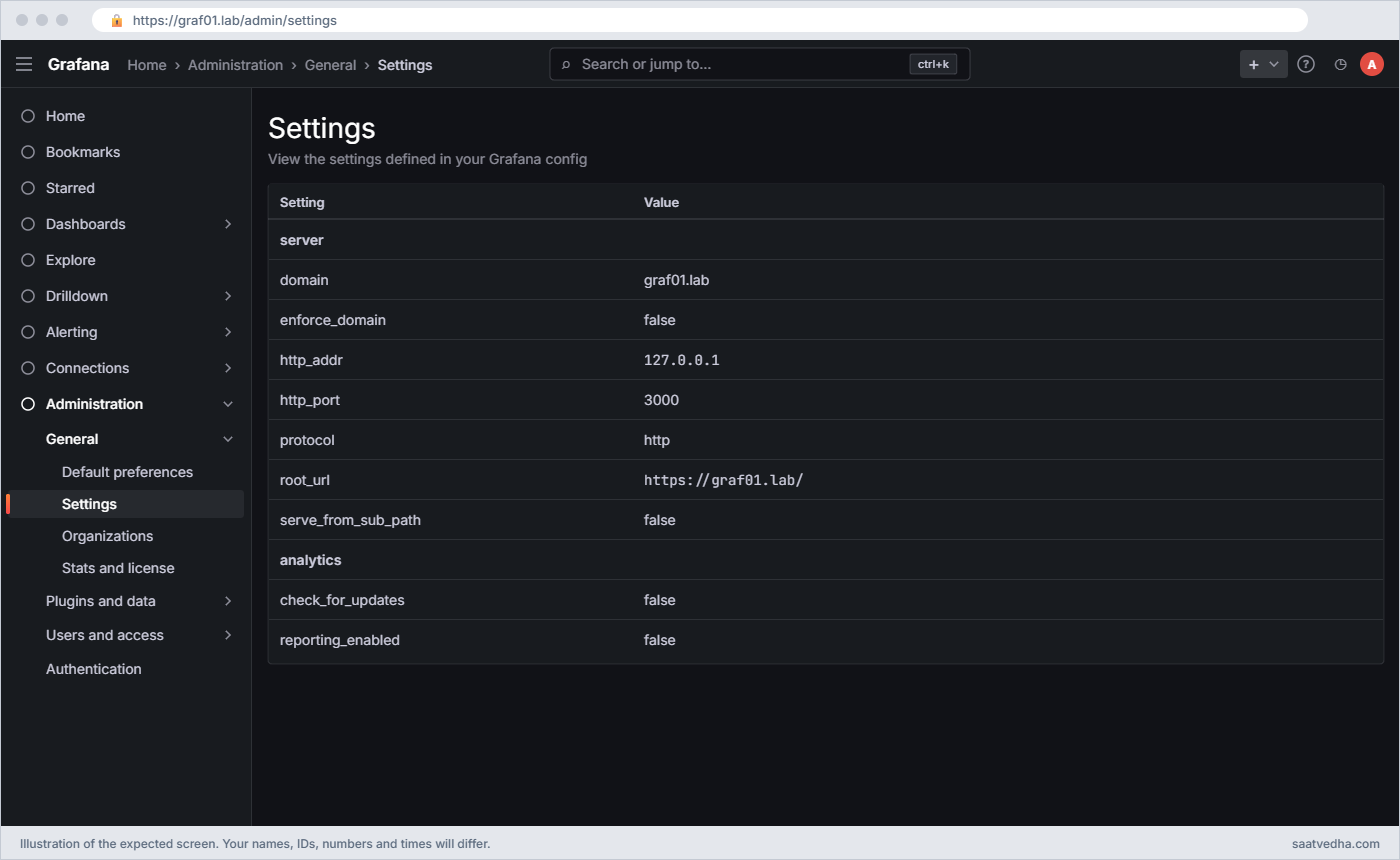
Edit /etc/grafana/grafana.ini and set these lines in the [server] section (uncomment them and keep domain = graf01.lab from Lesson 2):
[server]
protocol = http
http_addr = 127.0.0.1
http_port = 3000
domain = graf01.lab
root_url = https://graf01.lab/
serve_from_sub_path = falseThen run this:
sudo systemctl restart grafana-server
sudo ss -ltnp | grep -E ':(3000|443|80) 'You should see (your PIDs will differ):
LISTEN 0 511 0.0.0.0:443 0.0.0.0:* users:(("nginx",pid=4120,fd=7),("nginx",pid=4119,fd=7))
LISTEN 0 511 0.0.0.0:80 0.0.0.0:* users:(("nginx",pid=4120,fd=6),("nginx",pid=4119,fd=6))
LISTEN 0 4096 127.0.0.1:3000 0.0.0.0:* users:(("grafana",pid=4188,fd=11))protocol stays http because Nginx handles TLS, and Grafana only talks plain HTTP on loopback. Grafana now listens on 127.0.0.1:3000 instead of *:3000, so even with ufw off nobody outside graf01 could reach it directly.
✅ Checkpoint: ss shows nginx on 0.0.0.0:443 and :80, and grafana only on 127.0.0.1:3000.
6Test from graf01 with curl
Run this on graf01:
curl -s --cacert /etc/ssl/graf01/graf01.crt https://graf01.lab/api/health; echo
curl -sI http://graf01.lab/dashboards | grep -iE '^(HTTP|location)'
curl -sI https://graf01.lab/ -k | grep -iE '^(HTTP|location|server)'You should see:
{
"database": "ok",
"version": "13.3.0",
"commit": "..."
}
HTTP/1.1 301 Moved Permanently
Location: https://graf01.lab/dashboards
HTTP/1.1 302 Found
Server: nginx/1.28.3 (Ubuntu)
Location: /login--cacert tells curl to trust your own certificate, so the first call checks the full chain and name. Port 80 redirects to HTTPS with the path kept, and the root redirects to /login because you aren’t logged in. The “commit” line shows your build’s real Git hash, and on 24.04 the Server line reads nginx/1.24.0 (Ubuntu).
✅ Checkpoint: /api/health answers over HTTPS with the cacert option, port 80 redirects to https://graf01.lab/, and / redirects to /login.
7Trust the certificate on your laptop and log in
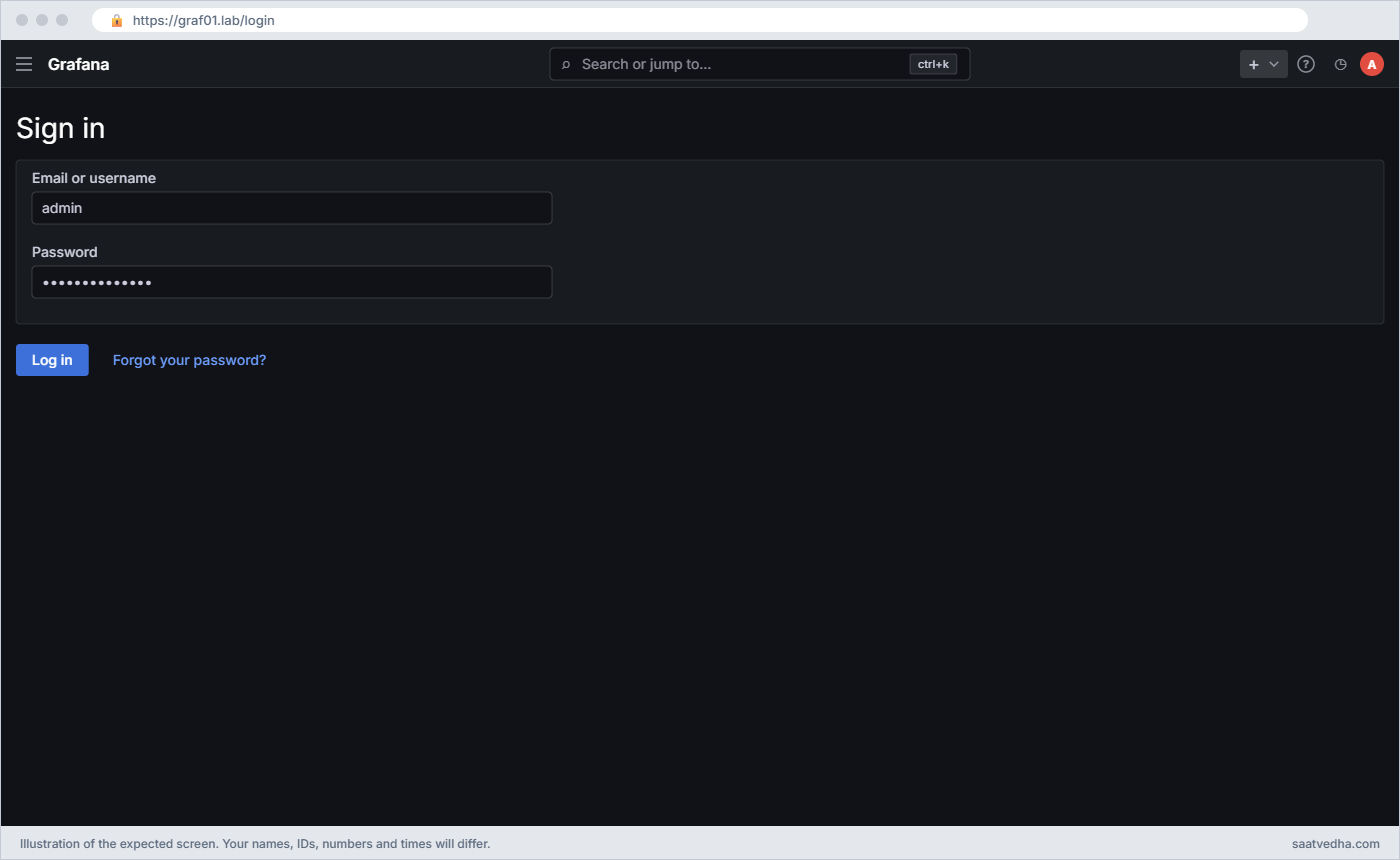
Copy the certificate to your laptop with scp student@192.168.56.70:/etc/ssl/graf01/graf01.crt . and import it: on Windows double-click it and install into “Trusted Root Certification Authorities”, on macOS add it to the System keychain in Keychain Access and set it to Always Trust, and in Firefox use Settings > Privacy & Security > Certificates > Import. Then open https://graf01.lab/ and log in.
If you’d rather not import it, the browser shows a warning page and you can continue with “Advanced”, which is fine for a lab but trains bad habits, so prefer the import. Open any dashboard (or Explore with TestData), then in the browser developer tools Network tab filter on “ws”: you should see a request to wss://graf01.lab/api/live/ws with status 101.
✅ Checkpoint: https://graf01.lab/ loads Grafana with a padlock, and /api/live/ws shows status 101 Switching Protocols.
8Prove that port 3000 is closed
Run this on your laptop:
curl -s -m 5 http://192.168.56.70:3000/api/health || echo "blocked"You should see:
blockedThe request times out after 5 seconds because nothing outside graf01 can reach Grafana’s port any more. If you see the health JSON instead, check http_addr and that ufw is active.
✅ Checkpoint: Port 3000 is unreachable from the laptop and Grafana still works through https://graf01.lab/.
9Check the logs and save a snapshot
Close the Grafana browser tab first, because Nginx writes the log line for a WebSocket only when that connection ends.
Run this on graf01:
sudo grep -oE '"(GET|POST) /api/(live/ws|ds/query)[^ ]* HTTP/1.1" [0-9]+' /var/log/nginx/access.log | sed 's/?[^ ]*//' | sort | uniq -c
sudo grep -c '" 403 ' /var/log/nginx/access.logYou should see (your counts will differ):
1 "GET /api/live/ws HTTP/1.1" 101
6 "POST /api/ds/query HTTP/1.1" 200
0The first command pulls the request and status out of each matching access log line, drops the query string and counts them. You get one WebSocket upgrade (101) per browser tab you opened and one 200 for each query you ran. Zero 403 lines means no request was refused, so the Host header is right.
Shut graf01 down and take a snapshot called https.
✅ Checkpoint: Nginx logs 101 for /api/live/ws and 200 for queries, and graf01 has a snapshot called https.
Break It, Then Fix It
You have the https snapshot, so break things freely. Each of these is a real ticket you’ll see in a NOC.
1“origin not allowed” from a wrong Host header
A common copy-paste from old blog posts sends a fixed Host to the backend. Change the location / block:
Run this on graf01:
sudo sed -i '0,/proxy_set_header Host \$host;/s//proxy_set_header Host localhost:3000;/' /etc/nginx/sites-available/grafana
sudo nginx -t && sudo systemctl reload nginxNow reload https://graf01.lab/ in your logged-in browser and run a query in Explore, or save a dashboard.
You’ll get this error (in the panel or a red pop-up, and in the browser’s Network tab):
POST https://graf01.lab/api/ds/query 403 Forbidden
origin not allowedGrafana compares the host name in the browser’s Origin header (graf01.lab) with the Host header it received (now localhost). They differ, so every POST from a logged-in browser is refused with 403 as a cross-site request forgery guard. GET requests still work, which is why the page loads but queries and saves fail.
Fix: send the browser’s host name through:
sudo sed -i 's/proxy_set_header Host localhost:3000;/proxy_set_header Host $host;/' /etc/nginx/sites-available/grafana
sudo nginx -t && sudo systemctl reload nginx✅ Checkpoint: Queries in Explore work again and the Network tab shows 200 for /api/ds/query.
2A wrong root_url breaks the page
Someone reads about sub paths and changes only root_url, leaving serve_from_sub_path off and Nginx as it is:
Run this on graf01:
sudo sed -i 's|^root_url = https://graf01.lab/$|root_url = https://graf01.lab/grafana/|' /etc/grafana/grafana.ini
sudo systemctl restart grafana-server
curl -sk -o /dev/null -w '%{http_code} %{redirect_url}\n' https://graf01.lab/You’ll get this, and a broken page in the browser:
302 https://graf01.lab/grafana/loginGrafana now builds every link with /grafana/ in front, so it sends the browser to /grafana/login. Without serve_from_sub_path Grafana expects the proxy to strip that prefix, Nginx doesn’t, and the page’s scripts and CSS under /grafana/public/ can’t be found. The browser shows the grey page “If you’re seeing this Grafana has failed to load its application files”, which even suggests checking root_url.
Other mismatches between root_url, serve_from_sub_path and the Nginx location give 404s or “too many redirects”.
Fix: put root_url back to the root of the host name:
sudo sed -i 's|^root_url = https://graf01.lab/grafana/|root_url = https://graf01.lab/|' /etc/grafana/grafana.ini
sudo systemctl restart grafana-server
curl -sk -o /dev/null -w '%{http_code} %{redirect_url}\n' https://graf01.lab/302 https://graf01.lab/login✅ Checkpoint: https://graf01.lab/ redirects to /login and the browser loads Grafana normally.
3502 Bad Gateway when Grafana is down
Run this on graf01:
sudo systemctl stop grafana-server
curl -sk https://graf01.lab/ | head -5
sudo tail -n 1 /var/log/nginx/error.logYou’ll get this error:
<html>
<head><title>502 Bad Gateway</title></head>
<body>
<center><h1>502 Bad Gateway</h1></center>
<hr><center>nginx/1.28.3 (Ubuntu)</center>
2026/11/08 07:31:22 [error] 4120#4120: *57 connect() failed (111: Connection refused) while connecting to upstream, client: 127.0.0.1, server: graf01.lab, request: "GET / HTTP/1.1", upstream: "http://127.0.0.1:3000/", host: "graf01.lab"502 always comes from Nginx, never from Grafana: Nginx is alive but the thing behind it refused the connection. The error log names the upstream address it tried, so you know immediately to check whether Grafana runs and listens on 127.0.0.1:3000. The same 502 appears if http_addr says one address and the upstream block another.
Fix:
sudo systemctl start grafana-server
sudo ss -ltnp | grep ':3000 '
curl -s --cacert /etc/ssl/graf01/graf01.crt -o /dev/null -w '%{http_code}\n' https://graf01.lab/api/healthLISTEN 0 4096 127.0.0.1:3000 0.0.0.0:* users:(("grafana",pid=4391,fd=11))
200✅ Checkpoint: grafana listens on 127.0.0.1:3000 again and /api/health returns 200 through Nginx.
4Certificate name mismatch
Browse to a name the certificate doesn’t cover. On graf01, graf01 (without .lab) resolves through /etc/hosts:
Run this on graf01:
curl -sS --cacert /etc/ssl/graf01/graf01.crt https://graf01/ -o /dev/nullYou’ll get this error:
curl: (60) SSL: no alternative certificate subject name matches target host name 'graf01'
More details here: https://curl.se/docs/sslcerts.html
curl failed to verify the legitimacy of the server and therefore could not
establish a secure connection to it. To learn more about this situation and
how to fix it, please visit the webpage mentioned above.The certificate is trusted, but its SAN lists graf01.lab and 192.168.56.70, not graf01. A browser shows NET::ERR_CERT_COMMON_NAME_INVALID for the same reason. Either use a name that’s in the SAN, or reissue the certificate with every name people will type.
Fix: use the right name, or add the short name to the SAN and reissue:
curl -sS --cacert /etc/ssl/graf01/graf01.crt -o /dev/null -w '%{http_code}\n' https://graf01.lab/api/health
# to cover the short name too, rerun step 3 with:
# -addext "subjectAltName=DNS:graf01.lab,DNS:graf01,IP:192.168.56.70"200✅ Checkpoint: https://graf01.lab/ passes the certificate check and you know how to add a name to the SAN.
This happened at work
The hospital dashboards that saved nothing
An on-call engineer I worked with at a hospital chain in Hyderabad had this on his first week. The infra team had moved Grafana behind the company’s Nginx so doctors’ admin staff could see bed-occupancy dashboards over HTTPS. Viewing worked perfectly, but around 11 am the analytics team reported that nobody could save a dashboard and every new Explore query showed a red error.
The team first suspected the Grafana upgrade done the night before and spent an hour reading release notes. Then he opened the browser’s Network tab and saw 403 with the text “origin not allowed” on every POST, while every GET was fine.
The Nginx config had been copied from an internal wiki page written for another app, and it had proxy_set_header Host 127.0.0.1; so the backend would “see itself”. Grafana compared the host name in the Origin header with 127.0.0.1, found a mismatch and refused every write.
Changing it to $host and reloading Nginx fixed it in a minute. The team then put the Grafana proxy config in their Git repository with a comment over each header, and added a check to their deployment script that posts a test query through the proxy and fails the change if it doesn’t return 200.
Common mistakes and troubleshooting
| Mistake | What happens | What to do instead |
|---|---|---|
| Leaving Grafana on *:3000 behind the proxy | Users bypass HTTPS and the proxy’s logging by going to :3000 | Set http_addr = 127.0.0.1 and keep 3000 closed in ufw |
| Hard-coding the Host header | Every POST fails with 403 “origin not allowed” | Use proxy_set_header Host $host |
| Forgetting the WebSocket headers on /api/live/ | Live updates and streaming panels don’t refresh; console shows WebSocket errors | Add the map plus Upgrade and Connection headers and proxy_http_version 1.1 |
| root_url still says http://localhost:3000 | Login redirects, alert email links and invites point to the wrong address | Set root_url = https://graf01.lab/ |
| Turning on serve_from_sub_path without a matching proxy path | “failed to load its application files”, 404s or a redirect loop | Use a sub path only when Nginx, root_url and serve_from_sub_path all agree |
| Certificate without SAN | Browsers show a name error even when CN is right | Always add subjectAltName with every DNS name and IP people will use |
| Enabling ufw before allowing SSH | You lock yourself out of the VM | Run ufw allow OpenSSH first, then ufw enable |
Interview questions
Click a question to open it. Each one is written the way an interviewer would ask it. Under it you will see why they ask it and one way you could answer, in your own words.
Fresher level
1. Why do companies put Grafana behind Nginx instead of opening port 3000?
Why they ask this: They want the basic security and operations reasons, not “because the guide said so”.
How you might answer: Nginx handles HTTPS with a proper certificate on port 443, so passwords and session cookies are encrypted, and Grafana itself listens only on 127.0.0.1:3000. It also gives one place for access logs, rate limits, IP allow lists and redirects from http to https.
It also lets several apps share one server and one port 443, each on its own host name.
2. What does a 502 Bad Gateway from Nginx tell you?
Why they ask this: A check that you know which side of the proxy failed.
How you might answer: 502 means Nginx is running but couldn’t get a valid answer from the backend. For Grafana I look at the Nginx error log, which shows the upstream it tried, like 127.0.0.1:3000 with connection refused, then check systemctl status grafana-server and ss -ltnp for port 3000.
2–5 years experience
3. After moving Grafana behind a proxy, dashboards load but saving fails with “origin not allowed”. What’s wrong?
Why they ask this: They’re testing whether you understand Grafana’s CSRF check and the Host header.
How you might answer: Grafana compares the host in the browser’s Origin header with the Host header it receives on every POST from a logged-in session. If the proxy sends a fixed Host like localhost or 127.0.0.1, they don’t match and Grafana returns 403 origin not allowed.
The fix is proxy_set_header Host $host in Nginx; GETs keep working, which is why only saves and queries fail.
4. Walk me through serving Grafana at https://tools.company.com/grafana/ instead of its own host name.
Why they ask this: They want to see that you know the three settings that must agree.
How you might answer: In grafana.ini I set root_url = https://tools.company.com/grafana/ and serve_from_sub_path = true. In Nginx I add location /grafana/ with proxy_pass http://127.0.0.1:3000 without a trailing path, so the /grafana prefix reaches Grafana, plus the same Host and WebSocket headers on /grafana/api/live/.
If only one side changes you get the “failed to load its application files” page, 404s or redirect loops, so I test login, a dashboard and a live panel after each change.
Senior level
5. How would you make Grafana highly available behind a load balancer?
Why they ask this: They want architecture: shared database, sessions, alerting and the proxy’s role.
How you might answer: I’d run two or more Grafana servers with the same grafana.ini and secret_key, all pointing at one MySQL or PostgreSQL database instead of SQLite. The load balancer or Nginx upstream lists both, with health checks on /api/health.
Grafana Live needs WebSockets passed through, so the balancer must support upgrade. For alerting I’d configure the HA settings so the instances share alert state and don’t send duplicate notifications.
6. Your security team asks you to harden the Grafana proxy. What would you change?
Why they ask this: They want concrete controls, not generic advice.
How you might answer: On Nginx I’d allow only TLS 1.2 and 1.3, add HSTS once the certificate is from a trusted CA, limit /login with limit_req to slow brute force, and restrict access to company IP ranges if possible. In Grafana I’d set cookie_secure = true, keep http_addr on 127.0.0.1 and turn off sign-up and anonymous access.
I’d also send Nginx access logs to our log platform so failed logins and odd paths can be alerted on.
Quick quiz
Q1. Which grafana.ini setting stops other machines reaching Grafana’s port directly?
- domain = graf01.lab
- http_addr = 127.0.0.1
- root_url = https://graf01.lab/
- enforce_domain = true
Show answer
B — http_addr decides which address Grafana listens on; 127.0.0.1 means only local programs like Nginx can connect.
Q2. What causes “origin not allowed” on every save behind a proxy?
- An expired certificate
- The proxy sends a Host header that differs from the browser’s Origin
- Grafana is stopped
- ufw blocks port 443
Show answer
B — Grafana’s CSRF check compares Origin with Host on POST requests.
Q3. Why does the Nginx config need the map and Upgrade/Connection headers?
- For gzip compression
- So Grafana Live can upgrade /api/live/ws to a WebSocket
- To redirect port 80 to 443
- To check the certificate SAN
Show answer
B — WebSocket needs HTTP/1.1 with Upgrade and Connection headers passed through.
Q4. Nginx returns 502 Bad Gateway. Where is the problem most likely?
- In the browser
- In the certificate
- Between Nginx and Grafana, for example Grafana stopped
- In the hosts file on the laptop
Show answer
C — 502 means Nginx could not get a valid answer from the upstream.
Q5. A browser warns about the certificate name although the CN is graf01.lab. What is missing?
- A longer key
- The subjectAltName extension
- A second server block
- The X-Forwarded-For header
Show answer
B — Browsers check only the SAN list, not the CN.
Quick recap
- Nginx terminates HTTPS on 443 and forwards to Grafana on 127.0.0.1:3000; ufw keeps 3000 closed to the network.
- Pass Host $host, X-Forwarded-For and X-Forwarded-Proto, and add the WebSocket map and headers on /api/live/ for Grafana Live.
- Set domain and root_url = https://graf01.lab/ so redirects, alert links and invites use the public address; use serve_from_sub_path only with a matching proxy path.
- Self-signed certificates need a SAN with every name and IP; real domains should use Let’s Encrypt or a company CA.
- 502 points at the backend, “origin not allowed” at the Host header, and a broken page or redirect loop at root_url or sub path settings.
Next lesson
Lesson 4: Your first Grafana dashboard: data sources and panels → You install Prometheus and node_exporter, add Prometheus as a data source and build a dashboard with time series, stat, gauge, bar gauge and table panels, then save, version and export it.
Further reading: Grafana Nginx reverse proxy
Want to go deeper into Grafana Nginx reverse proxy? Grafana’s tutorial Run Grafana behind a reverse proxy and the [server] configuration reference cover root_url and sub paths, the Nginx WebSocket proxying page explains the map block, and Certbot handles Let’s Encrypt for real domains. The SaatVedha lesson on securing Prometheus with Nginx uses the same pattern for Prometheus, and Lesson 2 covers grafana.ini basics.
You can also see the full plan for this course on the Grafana Dashboards and Observability course page.
