Grafana alerting: rules, contact points and policies
-
Phase 1: Grafana setup and your first dashboards
-
Phase 2: Data sources, logs and metrics
-
Phase 3: Alerting, teams and running Grafana
Dashboards only help when someone is looking at them. Grafana alerting watches the queries for you, decides when something is wrong for long enough to matter, and sends a message to the right people. In this lesson you set up Mailpit on graf01 as a safe mail catcher, connect Grafana’s SMTP settings to it, and build two Grafana-managed alert rules: high CPU and a dead server.
Then you route those alerts with notification policies and labels, add a maintenance time interval, a silence and a custom email subject, and break the setup three ways: no SMTP, a query that returns nothing, and a label that sends critical alerts to the wrong mailbox.
Where this lesson fits
Lesson 11 of 14 in Grafana Dashboards and Observability · Phase 3: Alerting, teams and running Grafana · Before this: Lesson 10, InfluxDB and Telegraf · Next: Lesson 12, users, teams and permissions
| Time | You need | By the end you can |
|---|---|---|
| About 100 minutes | graf01 and app01 from Lesson 10, with Prometheus, the recording rule from Lesson 9 and node_exporter on app01 | Write alert rules with labels and pending periods, route them through contact points and policies, and explain NoData and Error states |
What it is, in one line
A Grafana alert rule runs a query on a schedule, checks the result against a condition, and when the condition stays true for the pending period it fires an alert that notification policies route by its labels to a contact point such as email.
In Simple Words
The building watchman and the society office
In a Mumbai housing society, the night watchman checks the water tank level every hour. One low reading could be a pump hiccup, so he waits until it’s low on two rounds in a row before he does anything. Then he doesn’t decide who to wake; he writes “tank low, Wing B” on a slip and drops it at the society office.
The office has a chart on the wall: plumbing problems go to the plumber, electrical ones to the electrician, anything else to the secretary, and nobody is called between 2 and 4 on Sunday morning when the pump is serviced anyway.
The watchman is the alert rule with its pending period, the slip’s “Wing B” and “plumbing” words are labels, and the chart on the wall is the notification policy tree.
Engineer's View
The parts of Grafana alerting
Grafana-managed alerting is built on the Prometheus Alertmanager model, with its own rule evaluator. The rule side decides whether something is wrong; the notification side decides who hears about it and how. The two meet only through labels.
| Part | What it does | In this lab |
|---|---|---|
| Alert rule | Query + condition, evaluated every group interval; one alert instance per series | High CPU on app01, node down |
| Folder and evaluation group | Folder controls permissions; the group sets how often its rules run | Folder SaatVedha Lab, group linux-1m every 1m |
| Pending period | How long the condition must stay true before Pending becomes Firing | 2m for CPU, 1m for node down |
| Labels | Key/value pairs on the alert, used for routing, silences and grouping | team=linux, severity=warning or critical |
| Annotations | Text for humans: summary, description, runbook URL | Summary with the instance and value |
| Contact point | Where a message goes: email, Telegram, Slack, webhook and more | team-email, catch-all |
| Notification policy | Tree of label matchers that picks a contact point and grouping | team=linux goes to team-email |
| Time interval (mute timing) | Periods when a policy sends nothing | sunday-maintenance, Sunday 02:00-04:00 |
| Silence | Temporary mute for alerts matching labels, set by a person | Silence app01 during a planned test |
Every alert instance is in one of a few states: Normal, Pending, Firing, Recovering, and two special ones. If the query returns nothing, the rule’s “Alert state if no data or all values are null” setting decides what happens, and the default creates an alert named DatasourceNoData. If the query fails, “Alert state if execution error or timeout” applies and the default alert is named DatasourceError.
Both keep the rule’s own labels, so they follow the same route as the real alert.
How it works, step by step
1The rule evaluates on its group’s schedule
Every minute (the group interval) Grafana runs the rule’s query against Prometheus, here instance:node_cpu_utilisation:rate5m from Lesson 9, and applies the condition, for example “is above 80”. Each returned series becomes its own alert instance with the series labels plus the rule labels. An instance that crosses the threshold goes to Pending and, after staying there for the pending period, to Firing.
The diagram follows one instance from query to email.
2Firing alerts go to Grafana’s Alertmanager
Firing and resolved instances are handed to Grafana’s built-in Alertmanager. It walks the notification policy tree from the top, finds the deepest policy whose matchers fit the alert’s labels, and groups alerts by the labels named in Group by, so ten servers with high CPU at once become one email if you group by alertname only.
3Policies decide who, when and how often
The matching policy names a contact point and three timers: group wait (how long to wait for more alerts before the first message), group interval (how soon to send updates for a group) and repeat interval (how often to remind about alerts still firing). Time intervals and silences are checked last and can hold the message back. The diagram below shows the tree you build in this lesson.
4Labels are the only link between rules and policies
A policy never looks at the rule’s name or folder, only at labels. That makes routing flexible and also fragile: a label written team=Linux doesn’t match a policy for team=linux. Grafana’s Preview routing button on the rule form shows which policy an alert would hit, and using it on every new rule saves a lot of embarrassment.
| Timer | Default | Lab value | Effect |
|---|---|---|---|
| Group wait | 30s | 30s | First message for a new group after 30 seconds |
| Group interval | 5m | 5m | New alerts joining a group wait up to 5 minutes |
| Repeat interval | 4h | 4h | A still-firing group is re-sent every 4 hours |
Hands-on lab: CPU and node-down alerts routed to a Mailpit inbox
Before you run any command, double-check it
Read every command twice before you press Enter. Check the target: the server name, the user, the disk or device name, the path and the sizes. These commands are for learning and were tested in our lab, not on your system. At work, run the read-only commands first, follow your change process, make sure a backup exists, and ask a second person to check anything that changes or deletes data. You run them at your own risk.
Everything runs on graf01 (192.168.56.70) except the load test and node_exporter stop on app01 (192.168.56.71). Mailpit catches every email Grafana sends, so you can test freely without a real mail server. In Grafana the alerting screens are under Alerts & IRM > Alerting.
1Install Mailpit on graf01 as a service
Paste this whole block on graf01:
sudo sh < <(curl -sL https://raw.githubusercontent.com/axllent/mailpit/develop/install.sh)
mailpit version
sudo tee /etc/systemd/system/mailpit.service >/dev/null <<'EOF'
[Unit]
Description=Mailpit mail catcher (lab)
After=network-online.target
[Service]
DynamicUser=yes
StateDirectory=mailpit
ExecStart=/usr/local/bin/mailpit --smtp 127.0.0.1:1025 --listen 0.0.0.0:8025 --database /var/lib/mailpit/mailpit.db
Restart=on-failure
[Install]
WantedBy=multi-user.target
EOF
sudo systemctl daemon-reload && sudo systemctl enable --now mailpit
sudo ufw allow from 192.168.56.0/24 to any port 8025 proto tcp
sudo journalctl -u mailpit -n 3 --no-pagerFirst the installer prints Mailpit v1.33.1 installed successfully to "/usr/local/bin/mailpit". and mailpit version prints the version, the Go version it was built with and linux/amd64. After that you should see this (your times and PID will differ, and the smtpd line can come after the two http lines):
Created symlink '/etc/systemd/system/multi-user.target.wants/mailpit.service' → '/etc/systemd/system/mailpit.service'.
Rule added
Nov 08 11:20:01 graf01 mailpit[7012]: time="2026/11/08 11:20:01" level=info msg="[smtpd] starting on 127.0.0.1:1025 (no encryption)"
Nov 08 11:20:01 graf01 mailpit[7012]: time="2026/11/08 11:20:01" level=info msg="[http] starting on 0.0.0.0:8025"
Nov 08 11:20:01 graf01 mailpit[7012]: time="2026/11/08 11:20:01" level=info msg="[http] accessible via http://0.0.0.0:8025/"SMTP listens only on 127.0.0.1, so only programs on graf01 can send through it, and the web UI on 8025 is open to the host-only network. DynamicUser=yes runs Mailpit as a throwaway user with its data in /var/lib/mailpit. Open http://192.168.56.70:8025 on your laptop and you’ll see an empty inbox.
✅ Checkpoint: mailpit is active, journalctl shows smtpd on 127.0.0.1:1025 and http on 0.0.0.0:8025, and the inbox opens from your laptop.
2Point Grafana’s [smtp] section at Mailpit
Paste this whole block on graf01:
sudo cp /etc/grafana/grafana.ini /etc/grafana/grafana.ini.bak-l11
sudo sed -i '/^\[smtp\]/,/^\[/ {
s/^;enabled = false/enabled = true/
s/^;host = localhost:25/host = 127.0.0.1:1025/
s/^;from_address = admin@grafana.localhost/from_address = grafana@lab.local/
s/^;from_name = Grafana/from_name = Grafana Lab/
s/^;startTLS_policy = NoStartTLS/startTLS_policy = NoStartTLS/
}' /etc/grafana/grafana.ini
sudo grep -A16 '^\[smtp\]' /etc/grafana/grafana.ini | grep -v '^[#;]'
sudo systemctl restart grafana-serverYou should see:
[smtp]
enabled = true
host = 127.0.0.1:1025
from_address = grafana@lab.local
from_name = Grafana Lab
startTLS_policy = NoStartTLSThe sed only touches lines between [smtp] and the next section, and only the commented sample lines, so nothing else in grafana.ini changes. NoStartTLS is right for Mailpit on localhost; with a real mail relay you’d use port 587 with STARTTLS, a user and a password.
✅ Checkpoint: The [smtp] section shows enabled = true and host = 127.0.0.1:1025, and grafana-server restarted cleanly.
3Create two contact points and test them
Go to Alerts & IRM > Alerting > Notification configuration, Contact points tab, and click + New contact point twice:
| Name | Integration | Addresses |
|---|---|---|
| team-email | oncall@lab.local | |
| catch-all | noc-catchall@lab.local |
On each, click Test before saving. Grafana shows “Test notification sent successfully” and the message appears in Mailpit. Then check from the command line:
Run this on graf01:
curl -s localhost:8025/api/v1/messages | jq -r '.messages[] | "\(.To[0].Address) | \(.Subject)"'You should see:
noc-catchall@lab.local | [FIRING:1] TestAlert Grafana
oncall@lab.local | [FIRING:1] TestAlert GrafanaA Telegram contact point works the same way: create a bot with @BotFather, put its token and your chat ID in a contact point called telegram-noc, and test it. It’s optional here because it needs a Telegram account and internet from graf01.
✅ Checkpoint: Both contact points exist and Mailpit shows one TestAlert email for each address.

4Build the notification policy tree
Open the Notification policies tab. Edit the Default policy: set its contact point to catch-all, Group by grafana_folder, alertname, and save. Then click + New child policy on it:
| Setting | Value |
|---|---|
| Matcher | team = linux |
| Contact point | team-email |
| Group by (override) | alertname, instance |
| Timing (override) | Group wait 30s, Group interval 5m, Repeat interval 4h |
Anything labelled team=linux now goes to oncall@lab.local in one group per alert name and server. Everything else falls through to the default policy and lands in the catch-all mailbox, which is where you’d notice rules that nobody owns.
✅ Checkpoint: The policy tree shows the default policy with catch-all and one child policy team = linux with team-email.
5Create a notification template for the subject
In Notification configuration, open the Notification templates tab, add a template group called lab-templates with this content, and save:
Template content:
{{ define "lab.subject" -}}
[{{ .Status | toUpper }}] {{ .CommonLabels.alertname }} on {{ .CommonLabels.instance }} ({{ .CommonLabels.severity }})
{{- end }}Edit the team-email contact point, open Optional Email settings, set Subject to {{ template "lab.subject" . }} and save. Because the team=linux policy groups by alertname and instance, both labels are common to every alert in a group, so the subject always has a value.
✅ Checkpoint: Template lab.subject exists and team-email uses it as the subject.
6Create the high CPU rule
Go to Alert rules > + New alert rule and fill it in:
| Section | Setting | Value |
|---|---|---|
| Name | High CPU | |
| Query and condition | Data source and query | Prometheus, instance:node_cpu_utilisation:rate5m{job=”node”} |
| Alert condition | WHEN query IS ABOVE 80 | |
| Folder and labels | Folder | SaatVedha Lab |
| Labels | team = linux, severity = warning | |
| Evaluation | Evaluation group | + New evaluation group: linux-1m, interval 1m |
| Pending period | 2m | |
| No data and error handling | Alert state if no data: Normal; if error: Error | |
| Notifications | Option | Advanced (use notification policy), then Preview routing |
| Annotations | Summary | CPU on {{ $labels.instance }} is {{ humanize $values.A.Value }}% |
| Description | CPU busy above 80% for 2 minutes. Check top on the server. |
Preview routing should show the team = linux policy and contact point team-email. Save the rule. In the alert rule list it appears under SaatVedha Lab > linux-1m with two instances, graf01:9100 and app01:9100, both Normal.
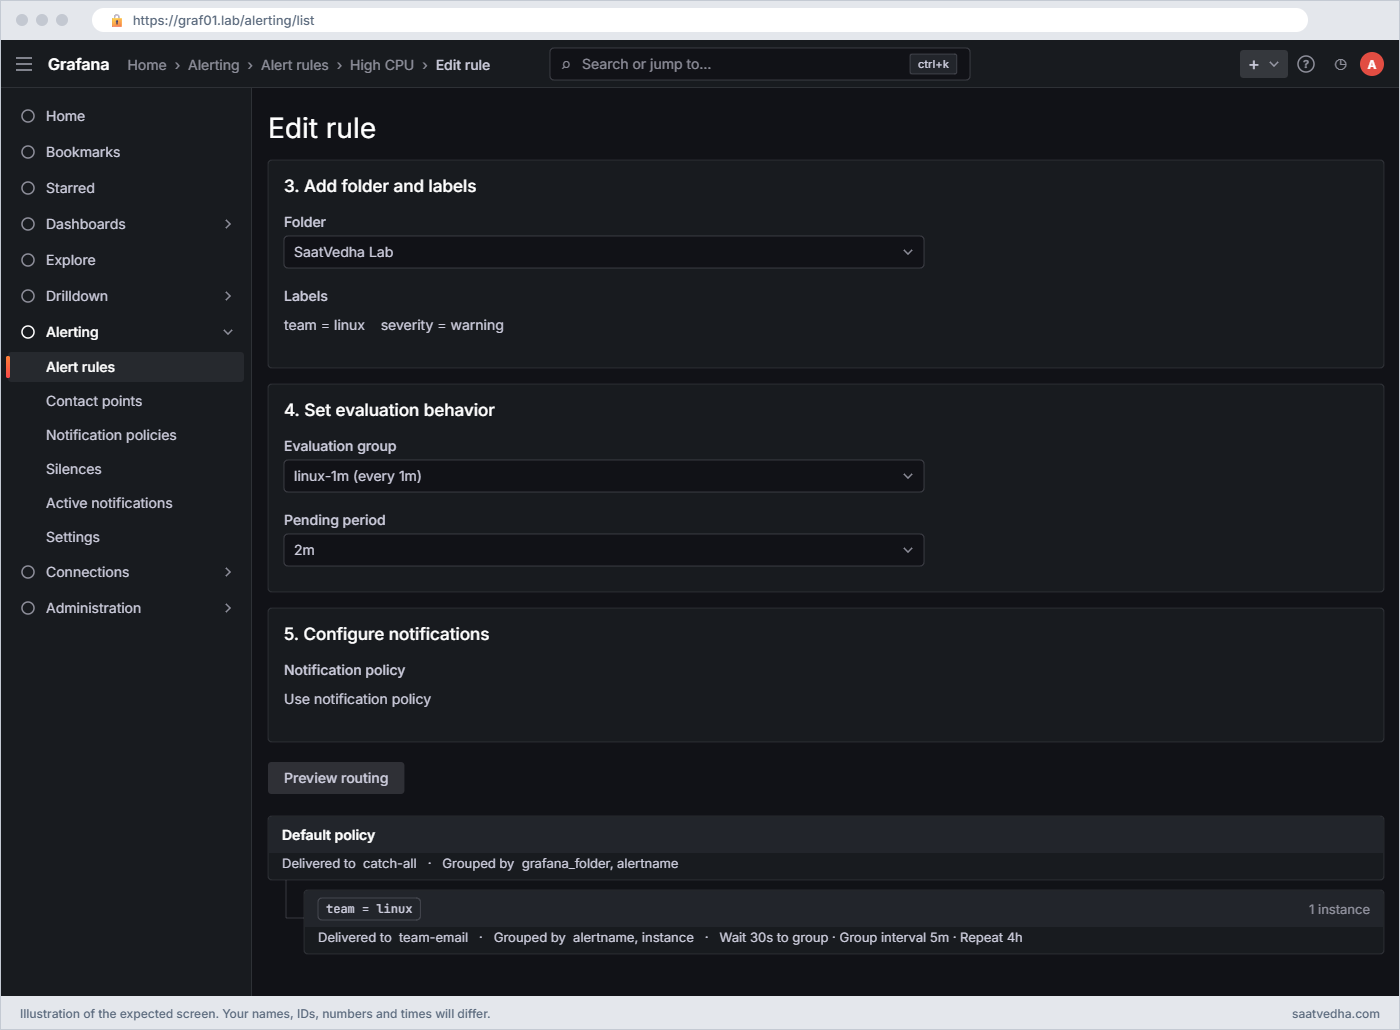
✅ Checkpoint: High CPU is saved in group linux-1m with two Normal instances, and Preview routing pointed at team-email.
7Create the node down rule
Create a second rule, Node down, in the same folder and group:
| Setting | Value |
|---|---|
| Query | up{job=”node”} |
| Alert condition | WHEN query IS BELOW 1 |
| Labels | team = linux, severity = critical |
| Pending period | 1m |
| Alert state if no data | Alerting |
| Summary | {{ $labels.instance }} is not answering scrapes |
up is 0 when Prometheus can’t scrape a target, so a stopped node_exporter or a powered-off VM fires this rule. “No data: Alerting” covers the worse case, where the series disappears completely, for example when someone deletes the job from prometheus.yml; for a CPU rule that same setting would be noisy, which is why the two rules differ.
✅ Checkpoint: Node down shows two Normal instances in linux-1m.
8Fire both rules and watch the emails
Run this on app01:
sudo apt-get install -y stress-ng
stress-ng --cpu 1 --timeout 420s &
sleep 240; sudo systemctl stop node_exporterWatch Alert rules: High CPU for app01:9100 goes Pending, then Firing after 2 minutes; about a minute after node_exporter stops, Node down goes Pending, then Firing. Then check Mailpit:
Run this on graf01:
curl -s localhost:8025/api/v1/messages | jq -r '.messages[0:3][] | "\(.To[0].Address) | \(.Subject)"'You should see:
oncall@lab.local | [FIRING] Node down on app01:9100 (critical)
oncall@lab.local | [FIRING] High CPU on app01:9100 (warning)
noc-catchall@lab.local | [FIRING:1] TestAlert GrafanaYour custom subject is in use and both went to oncall@lab.local. When you start node_exporter again (sudo systemctl start node_exporter) and stress-ng finishes, a [RESOLVED] email follows for each within a few minutes. While node_exporter was down, the High CPU instance for app01 had no data and stayed Normal, as configured.
✅ Checkpoint: Mailpit has FIRING emails for High CPU and Node down on app01:9100 with your subject, followed by RESOLVED emails after recovery.
9Add a maintenance time interval and a silence
On the Time intervals tab click + New time interval: name sunday-maintenance, days of the week sunday, time range 02:00 to 04:00, location Asia/Kolkata. Then edit the team = linux policy and add it under Mute timings. Alerts still evaluate during that window; only notifications for that policy are held back.
For a one-off, open Silences > + New silence, set the matcher instance = app01:9100, duration 30m and comment “planned stress test”, and save. Run the stress test again and High CPU fires in the rule list, but no email arrives, because the silence matches.
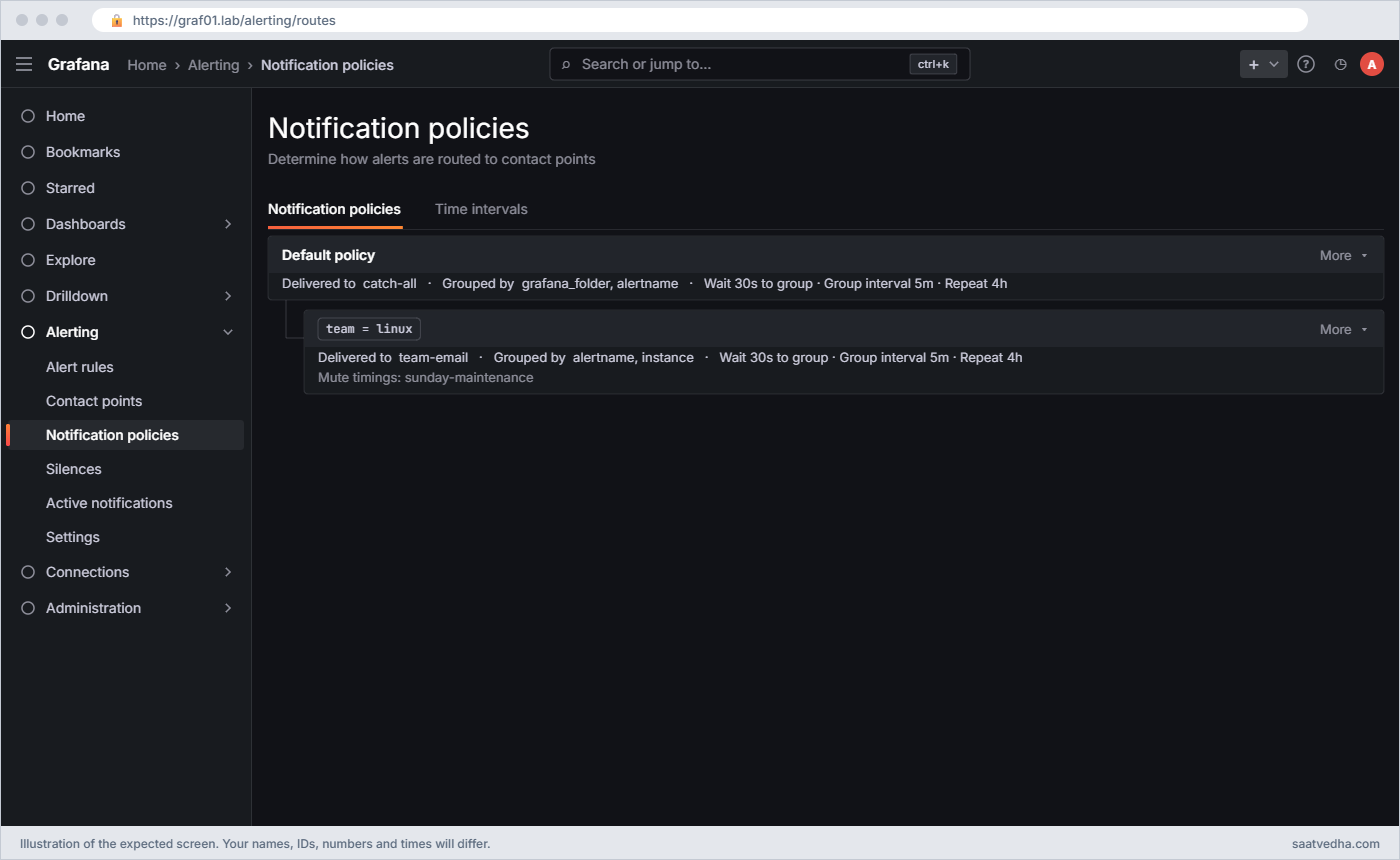
✅ Checkpoint: sunday-maintenance is attached to the team = linux policy, and a running stress test under the silence produces a Firing alert but no new email.
10Snapshot graf01
Run this on your laptop after expiring the silence in the UI:
VBoxManage snapshot graf01 take alertingYou should see this (your UUID will differ):
0%...10%...20%...30%...40%...50%...60%...70%...80%...90%...100%
Snapshot taken. UUID: 1a6f3d92-7c4e-4b05-8e3a-d29b5c0f7e61✅ Checkpoint: graf01 has a snapshot called alerting and no active silences remain.
Break It, Then Fix It
These three cause most “why didn’t I get the alert?” and “why did I get this strange alert?” questions. Put each one back before starting the next.
1SMTP not configured
Run this on graf01:
sudo sed -i '/^\[smtp\]/,/^\[/ s/^enabled = true/enabled = false/' /etc/grafana/grafana.ini
sudo systemctl restart grafana-serverNow open the team-email contact point and click Test.
You’ll get this error:
Test notification failed
SMTP not configured, check your grafana.ini config file's [smtp] sectionGrafana refuses to send email at all when [smtp] enabled is false, which is the default after a fresh install. Real firing alerts fail the same way, and the reason shows in journalctl -u grafana-server and on the contact point’s health indicator. At work the variants are a wrong host or port (connection refused), or a relay that needs TLS and a password.
Fix:
sudo sed -i '/^\[smtp\]/,/^\[/ s/^enabled = false/enabled = true/' /etc/grafana/grafana.ini
sudo systemctl restart grafana-server✅ Checkpoint: Test on team-email says “Test notification sent successfully” again.
2An alert called DatasourceNoData
A colleague “fixes the spelling” in the High CPU query to the American form. Edit the rule, change the query to instance:node_cpu_utilization:rate5m{job="node"}, set Alert state if no data to No Data (the default for new rules) and save. Wait two minutes.
You’ll get this in Mailpit:
oncall@lab.local | [FIRING] DatasourceNoData on (warning)The recording rule from Lesson 9 is spelt utilisation, so the new name matches no series and the query returns nothing. With No Data handling set to No Data, Grafana raises a separate alert named DatasourceNoData carrying the rule’s labels, which is why it reached the team policy, and its subject has no instance because an empty result has no series labels. Stopping Prometheus would give the cousin of this alert, DatasourceError, from the error setting.
Fix:
Put the query back to instance:node_cpu_utilisation:rate5m{job="node"} and decide no-data handling on purpose: Normal for “how high is it” rules like CPU, Alerting for “is it there at all” rules like node down. Click Preview on the query before saving any rule; an empty preview is the warning sign.
✅ Checkpoint: High CPU shows two Normal instances again and a RESOLVED email arrives for DatasourceNoData.
3Critical alerts land in the catch-all mailbox
Edit the Node down rule and change its label to team = Linux (capital L), save, then stop node_exporter on app01 again.
Run this on app01, then the check on graf01 two minutes later:
sudo systemctl stop node_exporter
# on graf01:
curl -s localhost:8025/api/v1/messages | jq -r '.messages[0] | "\(.To[0].Address) | \(.Subject)"'You’ll get this:
noc-catchall@lab.local | [FIRING:1] SaatVedha Lab Node down (app01:9100 node critical Linux)Label matching is case-sensitive, so team=Linux doesn’t match the team = linux policy and the alert falls through to the default policy: wrong mailbox, and the default subject because only team-email uses your template. Nothing is “broken” from Grafana’s side, which is why this mistake survives for weeks. Preview routing on the rule form shows the default policy straight away.
Fix:
Change the label back to team = linux, run Preview routing to confirm team-email, and start node_exporter on app01. If you have many rules, the policy page shows how many alert instances each policy currently matches, which makes a policy that matches nothing easy to spot.
✅ Checkpoint: Preview routing for Node down shows team = linux, and the next test sends to oncall@lab.local.
This happened at work
Month-end at the insurance office
A friend who runs the monitoring team at an insurance company in Mumbai told me this. During the month-end renewal batch, the policy database server ran out of disk at 1:40 am, the batch job stopped, and the morning shift found 30,000 renewals unprocessed. The disk alert had existed for a year and had fired at 11 pm, two and a half hours earlier.
The on-call engineer swore no email came, and the first suspicion was the mail relay, so they spent the morning reading relay logs that showed nothing wrong. Then someone checked the catch-all mailbox, which the NOC had stopped reading months ago, and found the alert there. A week earlier the database team had cleaned up labels in their rules and written team=DBA where the policy matched team=dba.
They cleared space and re-ran the batch by noon, with an apology email to customers. Afterwards the team made three changes: label values in rules came from a short agreed list in the runbook, every new or edited rule needed a Preview routing screenshot in the change ticket, and the default policy now sent to the NOC’s real on-call channel, so an unmatched alert was loud instead of lost.
Common mistakes and troubleshooting
| Mistake | What happens | What to do instead |
|---|---|---|
| Leaving [smtp] disabled after install | Contact point tests fail with SMTP not configured and no alert email is sent | Set enabled, host and from_address in [smtp] and test every contact point |
| Pending period of zero on noisy metrics | One spike fires an alert and the team learns to ignore them | Use a pending period of a few evaluation intervals, 2m to 5m for CPU |
| Using the same no-data setting for every rule | CPU rules fire DatasourceNoData during scrape gaps, or node-down rules stay silent when a job is deleted | Normal for “how much” rules, Alerting for “is it alive” rules |
| Inconsistent label case or spelling | Alerts fall through to the default policy and the wrong people get them | Keep an agreed list of label values and use Preview routing on every rule |
| Pointing the default policy at a mailbox nobody reads | Unmatched alerts are lost quietly | Send the default policy somewhere loud and fix rules that land there |
| Silencing with a wide matcher and a long duration | Real incidents are hidden long after the maintenance ends | Match on the exact instance, keep durations short and add a comment |
| Grouping by every label | One email per alert instance during an outage, hundreds of messages | Group by alertname plus one or two useful labels such as instance or cluster |
Interview questions
Click a question to open it. Each one is written the way an interviewer would ask it. Under it you will see why they ask it and one way you could answer, in your own words.
Fresher level
1. What is the difference between a pending alert and a firing alert in Grafana?
Why they ask this: A basic state question every on-call engineer should answer.
How you might answer: Pending means the condition is true but hasn’t stayed true for the rule’s pending period yet, so no notification goes out. Firing means it stayed true for the whole pending period, and Grafana hands it to the Alertmanager to be routed and sent.
In our lab the CPU rule needs 2 minutes above 80 percent, so a 30 second spike only shows as Pending and then goes back to Normal.
2. How does Grafana decide where an alert notification goes?
Why they ask this: They check that you understand label-based routing.
How you might answer: Through the notification policy tree. Each policy has label matchers, and the alert goes to the deepest policy whose matchers fit its labels, using that policy’s contact point, grouping and timers.
If nothing matches, the default policy handles it. I check this with Preview routing on the rule before saving.
2–5 years experience
3. An alert rule keeps sending emails called DatasourceNoData. What is happening and what do you change?
Why they ask this: They want to see whether you understand no-data handling.
How you might answer: The rule’s query is returning no series, either because the metric name or labels are wrong, the data source has a gap, or the target vanished. With no-data handling set to No Data, Grafana raises a DatasourceNoData alert carrying the rule’s labels.
I first run the query in Explore over the same range to see why it’s empty, then set no-data handling deliberately: Normal for threshold rules like CPU, Alerting for availability rules like node down.
4. How would you stop alerts during a planned weekly maintenance window but not during unplanned outages?
Why they ask this: They check you know time intervals versus silences.
How you might answer: For a repeating window I create a time interval, for example Sunday 02:00 to 04:00 Asia/Kolkata, and attach it as a mute timing to the policies for those systems. Rules keep evaluating, only notifications are held.
For a one-off change I use a silence that matches the exact instances with a short duration and a comment, so it expires on its own.
Senior level
5. You are moving 300 Prometheus alert rules into Grafana alerting. How do you keep routing reliable?
Why they ask this: They are checking design and governance at scale.
How you might answer: I’d define a small label schema first, like team, severity and service, with fixed lowercase values, and build the policy tree on those labels only. Rules and policies would be provisioned from Git through files or Terraform, so changes are reviewed and a linter can reject unknown label values.
The default policy goes to a monitored channel, and a dashboard shows alerts that hit the default policy, which should stay at zero. For each team we test routing with a synthetic rule before cutting over.
6. How do you prevent alert fatigue for a team that gets 200 emails a night?
Why they ask this: They want practical noise-reduction steps, not theory.
How you might answer: I’d look at which rules fire most and whether anyone acts on them, then delete or downgrade the ones nobody acts on. For the rest I’d add sensible pending periods, recovery thresholds, and group by alertname and service instead of per instance.
Warning-level alerts can go to a channel or a daily summary, with only critical ones paging. A weekly review of the noisiest rules keeps it from creeping back.
Quick quiz
Q1. What decides how long a condition must stay true before an alert fires?
- The repeat interval
- The pending period
- The group wait
- The evaluation group name
Show answer
B — The pending period is how long the condition must hold before Pending becomes Firing.
Q2. Which grafana.ini section must be enabled for email contact points to work in Grafana OSS?
- [server]
- [security]
- [smtp]
- [alerting]
Show answer
C — Email needs [smtp] enabled with a host; otherwise you get SMTP not configured.
Q3. A rule’s query returns no series and no-data handling is set to No Data. What appears?
- Nothing at all
- An alert named DatasourceNoData
- An alert named DatasourceError
- The rule is paused
Show answer
B — Grafana creates a DatasourceNoData alert that carries the rule’s labels.
Q4. An alert has label team=Linux and a policy matches team = linux. Where does it go?
- To the team = linux policy
- To the default policy
- Nowhere, it is dropped
- To every policy
Show answer
B — Matchers are case-sensitive, so it falls through to the default policy.
Q5. What is the difference between a silence and a mute timing (time interval)?
- There is none
- A silence is a one-off by label; a time interval repeats on a schedule for a policy
- A silence stops rule evaluation
- A time interval deletes alerts
Show answer
B — Silences are temporary and label-based; time intervals are recurring windows attached to policies.
Quick recap
- Mailpit on graf01 catches Grafana email on 127.0.0.1:1025 with a web inbox on port 8025, after [smtp] is enabled in grafana.ini.
- High CPU and Node down rules live in folder SaatVedha Lab, group linux-1m, with labels team=linux and a severity.
- The default policy sends to catch-all; the team = linux child policy sends to team-email with a custom subject template.
- No-data and error handling create DatasourceNoData and DatasourceError alerts; choose the setting per rule type.
- Time intervals mute on a schedule, silences mute one-offs, and Preview routing catches label mistakes before they bite.
Next lesson
Lesson 12: Users, teams, organisations and permissions in Grafana → You create a viewer and an editor, put them in a team, lock folders down with permissions and automate with a service account token.
Further reading: Grafana alerting
Want to go deeper into Grafana alerting? Grafana’s docs on creating Grafana-managed rules, notification policies, notification templates and rule evaluation and states go deeper, and Mailpit’s documentation covers its options. For alerting on the Prometheus side, see Prometheus alerting rules and Alertmanager.
You can also see the full plan for this course on the Grafana Dashboards and Observability course page.
