Prometheus alerting rules
-
Phase 1: Prometheus foundations and setup
-
Phase 2: Collect, query and store metrics
-
Phase 3: Alerts and dashboards
Prometheus alerting rules are where your metrics start to earn their keep. Until now you’ve collected numbers, queried them and pre-computed the heavy ones, but nobody gets told when node01 dies at 2 am. In this lesson you write four alerts that most Linux teams run in some form (host down, high CPU, low memory, disk filling up), watch them move from pending to firing on your own lab, and unit-test them with promtool so a typo never reaches the server.
Prometheus itself only decides that an alert is firing. Sending the email is Alertmanager’s job, which is Lesson 9, so today you’ll see alerts on the Alerts page and through the HTTP API.
Where this lesson fits
Lesson 8 of 10 in Prometheus Monitoring · Phase 3: Alerts and dashboards · Before this: Lesson 7, recording rules · Next: Lesson 9, Alertmanager and email
| Time | You need | By the end you can |
|---|---|---|
| About 90 minutes | prom01 and node01 from the earlier lessons, Prometheus 3.16 running as a service, node_exporter on both VMs and the recording rules from Lesson 7 | Four working alert rules in /etc/prometheus/rules/alerts.yml, tested with promtool test rules, and an InstanceDown alert you fired yourself |
What it is, in one line
An alerting rule is a PromQL query that Prometheus runs on a timetable, and when it returns results for long enough, each result becomes a firing alert with labels and a message.
In Simple Words
The pressure cooker whistle
In most Indian kitchens nobody stands and stares at the pressure cooker. You set it on the flame, go and chop onions, and the whistle tells you when something needs your attention. A good cook also learns not to jump at the first hiss of steam, because one short hiss means nothing and only a proper whistle means the dal is ready.
An alerting rule is that whistle. The query is the steam you’re watching, the for time is the cook waiting to be sure, and the alert is the whistle that makes someone walk back to the stove.
Engineer's View
Inside an alerting rule
Alerting rules live in rule files, inside groups, next to recording rules. Prometheus loads every file matched by rule_files in prometheus.yml and evaluates each group every evaluation_interval (15 seconds in our lab), unless the group sets its own interval. Each evaluation runs the rule’s expr as an instant query, and every series in the result is one alert, so a single rule can produce one alert per instance.
| Field | What it does | In our lab |
|---|---|---|
| alert | Name of the alert, stored as the alertname label | InstanceDown |
| expr | PromQL; any series it returns is an active alert | up{job=”node”} == 0 |
| for | How long the condition must hold before pending turns into firing | 1m |
| keep_firing_for | How long to keep firing after the condition clears, to stop flapping | 2m |
| labels | Extra labels added to the alert, used later for routing | severity: critical |
| annotations | Human text, built with Go templates such as {{ $labels.instance }} and {{ $value }} | summary, description |
An alert has three states: inactive (the query returns nothing for it), pending (it returns something, but the for time hasn’t passed) and firing. Prometheus records each active alert in a synthetic series called ALERTS with an alertstate label, and since version 2.4 it also keeps ALERTS_FOR_STATE so a restart doesn’t reset the for timer. Firing alerts are sent to Alertmanager again and again on every evaluation while they stay active, and once more as resolved when they clear.
How it works, step by step
1The query runs on every evaluation
Every 15 seconds the rule manager runs up{job="node"} == 0. While both exporters answer, up is 1 for both, the comparison filters them out and the result is empty, so the alert is inactive. If node01 stops answering, the next scrape writes up=0 for 192.168.56.61:9100 and the next evaluation returns that one series.
2Pending, then firing
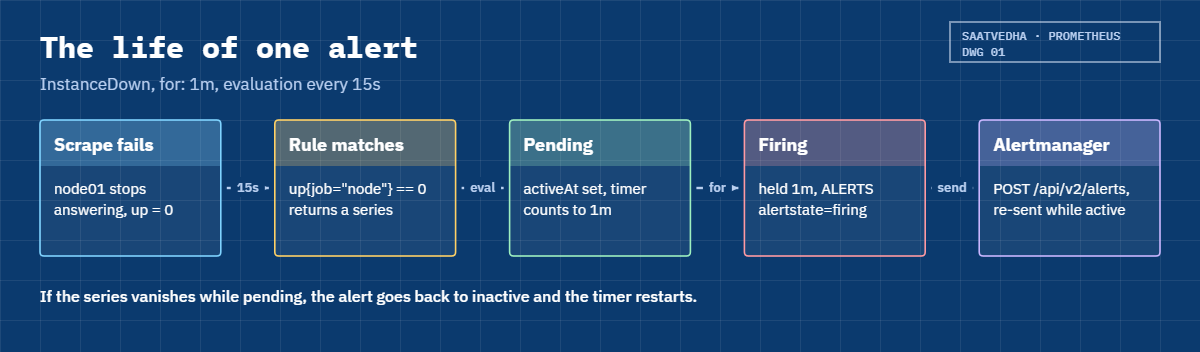
The first evaluation that returns a series puts that alert into pending and remembers the time (activeAt). Each later evaluation checks whether the series is still there. When it has been there for the whole for duration the alert becomes firing; if it disappears even once while pending, the alert drops back to inactive and the timer starts again next time.
The diagram below shows the full life of one alert.
3Labels and annotations are filled in
The alert carries every label of the series the query returned (instance, job and our role label), plus alertname and whatever you put under labels. Annotations are templates, rendered on each evaluation, so {{ $labels.instance }} becomes 192.168.56.61:9100 and {{ $value }} becomes the number the query returned for that series.
Be careful about what you aggregate away. avg by (instance) keeps only the instance label, and then {{ $labels.job }} is empty in the message and routing on job later won’t work. That’s why our CPU rule uses avg by (instance, job).
4Firing alerts go to Alertmanager
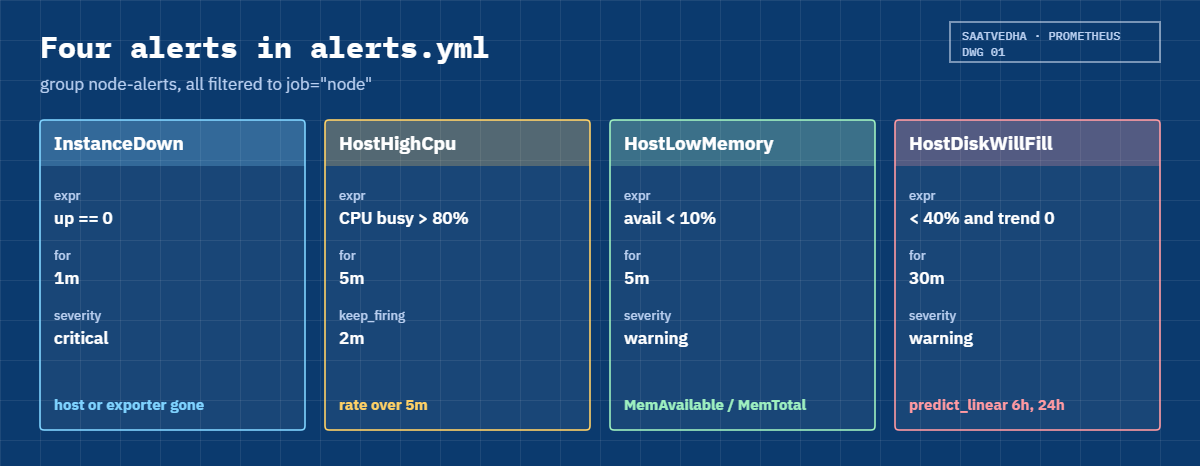
Once an alert fires, Prometheus posts it to every Alertmanager listed under alerting in prometheus.yml, and keeps re-sending it while it’s active. Alertmanager deduplicates, groups and routes it, which is why you never put email addresses or Slack channels in an alerting rule. The cards below show how the four rules you’ll write today fit together.
5Choosing for, keep_firing_for and thresholds
The for time is a trade-off between speed and noise. A 1 minute for on InstanceDown is common because a host that misses four scrapes in a row is almost certainly gone, while CPU at 90% for 30 seconds during a cron job is normal, so HostHighCpu waits 5 minutes. A disk prediction needs half an hour of steady trend before anyone should be woken up.
keep_firing_for handles the other side. When CPU dances between 79% and 81%, the alert would fire, resolve and fire again, sending a mail each time. With keep_firing_for: 2m the alert stays firing until the condition has been false for two minutes, so one bad stretch is one notification.
Combining both with a sensible threshold (alert at 80%, not at 50%) is how you avoid the flapping that teaches people to ignore alerts.
| Alert | Condition | for | Severity |
|---|---|---|---|
| InstanceDown | up{job=”node”} == 0 | 1m | critical |
| HostHighCpu | CPU busy above 80%, averaged over 5 minutes | 5m (keep_firing_for 2m) | warning |
| HostLowMemory | MemAvailable below 10% of MemTotal | 5m | warning |
| HostDiskWillFillIn24h | Root filesystem under 40% free and predict_linear says zero within 24 hours | 30m | warning |
Hands-on lab: four alerts on prom01, fired and unit-tested
Before you run any command, double-check it
Read every command twice before you press Enter. Check the target: the server name, the user, the disk or device name, the path and the sizes. These commands are for learning and were tested in our lab, not on your system. At work, run the read-only commands first, follow your change process, make sure a backup exists, and ask a second person to check anything that changes or deletes data. You run them at your own risk.
All commands run on prom01 unless the step says node01. Your Prometheus already loads /etc/prometheus/rules/*.yml from Lesson 7, so you’ll add a second file next to recording.yml and reload. If jq isn’t installed yet, run sudo apt install -y jq first.
1Check the rules folder and the rule_files line
Run this:
ls -l /etc/prometheus/rules/
grep -A2 rule_files /etc/prometheus/prometheus.yml
grep evaluation_interval /etc/prometheus/prometheus.ymlYou should see this (your dates will differ):
total 8
-rw-r--r-- 1 prometheus prometheus 816 Nov 8 09:41 recording.yml
-rw-r--r-- 1 root root 1005 Nov 8 09:52 recording_test.yml.test
rule_files:
- /etc/prometheus/rules/*.yml
evaluation_interval: 15sThe glob means any new .yml file in that folder is picked up on the next reload, with no change to prometheus.yml. The 15 second evaluation interval is the clock your for times are measured against.
✅ Checkpoint: recording.yml (and its .test file from Lesson 7) is in /etc/prometheus/rules and rule_files points at /etc/prometheus/rules/*.yml.
2Write the four alerting rules
Paste this whole block:
sudo tee /etc/prometheus/rules/alerts.yml >/dev/null <<'EOF'
groups:
- name: node-alerts
rules:
- alert: InstanceDown
expr: up{job="node"} == 0
for: 1m
labels:
severity: critical
annotations:
summary: "Instance {{ $labels.instance }} is down"
description: "{{ $labels.instance }} (job {{ $labels.job }}) has not answered scrapes for more than 1 minute."
- alert: HostHighCpu
expr: 100 * (1 - avg by (instance, job) (rate(node_cpu_seconds_total{job="node",mode="idle"}[5m]))) > 80
for: 5m
keep_firing_for: 2m
labels:
severity: warning
annotations:
summary: "High CPU on {{ $labels.instance }}"
description: "CPU use is {{ $value | humanize }}% on {{ $labels.instance }} for 5 minutes."
- alert: HostLowMemory
expr: node_memory_MemAvailable_bytes{job="node"} / node_memory_MemTotal_bytes{job="node"} < 0.10
for: 5m
labels:
severity: warning
annotations:
summary: "Low memory on {{ $labels.instance }}"
description: "Only {{ $value | humanizePercentage }} of memory is available on {{ $labels.instance }}."
- alert: HostDiskWillFillIn24h
expr: |
node_filesystem_avail_bytes{job="node",mountpoint="/"} / node_filesystem_size_bytes{job="node",mountpoint="/"} < 0.40
and
predict_linear(node_filesystem_avail_bytes{job="node",mountpoint="/"}[6h], 24 * 3600) < 0
for: 30m
labels:
severity: warning
annotations:
summary: "Disk on {{ $labels.instance }} will fill within 24 hours"
description: "{{ $labels.mountpoint }} on {{ $labels.instance }} has {{ $value | humanizePercentage }} left and is filling fast."
EOF
sudo chown prometheus:prometheus /etc/prometheus/rules/alerts.yml
promtool check rules /etc/prometheus/rules/alerts.ymlYou should see this:
Checking /etc/prometheus/rules/alerts.yml
SUCCESS: 4 rules found
A few details are worth reading slowly. The disk rule puts the “less than 40% free” part first, so {{ $value }} is the free ratio, which humanizePercentage turns into “26%”. The and keeps only filesystems that are both low and trending to zero, so a big empty disk with a temporary burst of writes stays quiet.
In the memory rule $value is a ratio too (0.05), and humanize in the CPU rule prints a plain number like 92.34.
If your Lesson 7 rule for instance:node_cpu_utilisation:rate5m keeps the job label, you can write HostHighCpu as instance:node_cpu_utilisation:rate5m{job="node"} > 0.8. Alerting on recorded series is common at work because the heavy maths runs once; we keep the raw query here so the lesson works on its own.
✅ Checkpoint: promtool reports SUCCESS: 4 rules found for alerts.yml.
3Reload Prometheus and confirm the rules loaded
Run this:
curl -s -X POST http://localhost:9090/-/reload
curl -s http://localhost:9090/api/v1/rules?type=alert | jq -c '.data.groups[].rules[] | {name, health, state, duration, keepFiringFor}'You should see this:
{"name":"InstanceDown","health":"ok","state":"inactive","duration":60,"keepFiringFor":0}
{"name":"HostHighCpu","health":"ok","state":"inactive","duration":300,"keepFiringFor":120}
{"name":"HostLowMemory","health":"ok","state":"inactive","duration":300,"keepFiringFor":0}
{"name":"HostDiskWillFillIn24h","health":"ok","state":"inactive","duration":1800,"keepFiringFor":0}The reload prints nothing when it works. duration is the for time in seconds, and health: ok means the last evaluation ran without a query error. Open https://prom01.lab/alerts in your browser (through the Nginx proxy from Lesson 3) and you’ll see the group node-alerts with four green inactive rules; Status > Rule health shows the same rules with their last evaluation time.

✅ Checkpoint: All four alerting rules show health ok and state inactive.
4Fire InstanceDown by stopping node_exporter on node01
Run this on node01:
sudo systemctl stop node_exporterThen run this on prom01 a few times over the next two minutes:
curl -s http://localhost:9090/api/v1/alerts | jq -c '.data.alerts[] | {alert: .labels.alertname, instance: .labels.instance, state, activeAt}'In the first 15 to 30 seconds you should see this (your times will differ):
{"alert":"InstanceDown","instance":"192.168.56.61:9100","state":"pending","activeAt":"2026-11-08T04:41:21.583359519Z"}And about a minute later:
{"alert":"InstanceDown","instance":"192.168.56.61:9100","state":"firing","activeAt":"2026-11-08T04:41:21.583359519Z"}In my run the exporter stopped at 04:41:17, the scrape failed and the rule went pending at 04:41:21, and it turned to firing at about 04:42:21, one minute later as for: 1m asks. activeAt doesn’t change when the state moves to firing, because it records when the condition first became true. On the Alerts page the rule turns yellow for pending, then red for firing.
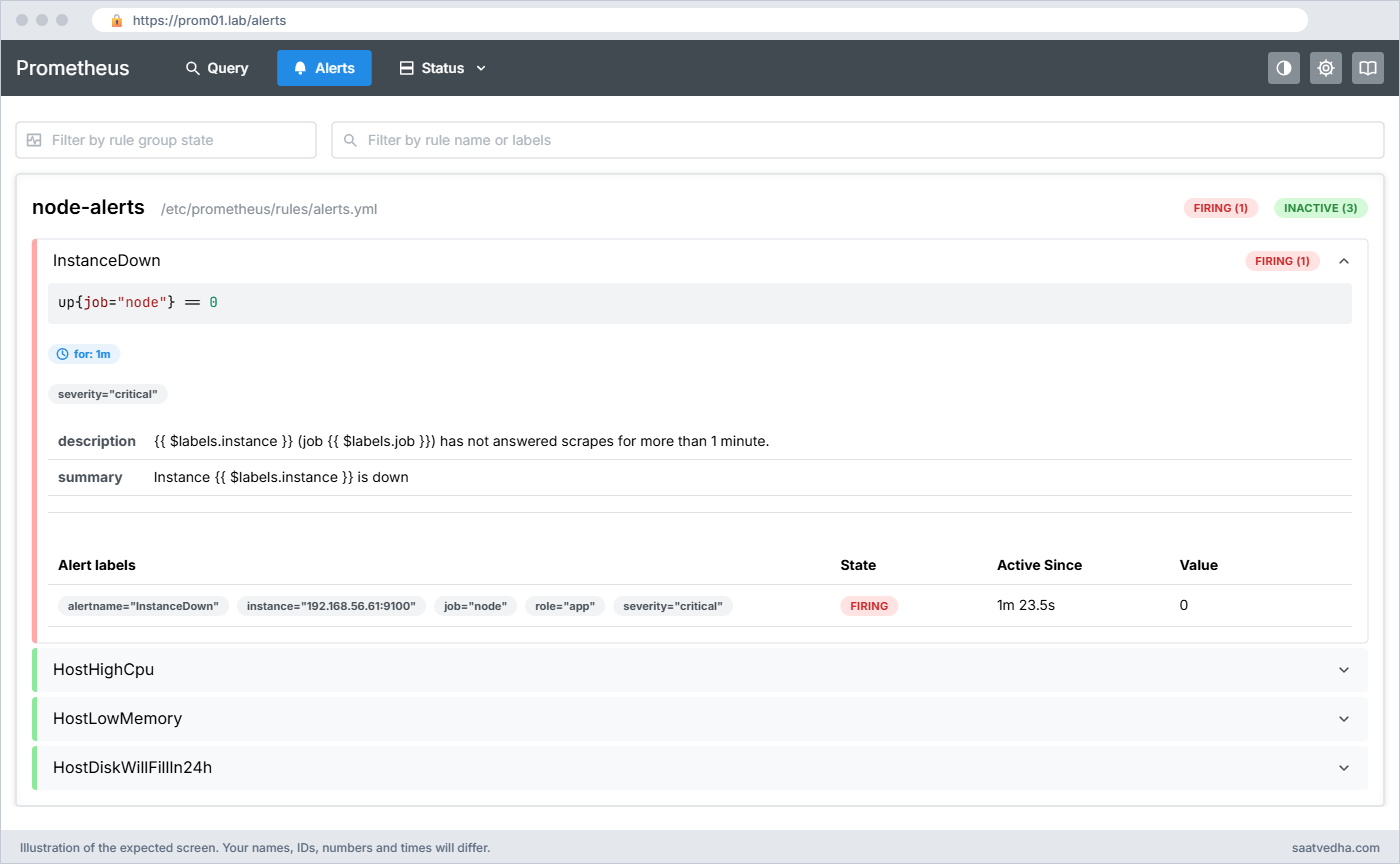
✅ Checkpoint: InstanceDown for 192.168.56.61:9100 went pending, then firing about a minute later.

5Read the full alert and the ALERTS series
Run this:
curl -s http://localhost:9090/api/v1/alerts | jq '.data.alerts[] | select(.labels.alertname=="InstanceDown")'
curl -s http://localhost:9090/api/v1/query --data-urlencode 'query=ALERTS' | jq -c '.data.result[].metric'You should see this (your activeAt time will differ):
{
"labels": {
"alertname": "InstanceDown",
"instance": "192.168.56.61:9100",
"job": "node",
"role": "app",
"severity": "critical"
},
"annotations": {
"description": "192.168.56.61:9100 (job node) has not answered scrapes for more than 1 minute.",
"summary": "Instance 192.168.56.61:9100 is down"
},
"state": "firing",
"activeAt": "2026-11-08T04:41:21.583359519Z",
"value": "0e+00"
}
{"__name__":"ALERTS","alertname":"InstanceDown","alertstate":"firing","instance":"192.168.56.61:9100","job":"node","role":"app","severity":"critical"}The alert kept role="app" from the scrape config and gained severity="critical" from the rule; Lesson 9 routes on those labels. value is 0 because that’s what up returned. ALERTS is a normal series, so you can graph ALERTS{alertstate="firing"} to see when alerts fired over the last week.
✅ Checkpoint: The annotations show the real instance address and ALERTS has a firing series for InstanceDown.
6Bring node01 back and watch the alert resolve
Run this on node01, then the query on prom01 after 30 seconds:
sudo systemctl start node_exporter
# on prom01:
curl -s http://localhost:9090/api/v1/alerts | jq '.data.alerts | length'You should see this:
0As soon as the next scrape succeeds, up is 1, the query returns nothing and the alert disappears from the active list. Prometheus sends Alertmanager a final copy with an end time so it can mail a “resolved” message, which you’ll see in Lesson 9.
✅ Checkpoint: No active alerts remain and the node target is UP again.
7Push CPU on node01 and watch HostHighCpu
Run this on node01:
sudo apt install -y stress-ng
stress-ng --cpu 1 --timeout 12mAnd this on prom01 every minute or so:
curl -s http://localhost:9090/api/v1/alerts | jq -c '.data.alerts[] | {alert: .labels.alertname, state, value, d: .annotations.description}'You should see this (your values and times will differ):
{"alert":"HostHighCpu","state":"pending","value":"8.005614035087719e+01","d":"CPU use is 80.06% on 192.168.56.61:9100 for 5 minutes."}
...
{"alert":"HostHighCpu","state":"firing","value":"9.999122807017544e+01","d":"CPU use is 99.99% on 192.168.56.61:9100 for 5 minutes."}node01 has one vCPU, so one stress worker takes it to about 100%. Because the rule uses rate(...[5m]), the average climbs slowly and crosses 80% after a few minutes; then for: 5m adds five more, so expect firing roughly 8 to 10 minutes after you start. When stress-ng stops, the alert stays firing for another 2 minutes because of keep_firing_for.
If you’re short of time, change for: 5m to for: 1m for the test and put it back afterwards.
✅ Checkpoint: HostHighCpu fired for 192.168.56.61:9100 with a description showing a CPU number above 80.
8Unit-test the alerts with promtool test rules
Testing by stopping services is fine in a lab, but you can’t wait ten minutes for every change at work. promtool test rules feeds made-up series into your rules on a fake clock and checks which alerts fire, with which labels and text.
Paste this whole block:
sudo mkdir -p /etc/prometheus/tests
sudo tee /etc/prometheus/tests/alerts_test.yml >/dev/null <<'EOF'
rule_files:
- ../rules/alerts.yml
evaluation_interval: 1m
tests:
# 1. node01 stops answering at minute 2
- interval: 1m
input_series:
- series: 'up{job="node", instance="192.168.56.61:9100"}'
values: '1 1 0 0 0 0'
alert_rule_test:
- eval_time: 2m
alertname: InstanceDown
exp_alerts: []
- eval_time: 4m
alertname: InstanceDown
exp_alerts:
- exp_labels:
severity: critical
job: node
instance: 192.168.56.61:9100
exp_annotations:
summary: "Instance 192.168.56.61:9100 is down"
description: "192.168.56.61:9100 (job node) has not answered scrapes for more than 1 minute."
# 2. memory drops from 50% to 5% available at minute 11
- interval: 1m
input_series:
- series: 'node_memory_MemAvailable_bytes{job="node", instance="192.168.56.61:9100"}'
values: '500000000x10 50000000x10'
- series: 'node_memory_MemTotal_bytes{job="node", instance="192.168.56.61:9100"}'
values: '1000000000x20'
alert_rule_test:
- eval_time: 14m
alertname: HostLowMemory
exp_alerts: []
- eval_time: 17m
alertname: HostLowMemory
exp_alerts:
- exp_labels:
severity: warning
job: node
instance: 192.168.56.61:9100
exp_annotations:
summary: "Low memory on 192.168.56.61:9100"
description: "Only 5% of memory is available on 192.168.56.61:9100."
# 3. root disk on node01 loses 5 MB every minute (about 7 GB a day)
- interval: 1m
input_series:
- series: 'node_filesystem_avail_bytes{job="node", instance="192.168.56.61:9100", mountpoint="/", fstype="ext4", device="/dev/sda2"}'
values: '6000000000-5000000x480'
- series: 'node_filesystem_size_bytes{job="node", instance="192.168.56.61:9100", mountpoint="/", fstype="ext4", device="/dev/sda2"}'
values: '15000000000x480'
alert_rule_test:
- eval_time: 7h
alertname: HostDiskWillFillIn24h
exp_alerts:
- exp_labels:
severity: warning
job: node
instance: 192.168.56.61:9100
mountpoint: /
fstype: ext4
device: /dev/sda2
exp_annotations:
summary: "Disk on 192.168.56.61:9100 will fill within 24 hours"
description: "/ on 192.168.56.61:9100 has 26% left and is filling fast."
EOF
cd /etc/prometheus/tests && promtool test rules alerts_test.ymlYou should see this:
Processing test file: alerts_test.yml
SUCCESS
The values strings are shorthand: 500000000x10 means that value 11 times (the first plus 10 repeats), and 6000000000-5000000x480 starts at 6 GB and drops 5 MB a minute. In test 1, up goes to 0 at minute 2, so at minute 2 the alert is only pending (and pending alerts don’t count in exp_alerts), and at minute 4 it’s firing. In test 3 the disk is below 40% free after a few hours, and after 30 more minutes of the 6 hour trend pointing below zero the alert fires with 26% left.
✅ Checkpoint: promtool test rules prints SUCCESS for all three test groups.
Break It, Then Fix It
Three mistakes that every team makes with alerting rules sooner or later. Take a VirtualBox snapshot of prom01 first if you like; all three are easy to undo.
1A typo in an annotation template
British and Indian spelling sneaks into templates all the time. Change humanize to humanise in the HostHighCpu description, then check and reload:
Run this:
sudo sed -i 's/$value | humanize }}%/$value | humanise }}%/' /etc/prometheus/rules/alerts.yml
promtool check rules /etc/prometheus/rules/alerts.yml
curl -s -X POST http://localhost:9090/-/reload
sudo journalctl -u prometheus -n 4 --no-pagerYou’ll get this error:
Checking /etc/prometheus/rules/alerts.yml
FAILED:
/etc/prometheus/rules/alerts.yml: group "node-alerts", rule 2, "HostHighCpu": annotation "description": template: __alert_HostHighCpu:1: function "humanise" not defined
failed to reload config: one or more errors occurred while applying the new configuration (--config.file="/etc/prometheus/prometheus.yml")
... level=ERROR source=manager.go:286 msg="loading groups failed" component="rule manager" err="/etc/prometheus/rules/alerts.yml: group \"node-alerts\", rule 2, \"HostHighCpu\": annotation \"description\": template: __alert_HostHighCpu:1: function \"humanise\" not defined"
... level=ERROR source=main.go:1772 msg="Failed to apply configuration" err="error loading rules, previous rule set restored"Templates are parsed when the file loads, so an unknown function name fails the whole file. Prometheus keeps the previous rules running (“previous rule set restored”), which is kind, but also dangerous: your new alert silently isn’t there, and after a restart Prometheus would refuse to start at all. The Go template functions are American spelled: humanize, humanizePercentage, humanizeDuration.
Fix:
sudo sed -i 's/humanise/humanize/' /etc/prometheus/rules/alerts.yml
promtool check rules /etc/prometheus/rules/alerts.yml && curl -s -X POST http://localhost:9090/-/reload✅ Checkpoint: promtool says SUCCESS: 4 rules found and the reload returns nothing.
2The alert that never fires because of a wrong label
Many guides call the Node Exporter job node_exporter, and people copy rules between setups. Make InstanceDown look for that job name and run the unit test:
Run this:
sudo sed -i 's/up{job="node"} == 0/up{job="node_exporter"} == 0/' /etc/prometheus/rules/alerts.yml
promtool check rules /etc/prometheus/rules/alerts.yml
cd /etc/prometheus/tests && promtool test rules alerts_test.ymlYou’ll get this:
Checking /etc/prometheus/rules/alerts.yml
SUCCESS: 4 rules found
Processing test file: alerts_test.yml
FAILED:
alertname: InstanceDown, time: 4m,
exp:[
0:
Labels:{alertname="InstanceDown", instance="192.168.56.61:9100", job="node", severity="critical"}
Annotations:{description="192.168.56.61:9100 (job node) has not answered scrapes for more than 1 minute.", summary="Instance 192.168.56.61:9100 is down"}
],
got:[]
check rules is happy because the query is valid PromQL that matches nothing. On the live server the rule would sit green and inactive forever, even with node01 switched off, which is the worst kind of alert. Paste the expression into the Query page and you get an empty result, while up on its own shows the real label is job="node".
The same thing happens when for is longer than the outages you get: a for: 30m on InstanceDown never fires for a server that reboots in 10 minutes.
Fix:
sudo sed -i 's/up{job="node_exporter"} == 0/up{job="node"} == 0/' /etc/prometheus/rules/alerts.yml
cd /etc/prometheus/tests && promtool test rules alerts_test.yml && curl -s -X POST http://localhost:9090/-/reload✅ Checkpoint: The unit test says SUCCESS again and InstanceDown uses job=”node”.
3A template that passes the check but breaks at run time
Some template errors only show when the alert fires. Feed a label (text) into humanizePercentage, which expects a number:
Run this:
sudo sed -i 's/Only {{ $value | humanizePercentage }}/Only {{ $labels.instance | humanizePercentage }}/' /etc/prometheus/rules/alerts.yml
promtool check rules /etc/prometheus/rules/alerts.yml
cd /etc/prometheus/tests && promtool test rules alerts_test.ymlYou’ll get this (shortened):
Checking /etc/prometheus/rules/alerts.yml
SUCCESS: 4 rules found
Processing test file: alerts_test.yml
FAILED:
alertname: HostLowMemory, time: 17m,
...
got:[
0:
Labels:{alertname="HostLowMemory", instance="192.168.56.61:9100", job="node", severity="warning"}
Annotations:{description="<error expanding template: error executing template __alert_HostLowMemory: template: __alert_HostLowMemory:1:139: executing \"__alert_HostLowMemory\" at <humanizePercentage>: error calling humanizePercentage: strconv.ParseFloat: parsing \"192.168.56.61:9100\": invalid syntax>", summary="Low memory on 192.168.56.61:9100"}
]The file is valid, so the check passes, but when the alert fires the description becomes an ugly <error expanding template ...> string. Without a unit test you’d find out from the on-call engineer’s email at night. This is the strongest reason to keep exp_annotations in your tests and not only labels.
Fix:
sudo sed -i 's/Only {{ $labels.instance | humanizePercentage }}/Only {{ $value | humanizePercentage }}/' /etc/prometheus/rules/alerts.yml
cd /etc/prometheus/tests && promtool test rules alerts_test.yml && curl -s -X POST http://localhost:9090/-/reload✅ Checkpoint: promtool test rules prints SUCCESS and the four rules are healthy on the Alerts page.
This happened at work
The disk alert that cried wolf
My team lead tells this one about a general insurance company in Kolkata, during the March renewal rush. Their policy document server had a disk alert copied from a blog: fire when the root filesystem is more than 80% used, with no for at all. Every night at 1:30 a backup job wrote a 40 GB dump to local disk, pushed usage to 84%, copied the file off and deleted it, so the on-call phone buzzed, and twenty minutes later buzzed again with “resolved”.
After two weeks of this the night shift had made a mail filter for that alert. Then one Friday the copy step failed, the dumps stopped being deleted, and the disk filled on Sunday morning. The alert had fired on Friday night like every night, and nobody looked, because it had fired every night.
Claims uploads failed for about three hours until someone noticed from customer calls.
The fix took one afternoon. They replaced the fixed threshold with a rule like our HostDiskWillFillIn24h: low free space and a predict_linear trend to zero, held for 30 minutes, so a nightly spike that clears never fires. They added unit tests with the backup pattern as input series to prove it stayed quiet, and a separate critical alert at 95% used with for: 5m as the last line of defence.
The mail filter was deleted the same day, which my lead says was the real victory.
Common mistakes and troubleshooting
| Mistake | What happens | What to do instead |
|---|---|---|
| No for on a noisy metric | Short spikes fire and resolve again, people start ignoring the alert | Use for: 5m or more for CPU, memory and disk, and keep_firing_for to calm flapping |
| Aggregating away labels you need | {{ $labels.job }} is empty and Alertmanager can’t route by job | Keep the labels in by (…), for example avg by (instance, job) |
| Copying rules with a different job name | The rule is green and inactive even while hosts are down | Check the expr on the Query page and test with promtool test rules |
| Reloading without promtool check rules | The reload fails, old rules keep running, and a restart later fails completely | Run promtool check rules before every reload, ideally in a Git pipeline |
| Putting the value in a label | Every new value creates a new alert, so you get a flood of alerts and resolves | Keep $value in annotations only; labels must stay stable |
| Alerting only on causes like high CPU | You get pages for busy but healthy servers and miss real user pain | Alert on symptoms (down, errors, full disk soon) and keep cause alerts as warnings |
Interview questions
Click a question to open it. Each one is written the way an interviewer would ask it. Under it you will see why they ask it and one way you could answer, in your own words.
Fresher level
1. What do inactive, pending and firing mean for a Prometheus alert?
Why they ask this: They want to know you understand the for clause and that pending alerts don’t notify anyone.
How you might answer: Inactive means the alert’s expression returns nothing for that series. Pending means it returns a result, but not yet for the whole for duration; in my lab InstanceDown was pending for one minute after I stopped node_exporter.
Firing means it held for the full for time, and only then does Prometheus send it to Alertmanager. If the condition clears while pending, it goes back to inactive and the timer restarts.
2. Where would you put the email address for an alert, in the rule or somewhere else?
Why they ask this: A quick check that you know the split between Prometheus and Alertmanager.
How you might answer: Not in the rule. The rule only adds labels like severity: critical and annotations like summary. Alertmanager matches those labels in its route tree and decides the receiver, so one rule can go to email for one team and Slack for another without changing the rule.
2–5 years experience
3. Your CPU alert sends five emails an hour for the same server. Walk me through how you would fix it.
Why they ask this: They are testing whether you know about flapping and the tools to control it.
How you might answer: First I’d look at the ALERTS series for that alert on a graph to see the pattern; usually CPU is hovering around the threshold. I’d make sure the expression uses a 5 minute rate instead of irate, add or lengthen for, and add keep_firing_for, say 2 minutes, so a dip below 80% doesn’t resolve it.
I’d also check Alertmanager’s group_interval and repeat_interval, and ask whether a warning about CPU should be an email at all or a dashboard item.
4. How do you test alerting rules before they reach production?
Why they ask this: They want to hear promtool, unit tests and a pipeline, not “we wait and see”.
How you might answer: Every change goes through promtool check rules for syntax and template parsing, then promtool test rules with input series that should fire and should stay quiet. I check both exp_labels and exp_annotations, because a template like humanizePercentage on a string only fails at run time.
We run both in CI on every pull request, and only then copy the file and call /-/reload.
Senior level
5. How would you design alerting for 500 servers so that the on-call engineer isn’t buried?
Why they ask this: They are looking for symptom-based alerting, severity levels and routing thinking.
How you might answer: I’d keep pages for things a human must act on now: host or service down, error rate high, disk will fill within hours. Cause-style alerts like high CPU stay as warnings that go to a ticket or chat channel, not the phone.
Rules carry severity and team labels, Alertmanager groups by alertname and cluster so one network problem is one notification, and an InstanceDown inhibits the warnings for the same instance. Every alert has a runbook link in its annotations, and we review noisy alerts in a weekly meeting.
6. Prometheus restarts while an alert with for: 30m has been pending for 25 minutes. What happens?
Why they ask this: They are checking deeper knowledge of ALERTS_FOR_STATE and restore behaviour.
How you might answer: Prometheus stores the active-since time in the ALERTS_FOR_STATE series, so after a restart it restores the pending state instead of starting the 30 minutes again, as long as the data is still within the outage tolerance (one hour by default, set with rules.alert.for-outage-tolerance). There’s also a grace period, rules.alert.for-grace-period, 10 minutes by default, so an alert that was close to firing doesn’t fire the moment Prometheus comes back.
If the restart took longer than the tolerance, the timer starts fresh, which is one reason to keep Prometheus restarts short and to use reload for rule changes.
Quick quiz
Q1. An alert rule has for: 5m. The condition becomes true at 10:00 and stays true. When does it start firing?
- 10:00
- About 10:05
- 10:15
- Only after Alertmanager confirms it
Show answer
B — The alert is pending from 10:00 and becomes firing once the condition has held for 5 minutes, at the first evaluation after 10:05.
Q2. Which command checks that alerts fire with the right labels and annotations on test data?
- promtool check config
- promtool check rules
- promtool test rules
- amtool check-config
Show answer
C — promtool test rules runs input series through the rules on a fake clock and compares the alerts with exp_alerts.
Q3. What does keep_firing_for: 2m do?
- Delays firing by 2 minutes
- Keeps the alert firing for 2 minutes after the condition clears
- Resends the email every 2 minutes
- Silences the alert for 2 minutes
Show answer
B — It holds a firing alert in firing state for the given time after the expression stops returning it, which stops flapping.
Q4. Your rule uses avg by (instance) (…). Why is {{ $labels.job }} empty in the alert text?
- job is a reserved label
- The by clause dropped the job label
- Annotations can’t read labels
- The alert is still pending
Show answer
B — Aggregation keeps only the labels listed in by, so add job to the by list if you need it.
Q5. Where can you see the history of when alerts were firing?
- Only in Alertmanager
- The ALERTS series in Prometheus
- The prometheus.yml file
- The node_exporter /metrics page
Show answer
B — Prometheus writes ALERTS{alertstate=”pending”|”firing”} for active alerts, which you can query and graph like any series.
Quick recap
- An alerting rule is a PromQL query; every series it returns is one alert, carrying that series’ labels plus your own.
- Alerts move from inactive to pending to firing, and for decides how long pending lasts; keep_firing_for stops flapping on the way down.
- Annotations use Go templates such as {{ $labels.instance }}, {{ $value | humanize }} and humanizePercentage, and they can fail at load time or at run time.
- Run promtool check rules before every reload and promtool test rules with both labels and annotations in the expected results.
- Your lab now has InstanceDown, HostHighCpu, HostLowMemory and HostDiskWillFillIn24h in /etc/prometheus/rules/alerts.yml and tests in /etc/prometheus/tests.
Next lesson
Lesson 9: Prometheus Alertmanager: routing alerts to email → You install Alertmanager, connect it to Prometheus and get your InstanceDown alert as a real email in Mailpit, with grouping, silences and inhibition.
Further reading: Prometheus alerting rules
Want to go deeper into Prometheus alerting rules? The official alerting rules page covers every field, the template reference lists functions like humanize, and unit testing for rules explains the promtool test file format. The alerting best practices page is short and worth reading twice.
If you skipped it, Lesson 7 on recording rules shows how to pre-compute the queries these alerts use. You can also see the full plan for this course on the Prometheus Monitoring course page.
