What is Prometheus? Monitoring basics and your lab

What is Prometheus, and why does almost every Linux, DevOps and SRE job advert mention it? In plain terms it’s a program that asks your servers for numbers every few seconds (CPU used, free disk, requests per second, errors) and keeps them so you can draw graphs and raise alerts. This first lesson explains how it thinks, where it fits next to tools you may already know, and then you build the two small VMs you’ll use for the whole course.

You won’t install anything permanent today. At the end you’ll download Prometheus, run it for a few minutes in the foreground and look at its web page, so you can see the thing working before Lesson 2 sets it up properly as a service.

Where this lesson fits

Lesson 1 of 10 in Prometheus Monitoring · Phase 1: Prometheus foundations and setup · Next: Lesson 2, install Prometheus on Ubuntu

TimeYou needBy the end you can
About 75 minutesA laptop with 8 GB RAM, VirtualBox 7, the Ubuntu Server 26.04 LTS ISO (24.04 LTS also works)Explain the Prometheus pull model in an interview, and have prom01 and node01 running and talking to each other

What it is, in one line

Prometheus is a monitoring system that regularly collects numbers from your servers and applications, stores them with a timestamp, and lets you query, graph and alert on them.

In Simple Words

The milkman, the notebook and the neighbour who rings the bell

Think of a housing society where one helper walks to every flat at 7 am and writes down how many milk packets are left in each fridge. He doesn’t wait for people to call him, he goes round on his own every morning, and he writes each number in a notebook next to the date.

After a month the notebook tells a story: flat 302 always runs out on Fridays, and flat 105 stopped answering the door three days ago. If a number crosses a line (zero packets with guests coming), he rings the society secretary, who decides whom to call.

Prometheus is that helper. It visits each server on a timetable, writes the numbers down with the time, and hands trouble to another program (Alertmanager) that decides who gets the message.

Engineer's View

How Prometheus actually works

Prometheus is a single Go binary with a time series database (TSDB) built in. Every target you want to watch exposes an HTTP page, by default at /metrics, in a simple text format. Prometheus pulls (scrapes) that page every scrape_interval (15 seconds is common, the built-in default is 1 minute) and stores each value as a sample: a float64 number plus a millisecond timestamp.

A time series is identified by a metric name plus a set of labels, for example node_filesystem_avail_bytes{instance="node01:9100",mountpoint="/"}. Change any label value and you get a different series, which is why careless labels (user IDs, full URLs) can blow up memory. You query all of this with PromQL, and rules can run PromQL on a schedule to create new series (recording rules) or fire alerts (alerting rules).

PartWhat it doesDefault port
Prometheus serverScrapes targets, stores samples in its local TSDB, runs rules, serves the web UI and HTTP API9090
ExportersSmall programs that turn something (Linux, MySQL, a switch over SNMP) into a /metrics page. Node Exporter covers Linux hosts9100 (Node Exporter)
AlertmanagerReceives firing alerts from Prometheus, groups them, silences them and sends email, Slack, PagerDuty and so on9093
PushgatewayA parking place for short batch jobs that finish before Prometheus could scrape them9091
GrafanaSeparate project that draws dashboards using Prometheus as a data source3000

Prometheus is built for reliability over perfect accuracy. Each server works on its own, with no cluster to fail, and a lost scrape just leaves a small gap. That makes it great for operational metrics and poor for things like per-request billing, where each event has to be counted, and it stores numbers, not log lines.

How it works, step by step

1A target exposes numbers over HTTP

On every machine you want to watch, an exporter listens on a port and answers GET /metrics with plain text. Each line is one series and its current value, with # HELP and # TYPE lines describing it.

# HELP node_load1 1m load average.
# TYPE node_load1 gauge
node_load1 0.18
# HELP node_network_receive_bytes_total Network device statistic receive_bytes.
# TYPE node_network_receive_bytes_total counter
node_network_receive_bytes_total{device="enp0s8"} 4.3189762e+07

A gauge goes up and down (load, free memory). A counter only goes up until the process restarts (bytes received, requests served), and you almost always look at how fast it grows rather than its raw value.

2Prometheus scrapes on a timetable

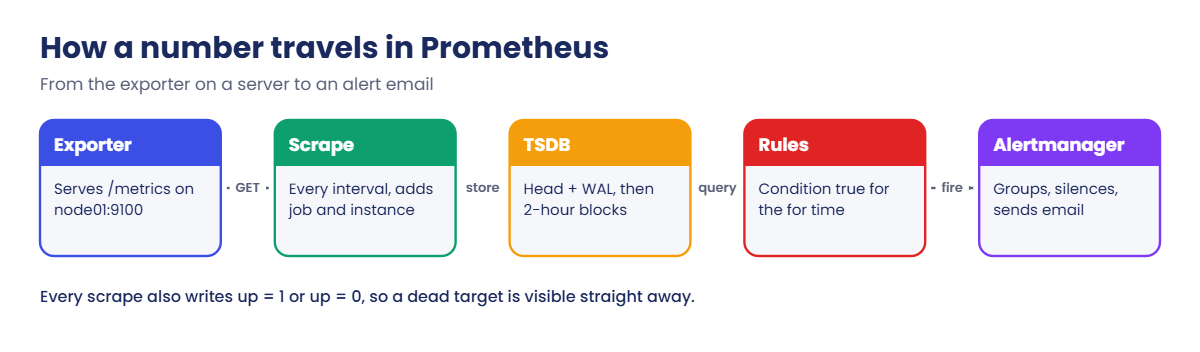
The scrape_configs section of prometheus.yml lists jobs, and each job lists targets. On each interval Prometheus fetches every target’s page, adds the labels job and instance, and also writes a series called up: 1 if the scrape worked, 0 if it failed. The diagram below shows the full path a number takes.

What is Prometheus: how a metric travels from exporter to Alertmanager

3Samples land in the local TSDB

New samples go into an in-memory head block and a write-ahead log (WAL) on disk, so a crash doesn’t lose them. Every two hours the head is cut into a block folder on disk, and older blocks are merged (compacted) and finally deleted when they pass the retention time, 15 days by default. Lesson 6 covers this in detail.

4Rules and queries read the TSDB

The web UI, Grafana and the HTTP API all send PromQL to the server and get series back. In parallel, the rule engine runs your alerting rules every evaluation_interval. When a rule’s condition stays true for its for time, the alert moves from pending to firing and Prometheus pushes it to Alertmanager, which handles the people side.

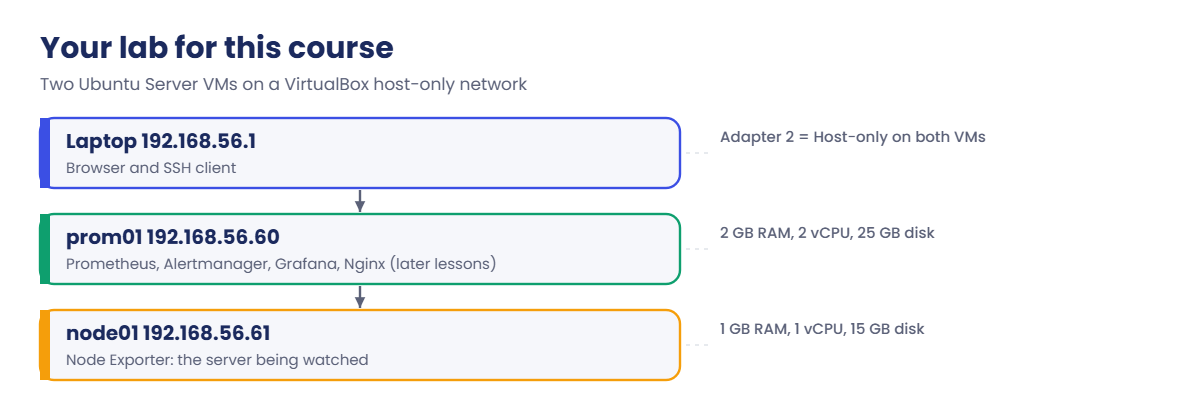
What is Prometheus lab: prom01 and node01 on a VirtualBox host-only network

5Why pull and not push?

With pull, Prometheus knows the list of targets, so a dead server shows up as up == 0 straight away instead of just going quiet. You can also open any target’s /metrics in a browser to see exactly what Prometheus sees, which makes troubleshooting much easier.

Pull has limits too. Prometheus must be able to reach the target over the network, which is awkward through firewalls and NAT, and that’s where Pushgateway, the Prometheus Agent mode or remote write come in for special cases.

QuestionPrometheusZabbix / Nagios style
How data arrivesPulls HTTP /metrics pages (push only for special cases)Agent checks, active or passive, plus SNMP and traps
Data modelMetric name + labels, queried with PromQLHost + item key, triggers per item
ConfigurationYAML files, often kept in GitMostly the web UI and templates in a database
Strong atDynamic setups (containers, Kubernetes), app metrics, flexible queriesClassic server, network and SNMP estates with a GUI
Long-term storageLocal TSDB; Thanos, Mimir or VictoriaMetrics for years of dataSQL database with trends

Hands-on lab: build prom01 and node01 and take Prometheus for a test drive

Before you run any command, double-check it

Read every command twice before you press Enter. Check the target: the server name, the user, the disk or device name, the path and the sizes. These commands are for learning and were tested in our lab, not on your system. At work, run the read-only commands first, follow your change process, make sure a backup exists, and ask a second person to check anything that changes or deletes data. You run them at your own risk.

You’ll build two Ubuntu Server VMs: prom01 (192.168.56.60) will run Prometheus, Alertmanager and Grafana later, and node01 (192.168.56.61) is the server being watched. Each VM gets two network adapters: NAT for the internet and Host-only so the VMs and your laptop can reach each other on fixed addresses.

1Check the VirtualBox host-only network

In VirtualBox Manager open File > Tools > Network Manager, Host-only Networks tab. You should see one adapter with IPv4 address 192.168.56.1 and mask 255.255.255.0. Untick the DHCP server for it, because we’ll give the VMs static addresses.

Where in Network ManagerWhat it should show
Adapter tab: IPv4 Address192.168.56.1
Adapter tab: IPv4 Network Mask255.255.255.0
DHCP Server tab: Enable ServerUnticked

✅ Checkpoint: A host-only network 192.168.56.1/24 exists and its DHCP server is off.

2Create prom01

Click New, name it prom01, pick the Ubuntu Server ISO and tick Skip Unattended Installation so you see the installer. Give it 2048 MB RAM, 2 CPUs and a 25 GB disk. Before you start it, open Settings > Network: Adapter 1 attached to NAT, Adapter 2 enabled and attached to Host-only Adapter.

VMRAMCPUDiskAdapter 1Adapter 2
prom012048 MB225 GBNATHost-only (192.168.56.1 network)
node011024 MB115 GBNATHost-only (192.168.56.1 network)

✅ Checkpoint: prom01 exists with two adapters, NAT and Host-only.

3Install Ubuntu Server

Start the VM and go through the installer with the defaults. Use hostname prom01, user student, and tick Install OpenSSH server. Leave the second network card (enp0s8) as it is for now, we’ll set it with netplan.

When it finishes, remove the ISO, reboot and log in.

Run this:

hostnamectl --static
ip -br addr

You should see:

prom01
lo               UNKNOWN        127.0.0.1/8 ::1/128
enp0s3           UP             10.0.2.15/24 metric 100 fe80::a00:27ff:fe4e:66a1/64
enp0s8           DOWN

enp0s3 is the NAT card with the usual VirtualBox address 10.0.2.15. enp0s8 is the host-only card and has no IPv4 address yet, which is what you fix next. If the installer brought it up, it shows UP with only an fe80:: address, and that’s fine too.

✅ Checkpoint: You are logged in as student on prom01, and enp0s8 is listed.

4Give enp0s8 a static address with netplan

Paste this whole block:

sudo tee /etc/netplan/60-hostonly.yaml >/dev/null <<'EOF'
network:
  version: 2
  ethernets:
    enp0s8:
      dhcp4: false
      addresses: [192.168.56.60/24]
EOF
sudo chmod 600 /etc/netplan/60-hostonly.yaml
sudo netplan apply
ip -br addr show enp0s8

You should see:

enp0s8           UP             192.168.56.60/24 fe80::a00:27ff:fe9b:3c10/64

Netplan files are YAML, so the spaces matter and tabs are not allowed. The chmod 600 stops netplan warning that the file is readable by everyone.

✅ Checkpoint: enp0s8 on prom01 shows 192.168.56.60/24 and state UP.

5Clone node01 and change its identity

Shut prom01 down (sudo poweroff), right-click it and choose Clone. Name the clone node01, choose Generate new MAC addresses for all network adapters and a Full clone, then set its RAM to 1024 MB and 1 CPU. Start node01 only and run:

Run this on node01:

sudo hostnamectl set-hostname node01
sudo sed -i 's/192.168.56.60/192.168.56.61/' /etc/netplan/60-hostonly.yaml
sudo netplan apply
sudo rm -f /etc/machine-id && sudo systemd-machine-id-setup
sudo rm -f /etc/ssh/ssh_host_* && sudo dpkg-reconfigure openssh-server
hostnamectl --static; ip -br addr show enp0s8

You should see this (your key fingerprints will differ):

Initializing machine ID from random generator.
Creating SSH2 RSA key; this may take some time ...
3072 SHA256:/47sCXzFiK9oFNLU02vYP2aO/PaEqoZqB2yMC7FegMs root@node01 (RSA)
Creating SSH2 ECDSA key; this may take some time ...
256 SHA256:dyVpB9jNhP7tKXskZ97bzXsCJMkKPLcb1sLXw95MW+s root@node01 (ECDSA)
Creating SSH2 ED25519 key; this may take some time ...
256 SHA256:0C1YP9uXdpkNpPlGoVRw541YRqwSsjZQ3h+QRCZSY/4 root@node01 (ED25519)
node01
enp0s8           UP             192.168.56.61/24 fe80::a00:27ff:fe1d:72e4/64

A clone carries the same machine ID and SSH host keys as the original. Regenerating them avoids duplicate DHCP leases on the NAT side and SSH “host key changed” warnings later.

✅ Checkpoint: node01 has hostname node01, address 192.168.56.61, and a new machine ID.

6Add both names to /etc/hosts and test

Start prom01 again. On both VMs add the two lines below, then ping across.

Run this on prom01 and on node01:

printf '192.168.56.60 prom01 prom01.lab\n192.168.56.61 node01 node01.lab\n' | sudo tee -a /etc/hosts
ping -c 2 node01

The output on prom01 looks like this:

192.168.56.60 prom01 prom01.lab
192.168.56.61 node01 node01.lab
PING node01 (192.168.56.61) 56(84) bytes of data.
64 bytes from node01 (192.168.56.61): icmp_seq=1 ttl=64 time=0.612 ms
64 bytes from node01 (192.168.56.61): icmp_seq=2 ttl=64 time=0.498 ms

--- node01 ping statistics ---
2 packets transmitted, 2 received, 0% packet loss, time 1002ms
rtt min/avg/max/mdev = 0.498/0.555/0.612/0.057 ms

From your laptop, ssh student@192.168.56.60 should now work too, which is much nicer than typing in the VirtualBox console.

✅ Checkpoint: prom01 and node01 ping each other by name, and you can SSH from your laptop.

7A first look at Prometheus (temporary)

On prom01, download the current release, unpack it in your home folder and start it in the foreground. Lesson 2 does this properly with a service user and systemd, so treat this as a test drive.

Run this on prom01:

VER=3.16.0
cd ~
wget -q https://github.com/prometheus/prometheus/releases/download/v$VER/prometheus-$VER.linux-amd64.tar.gz
tar xzf prometheus-$VER.linux-amd64.tar.gz
ls prometheus-$VER.linux-amd64
cd prometheus-$VER.linux-amd64 && ./prometheus --config.file=prometheus.yml

The output looks like this (shortened, your times will differ):

LICENSE  NOTICE  prometheus  prometheus.yml  promtool
time=2026-11-08T05:12:40.118Z level=INFO source=main.go:939 msg="Starting Prometheus Server" mode=server version="(version=3.16.0, branch=HEAD, revision=e2e28adeee2c5883d000fc82aca6008cfbf7e96d)"
...
time=2026-11-08T05:12:40.296Z level=INFO source=main.go:1148 msg="TSDB retention updated" duration=15d size=0B percentage=0
...
time=2026-11-08T05:12:40.297Z level=INFO source=main.go:1506 msg="Server is ready to receive web requests."

The line to look for is “Server is ready to receive web requests”. The “TSDB retention updated” line shows duration=15d, the default you get when you don’t set a retention. Since version 3.0 the tarball no longer ships the old consoles folders, so don’t worry if an older guide mentions them.

✅ Checkpoint: Prometheus logs “Server is ready to receive web requests” on prom01.

What is Prometheus lab: Prometheus 3.16.0 starting in the foreground on prom01
Prometheus 3.16.0 starting in the foreground on prom01

8Open the web UI and run your first query

On your laptop browse to http://192.168.56.60:9090. In the query box type up and press Execute. The shipped prometheus.yml has one job that scrapes Prometheus itself, so you get one row. It also carries the label app=”prometheus”, which that sample file adds.

up{app="prometheus", instance="localhost:9090", job="prometheus"}    1

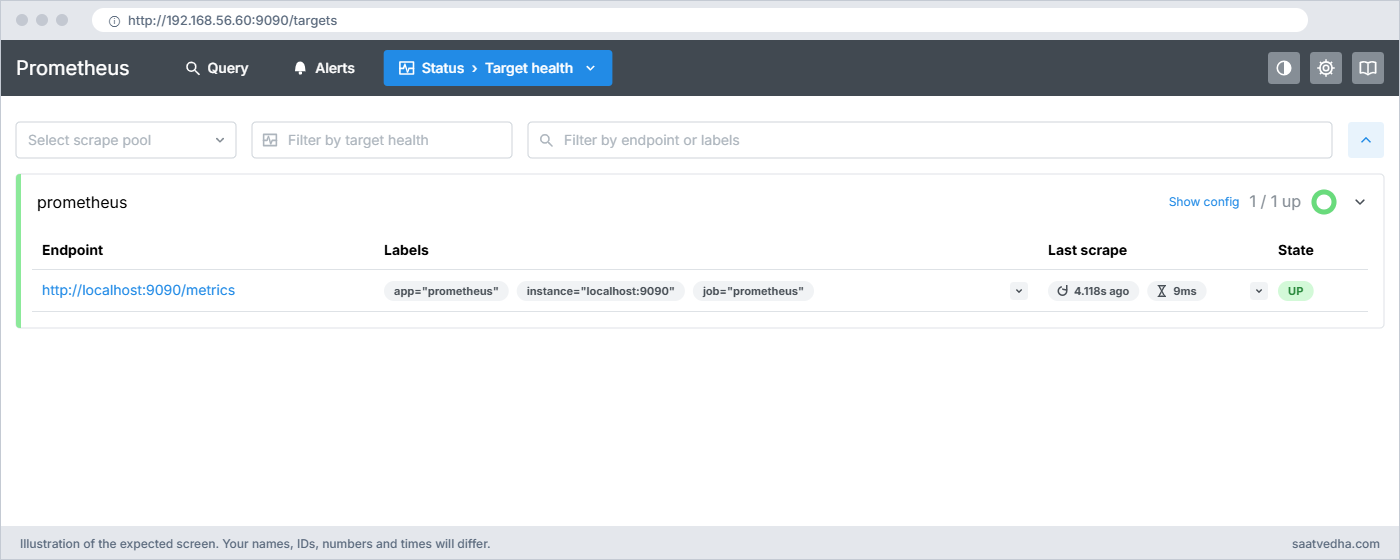
Now open Status > Target health and you’ll see the same target marked UP with its last scrape time. Press Ctrl+C in the SSH session to stop Prometheus, shut both VMs down and take a VirtualBox snapshot of each called base.

What is Prometheus: the query up in the Prometheus 3 Query page on prom01
The query up in the Query page: one series from the prometheus job
What is Prometheus: Status > Target health with the prometheus target UP” class=”wp-image-10260″ width=”1400″ height=”560″ style=”width:100%;height:auto;border-radius:10px;” /><figcaption style=Status > Target health: the prometheus pool with 1 / 1 up

✅ Checkpoint: The query up returned 1 for job=”prometheus”, and both VMs have a snapshot called base.

Break It, Then Fix It

Two problems that catch almost everyone on day one. Restore nothing yet, these are safe.

1The VMs can’t reach each other

On node01, stop the host-only card and ping from prom01:

Run this on node01, then the ping on prom01:

sudo ip link set enp0s8 down
# on prom01:
ping -c 2 node01

You’ll get this error:

PING node01 (192.168.56.61) 56(84) bytes of data.
From prom01 (192.168.56.60) icmp_seq=1 Destination Host Unreachable
From prom01 (192.168.56.60) icmp_seq=2 Destination Host Unreachable

--- node01 ping statistics ---
2 packets transmitted, 0 received, +2 errors, 100% packet loss, time 1031ms

“Destination Host Unreachable” from your own address means ARP got no answer: nothing on that network owns 192.168.56.61. The same thing happens when Adapter 2 is unticked in VirtualBox, attached to NAT by mistake, or attached to a different host-only network.

Fix:

sudo ip link set enp0s8 up      # on node01
ip -br addr show enp0s8          # should show 192.168.56.61/24 UP

✅ Checkpoint: ping node01 from prom01 works again.

2Port 9090 is already in use

Start Prometheus in one SSH session, then try to start a second copy in another session:

Run this in a second SSH session on prom01:

cd ~/prometheus-3.16.0.linux-amd64 && ./prometheus --config.file=prometheus.yml

You’ll get this error (last line of the output):

time=2026-11-08T05:20:13.402Z level=ERROR source=main.go:1280 msg="Unable to start web listener" err="listen tcp 0.0.0.0:9090: bind: address already in use"

Only one program can listen on a TCP port at a time. At work this usually means an old Prometheus is still running, or someone started a test copy and forgot it. The second copy stops before it opens the data/ folder, which is good, because two servers must never share one data folder.

Fix: find who owns the port, then stop that one:

sudo ss -ltnp | grep 9090
LISTEN 0      4096         0.0.0.0:9090       0.0.0.0:*    users:(("prometheus",pid=1843,fd=8))

Stop the first copy with Ctrl+C (or kill 1843), then start the one you want. If you need two servers on one box for a test, give the second one --web.listen-address=:9091 and its own --storage.tsdb.path.

✅ Checkpoint: Only one Prometheus is running and ss shows a single listener on 9090.

This happened at work

The sale that went quiet

I was working with an online retailer in Bengaluru during a festival sale. Around 9 pm the support team said orders felt slow, but our old monitoring, a script that pinged each server and sent an email if one didn’t reply, was all green. Every server answered ping, so as far as that script knew, life was good.

We spent nearly forty minutes logging in to boxes one by one and running top. What finally showed the problem was one engineer’s test Prometheus on a spare VM, which happened to scrape the payment service. Its graph of database connections had been flat at the pool limit of 50 since 8:40, and request latency had climbed with it.

The fix that night was raising the pool size and restarting the payment pods. The bigger change came the week after: we moved monitoring to Prometheus scraping every service every 15 seconds, with alerts on saturation (connections in use near the pool limit) and on error rate, not only on “is the box alive”. Ping tells you a machine is on, and metrics tell you whether it’s doing its job.

Common mistakes and troubleshooting

MistakeWhat happensWhat to do instead
Treating Prometheus as a log storeYou try to keep every error message in labels and memory use explodesStore counts in Prometheus (errors_total) and keep the text in a log system such as Loki or Elasticsearch
Only checking whether a server answers pingThe box is up but the application is broken and nobody noticesScrape application and system metrics, and alert on errors, latency and saturation
Cloning a VM without new MACs or machine-idBoth VMs get the same NAT lease or SSH warns that the host key changedPick “Generate new MAC addresses” and reset machine-id and SSH host keys, as in step 5
Using a tab in a netplan or Prometheus YAML filenetplan apply or Prometheus refuses the file with a parse errorUse spaces only; most editors can show tabs so you can spot them
Leaving port 9090 open to the whole networkAnyone who can reach it can read all your metrics and, with some flags, delete dataLesson 3 puts Prometheus behind Nginx with HTTPS and a password
Expecting a dead server to send an alertA crashed host can’t send anything, so a push-only tool may stay silentWith pull, alert on up == 0, which Lesson 8 sets up

Interview questions

Click a question to open it. Each one is written the way an interviewer would ask it. Under it you will see why they ask it and one way you could answer, in your own words.

Fresher level

1. What is Prometheus, in your own words, and what does it store?

Why they ask this: They want to see that you understand it as a metrics system, not a log tool or a dashboard tool.

How you might answer: Prometheus is an open-source monitoring system that scrapes numeric metrics from targets over HTTP and stores them as time series in its own database. Each series is a metric name plus labels, like node_load1 with instance and job, and each sample is a number with a timestamp.

It doesn’t store logs or draw fancy dashboards itself; we use Grafana for dashboards and Alertmanager to send the alerts it fires.

2. What does the up metric tell you?

Why they ask this: A simple check that you know how Prometheus reports its own scrape results.

How you might answer: Prometheus writes up for every target on every scrape: 1 if the scrape worked and 0 if it failed. So up == 0 is the first alert I set, because it catches a dead server, a stopped exporter or a firewall change.

2–5 years experience

3. Walk me through what happens between a server and an alert email in a Prometheus setup.

Why they ask this: They want the whole chain in order, which shows you can troubleshoot any link in it.

How you might answer: The exporter on the server exposes /metrics. Prometheus scrapes it on the scrape interval and stores the samples in its TSDB. The rule engine evaluates alerting rules every evaluation interval; once a condition holds for the for duration, the alert goes from pending to firing and Prometheus sends it to Alertmanager.

Alertmanager groups it with similar alerts, checks silences and inhibition, then sends the email through the configured SMTP server. When an email doesn’t arrive I check those links one by one, starting with the Targets page.

4. Why does Prometheus pull instead of having agents push, and when would you push?

Why they ask this: They want to hear the trade-offs, not a slogan.

How you might answer: Pull means Prometheus owns the target list, so a missing target shows as up 0 right away, and I can curl any /metrics page to see what Prometheus sees. It also stops a misbehaving client from flooding the server.

I’d push for short batch jobs through Pushgateway, or use agent mode or remote write when Prometheus can’t reach the targets, for example across a strict firewall or from edge sites.

Senior level

5. A manager asks you to replace Zabbix with Prometheus for 800 servers and some SNMP switches. How do you answer?

Why they ask this: They are checking judgement: knowing where each tool is strong instead of picking a favourite.

How you might answer: I’d first ask what problem we’re solving. Prometheus is very good for Linux and application metrics, dynamic environments and flexible queries, and the SNMP exporter can cover the switches, but SNMP traps and the GUI-driven templates teams rely on in Zabbix don’t map one to one.

For 800 servers I’d plan a few Prometheus servers by zone or team, long-term storage with Thanos or Mimir if we need more than a few weeks, and run both systems in parallel for a while before switching alerts over.

6. What would make a single Prometheus server run out of memory, and how would you spot it?

Why they ask this: They want to know whether you understand cardinality, the most common real failure.

How you might answer: Memory follows the number of active series, so the usual cause is a label with too many values, like a user ID or a full URL path. I’d look at Status > TSDB status for the metrics and labels with the highest series counts and at prometheus_tsdb_head_series over time.

Then I’d drop or rewrite the bad label with metric_relabel_configs, and talk to the team that added it.

Quick quiz

Q1. Which port does the Prometheus server listen on by default?

  1. 3000
  2. 9090
  3. 9093
  4. 9100
Show answer

B — 9090 is the Prometheus server. 3000 is Grafana, 9093 Alertmanager and 9100 Node Exporter.

Q2. How does Prometheus normally get metrics from a target?

  1. The target emails them
  2. The target pushes them to Prometheus
  3. Prometheus scrapes the target’s /metrics page over HTTP
  4. Prometheus reads the target’s log files
Show answer

C — Prometheus pulls (scrapes) an HTTP endpoint on a schedule.

Q3. What makes two time series different from each other?

  1. Only the metric name
  2. The metric name and its set of labels
  3. The time the sample was taken
  4. The scrape interval
Show answer

B — A series is identified by its name plus all label values; change one label and you have a new series.

Q4. Which component sends the actual email or Slack message for an alert?

  1. Prometheus server
  2. Node Exporter
  3. Pushgateway
  4. Alertmanager
Show answer

D — Prometheus decides that an alert is firing; Alertmanager groups it and delivers notifications.

Q5. What does up == 0 mean for a target?

  1. The target has zero CPU load
  2. The last scrape of that target failed
  3. The target is a new server
  4. Prometheus is restarting
Show answer

B — up is 1 for a successful scrape and 0 for a failed one.

Quick recap

  • Prometheus pulls metrics from targets over HTTP on a schedule and stores them in its own time series database.
  • A time series is a metric name plus labels, and too many label values (high cardinality) is the most common way to hurt a Prometheus server.
  • Exporters turn systems into /metrics pages, Alertmanager delivers alerts, and Grafana draws dashboards.
  • Prometheus is strong for operational metrics and dynamic systems, and the wrong tool for logs or exact per-event billing.
  • Your lab is ready: prom01 at 192.168.56.60 and node01 at 192.168.56.61, both with a snapshot called base.

Next lesson

Lesson 2: Install Prometheus on Ubuntu as a systemd service → You set Prometheus up the way it runs at work: its own user, proper folders, a systemd unit and a safe way to reload and upgrade.

Further reading: what is Prometheus

Want to go deeper into what is Prometheus? The official Prometheus overview and data model pages explain the ideas from this lesson in more detail, and the 3.0 migration guide lists what changed if you read older tutorials. For a refresher on the Linux side, see Linux performance monitoring.

You can also see the full plan for this course on the Prometheus Monitoring course page.

Scroll to Top

This website uses cookies

We use a few cookies to keep this site working. If you allow it, we also use Google Analytics to count visits so we can improve our lessons. You can accept all, deny the optional ones, or choose what to allow.