Secure Prometheus with Nginx, HTTPS and basic auth
-
Phase 1: Prometheus foundations and setup
-
Phase 2: Collect, query and store metrics
-
Phase 3: Alerts and dashboards
Right now anyone who can reach prom01 on port 9090 can read every metric, every target address and your whole config, with no password asked. This lesson shows you how to secure Prometheus the way most teams do it: Prometheus listens only on 127.0.0.1, and Nginx stands in front with HTTPS and a login.
You’ll make a lab domain without buying one, create a self-signed certificate with the right names in it, write the Nginx site, switch on the firewall, and test every layer with curl. Then you’ll try Prometheus’s own TLS and basic auth (the option for when you can’t run Nginx) and learn how bcrypt passwords work there.
Where this lesson fits
Lesson 3 of 10 in Prometheus Monitoring · Phase 1: Prometheus foundations and setup · Before this: Lesson 2, install Prometheus on Ubuntu · Next: Lesson 4, Prometheus Node Exporter
| Time | You need | By the end you can |
|---|---|---|
| About 90 minutes | prom01 with the prom-installed snapshot from Lesson 2, your laptop, an SSH session as student | Prometheus reachable only as https://prom01.lab/ with a password, port 9090 closed to the network, and a snapshot called secured |
What it is, in one line
Securing Prometheus means hiding its port from the network and letting people in only through a proxy that encrypts the traffic and asks for a password.
In Simple Words
The records room and the front desk
Think of a hospital records room. Doctors need the files, but nobody wants visitors walking straight in from the corridor and reading whatever they like, so the room has no door to the corridor at all. Its only door opens behind the front desk.
At the front desk a clerk checks your ID card, and if it’s fine she fetches the file for you and hands it over in a sealed envelope so nobody in the queue can read it on the way. If the records clerk goes home sick, the front desk can only say “sorry, the room isn’t answering”.
Prometheus is the records room, 127.0.0.1 is the missing corridor door, Nginx is the front desk, the password is the ID card and HTTPS is the sealed envelope.
Engineer's View
What is exposed, and the two ways to lock it
Out of the box Prometheus listens on :9090, every interface, plain HTTP, no login. Anyone who reaches it can run heavy queries that eat CPU and memory, read /api/v1/status/config (your job list, internal hostnames and sometimes credentials for scraping other systems), and list every target from /api/v1/targets. If someone has also turned on --web.enable-admin-api, they can delete series or fill the disk with snapshots, and --web.enable-lifecycle lets them shut the server down with a POST to /-/quit.
| Option | How it works | Good for |
|---|---|---|
| Reverse proxy (Nginx, this lesson) | Prometheus binds 127.0.0.1:9090; Nginx on 443 does TLS and basic auth, then proxies to it | Most setups: one place for certificates, logs, rate limits, single sign-on later |
| Native web config file | Prometheus reads a web config file (flag web.config.file) with tls_server_config and basic_auth_users (bcrypt hashes) | Small hosts, containers, places where you can’t add Nginx |
| Both | Nginx outside, native TLS or auth inside too | Strict compliance, zero-trust networks |
Basic auth sends the username and password with every request, Base64-encoded, which anyone on the path can decode, so it’s only safe inside HTTPS. TLS needs a certificate whose Subject Alternative Name (SAN) lists every name and IP people use; modern browsers and curl ignore the old Common Name field. For a real domain you’d get a trusted certificate from Let’s Encrypt with certbot; in a lab with a made-up domain you sign one yourself and accept the browser warning or import it.
--web.external-url tells Prometheus the address people use from outside, https://prom01.lab/. It uses it to build absolute links (for example in alert notifications) and to work out its route prefix if you serve it under a sub-path such as /prometheus/.
How it works, step by step
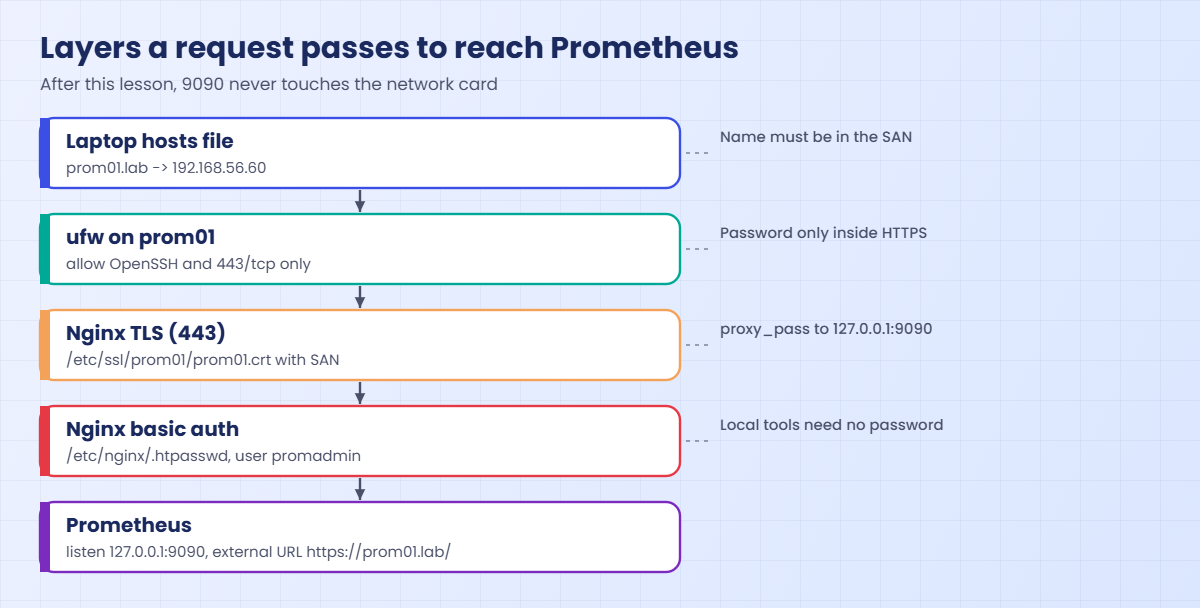
1The request path after this lesson
Your laptop resolves prom01.lab to 192.168.56.60 through its hosts file. ufw lets the connection in on 443 only, Nginx finishes the TLS handshake, checks the basic auth header against /etc/nginx/.htpasswd, and forwards the request over plain HTTP to 127.0.0.1:9090 inside the same machine.
The drawing below shows the layers. Note that 9090 never touches the network card any more, so even with ufw switched off nobody outside can reach it.
2What Nginx adds to each request
proxy_pass http://127.0.0.1:9090 forwards the path as it is. The proxy_set_header lines pass on the original host name, the client IP (X-Real-IP, X-Forwarded-For) and the scheme (X-Forwarded-Proto), so logs and redirects show the real visitor and https instead of 127.0.0.1 and http.
Nginx also writes every request to /var/log/nginx/access.log with the username, which gives you an audit trail Prometheus doesn’t keep by itself.
3Where each failure shows up
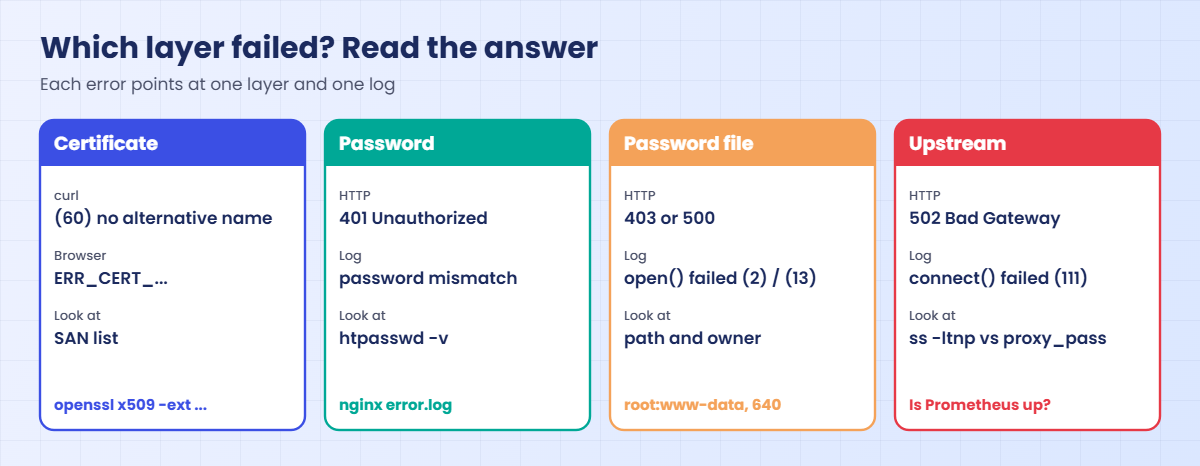
When something breaks, the error tells you which layer failed. A certificate problem stops the browser before any password is asked. A 401 comes from Nginx’s password check, a 403 or 500 from Nginx failing to read the password file, and a 502 means Nginx was happy but nothing answered on 127.0.0.1:9090.
The second drawing maps each answer to its layer and the log to read.
4Native TLS and basic auth, for when there is no proxy
Prometheus can do both jobs itself through a small YAML file passed with --web.config.file. Passwords in it must be bcrypt hashes, never plain text, and the file is read again on every request, so a new password or renewed certificate works without a restart.
tls_server_config:
cert_file: /etc/prometheus/prom01.crt
key_file: /etc/prometheus/prom01.key
basic_auth_users:
promadmin: $2y$10$W3FQQlOUltbttOylRPpu1ugpv1kZ.EkGDUKCUpVuiq4Q5XK2VgS1KThe catch is that everything which talks to Prometheus now needs the password too: its own self-scrape job, Grafana, scripts, and the curl localhost checks from Lesson 2. That’s why this course tries it in the lab and then goes back to Nginx, keeping local access simple.
Hands-on lab: put Prometheus behind Nginx with HTTPS and a password
Before you run any command, double-check it
Read every command twice before you press Enter. Check the target: the server name, the user, the disk or device name, the path and the sizes. These commands are for learning and were tested in our lab, not on your system. At work, run the read-only commands first, follow your change process, make sure a backup exists, and ask a second person to check anything that changes or deletes data. You run them at your own risk.
Start prom01 from the prom-installed snapshot. Commands run on prom01 unless a step says laptop. You’ll use the password Lab@Prom2026 for user promadmin; pick your own if you like, but use it the same way everywhere.
1See what an open port 9090 gives away
Run this on your laptop (PowerShell, Terminal or any shell with curl):
curl -s http://192.168.56.60:9090/api/v1/status/config
curl -s http://192.168.56.60:9090/api/v1/status/flagsThe output is long. It starts like this (the … marks parts left out):
{"status":"success","data":{"yaml":"global:\n scrape_interval: 15s\n scrape_timeout: 10s\n evaluation_interval: 15s\n ... scrape_configs:\n- job_name: prometheus\n ...
{"status":"success","data":{... "storage.tsdb.path":"/var/lib/prometheus", ... "web.enable-lifecycle":"true", ... "web.listen-address":"0.0.0.0:9090", ...}}No password, and you get the full config and every startup flag, including the fact that the lifecycle API is on. On Windows use curl.exe if PowerShell maps curl to its own command.
✅ Checkpoint: From the laptop you can read the config of prom01 without any login. That’s the problem you’re fixing.
2Give prom01 a lab domain name
There’s no need to buy a domain. Add a line to the hosts file on your laptop so prom01.lab points to the VM; prom01 already has it from Lesson 1.
| Laptop OS | File to edit (as administrator) | Line to add |
|---|---|---|
| Windows 10/11 | C:\Windows\System32\drivers\etc\hosts (Notepad run as administrator) | 192.168.56.60 prom01.lab |
| macOS / Linux | /etc/hosts (sudo nano /etc/hosts) | 192.168.56.60 prom01.lab |
Then run this on the laptop:
ping prom01.labOn Windows you should see this (macOS and Linux print ping in their own format):
Pinging prom01.lab [192.168.56.60] with 32 bytes of data:
Reply from 192.168.56.60: bytes=32 time<1ms TTL=64✅ Checkpoint: prom01.lab resolves to 192.168.56.60 on your laptop and on prom01.
3Create a self-signed certificate with SAN
Run this on prom01:
sudo mkdir -p /etc/ssl/prom01
sudo openssl req -x509 -newkey rsa:2048 -nodes -days 365 \
-keyout /etc/ssl/prom01/prom01.key -out /etc/ssl/prom01/prom01.crt \
-subj "/CN=prom01.lab" \
-addext "subjectAltName=DNS:prom01.lab,IP:192.168.56.60"
sudo chmod 600 /etc/ssl/prom01/prom01.key
sudo openssl x509 -in /etc/ssl/prom01/prom01.crt -noout -subject -ext subjectAltName -datesThe last command prints this (your dates will differ):
subject=CN=prom01.lab
X509v3 Subject Alternative Name:
DNS:prom01.lab, IP Address:192.168.56.60
notBefore=Nov 8 06:02:11 2026 GMT
notAfter=Nov 8 06:02:11 2027 GMTWhile the key is being made, openssl may print a line of dots and plus signs; that’s normal. -nodes leaves the key without a passphrase so Nginx can start unattended, which is why the key gets mode 600. The SAN line is the part that matters to browsers: both the name and the IP are listed, so either works without a name mismatch.
With a real domain you’d skip this step and run sudo apt install certbot python3-certbot-nginx, then sudo certbot --nginx -d prometheus.example.com, which gets a trusted Let’s Encrypt certificate and renews it automatically.
✅ Checkpoint: The certificate shows DNS:prom01.lab and IP Address:192.168.56.60 under Subject Alternative Name.
4Bind Prometheus to localhost and set the external URL
Run this on prom01:
sudo sed -i 's# --web.enable-lifecycle# --web.enable-lifecycle \\\n --web.listen-address=127.0.0.1:9090 \\\n --web.external-url=https://prom01.lab/#' /etc/systemd/system/prometheus.service
grep -A6 '^ExecStart' /etc/systemd/system/prometheus.service
sudo systemctl daemon-reload && sudo systemctl restart prometheus
sudo ss -ltnp | grep 9090
curl -s http://localhost:9090/-/ready; echoYou should see this (your PID will differ):
ExecStart=/usr/local/bin/prometheus \
--config.file=/etc/prometheus/prometheus.yml \
--storage.tsdb.path=/var/lib/prometheus \
--storage.tsdb.retention.time=15d \
--web.enable-lifecycle \
--web.listen-address=127.0.0.1:9090 \
--web.external-url=https://prom01.lab/
LISTEN 0 4096 127.0.0.1:9090 0.0.0.0:* users:(("prometheus",pid=1641,fd=8))
Prometheus Server is Ready.If the sed line looks scary, open the unit with sudo nano /etc/systemd/system/prometheus.service and add the two lines by hand; each line except the last ends with a space and a backslash. The ss line now shows 127.0.0.1:9090 instead of 0.0.0.0:9090, and the laptop curl from step 1 now fails at once (curl exits with code 7, connection refused).
✅ Checkpoint: ss shows Prometheus on 127.0.0.1:9090 only and curl localhost still says Ready.
5Install Nginx and create the password file
Run this on prom01:
sudo apt update && sudo apt install -y nginx apache2-utils
sudo htpasswd -cB -C 10 /etc/nginx/.htpasswd promadmin
sudo chown root:www-data /etc/nginx/.htpasswd && sudo chmod 640 /etc/nginx/.htpasswd
sudo cat /etc/nginx/.htpasswdYou should see this (your hash will differ, because bcrypt adds a random salt):
New password:
Re-type new password:
Adding password for user promadmin
promadmin:$2y$10$maqMtdyb4RsFl/D7wwaaTuu6vz7wbvp2XHSyvKqhEGljG7kSBBFECapache2-utils gives you the htpasswd tool. -c creates the file (leave it off when adding a second user or it wipes the first), -B picks bcrypt, and -C 10 sets the cost. Nginx worker processes run as www-data, so that group must be able to read the file.
✅ Checkpoint: /etc/nginx/.htpasswd has one promadmin line starting with $2y$10$ and is owned by root:www-data, mode 640.
6Write the Nginx site and enable it
Paste this whole block:
sudo tee /etc/nginx/sites-available/prometheus >/dev/null <<'EOF'
server {
listen 443 ssl;
server_name prom01.lab;
ssl_certificate /etc/ssl/prom01/prom01.crt;
ssl_certificate_key /etc/ssl/prom01/prom01.key;
ssl_protocols TLSv1.2 TLSv1.3;
auth_basic "Prometheus";
auth_basic_user_file /etc/nginx/.htpasswd;
location / {
proxy_pass http://127.0.0.1:9090;
proxy_set_header Host $host;
proxy_set_header X-Real-IP $remote_addr;
proxy_set_header X-Forwarded-For $proxy_add_x_forwarded_for;
proxy_set_header X-Forwarded-Proto $scheme;
}
}
EOF
sudo ln -s /etc/nginx/sites-available/prometheus /etc/nginx/sites-enabled/prometheus
sudo rm -f /etc/nginx/sites-enabled/default
sudo nginx -t && sudo systemctl reload nginxYou should see this:
nginx: the configuration file /etc/nginx/nginx.conf syntax is ok
nginx: configuration file /etc/nginx/nginx.conf test is successfulnginx -t is Nginx’s version of promtool: always run it before a reload. Removing the default site stops Nginx from showing its welcome page on port 80. The string after auth_basic is the realm, the text some browsers show in the login box.
✅ Checkpoint: nginx -t says the test is successful and systemctl is-active nginx prints active.
7Switch on the firewall
Run this on prom01:
sudo ufw allow OpenSSH
sudo ufw allow 443/tcp
sudo ufw enable
sudo ufw statusYou should see:
Rules updated
Rules updated (v6)
Rules updated
Rules updated (v6)
Command may disrupt existing ssh connections. Proceed with operation (y|n)? y
Firewall is active and enabled on system startup
Status: active
To Action From
-- ------ ----
OpenSSH ALLOW Anywhere
443/tcp ALLOW Anywhere
OpenSSH (v6) ALLOW Anywhere (v6)
443/tcp (v6) ALLOW Anywhere (v6)Allow SSH before enabling ufw, or you lock yourself out of the VM and need the VirtualBox console. Port 9090 needs no rule because it’s bound to 127.0.0.1 anyway; ufw is the second lock on the same door.
✅ Checkpoint: ufw status shows active with OpenSSH and 443/tcp allowed, and your SSH session still works.
8Test every layer with curl
Run this on prom01:
curl -s -o /dev/null -w "%{http_code}\n" https://prom01.lab/-/healthy
curl -sk -o /dev/null -w "%{http_code}\n" https://prom01.lab/-/healthy
curl -sk -u promadmin:Lab@Prom2026 https://prom01.lab/-/healthy; echo
curl -s --cacert /etc/ssl/prom01/prom01.crt -u promadmin:Lab@Prom2026 'https://prom01.lab/api/v1/query?query=up'; echo
sudo tail -1 /var/log/nginx/access.logYou should see this (your timestamp and time will differ):
000
401
Prometheus Server is Healthy.
{"status":"success","data":{"resultType":"vector","result":[{"metric":{"__name__":"up","instance":"localhost:9090","job":"prometheus"},"value":[1794117826.763,"1"]}]}}
127.0.0.1 - promadmin [08/Nov/2026:06:23:46 +0000] "GET /api/v1/query?query=up HTTP/1.1" 200 167 "-" "curl/8.18.0"Read them in order. 000 means curl refused the self-signed certificate and never sent a request. With -k (skip verification) you reach Nginx, which answers 401 because there’s no password. With the password you get through, and with --cacert curl trusts your certificate properly, so you don’t need -k at all.
✅ Checkpoint: You got 000, 401, “Healthy” and a JSON result, and the access log shows the user promadmin.

9Open it from the laptop browser
Browse to https://prom01.lab/. The browser warns that the certificate isn’t trusted (Chrome and Edge show NET::ERR_CERT_AUTHORITY_INVALID), because you signed it yourself. Click Advanced and continue, log in as promadmin, and you land on the Query page.
To get rid of the warning on your own laptop, copy /etc/ssl/prom01/prom01.crt over with scp and import it as a trusted root (Windows: double-click, Install Certificate, Local Machine, Trusted Root Certification Authorities). Only do this for certificates you made yourself.
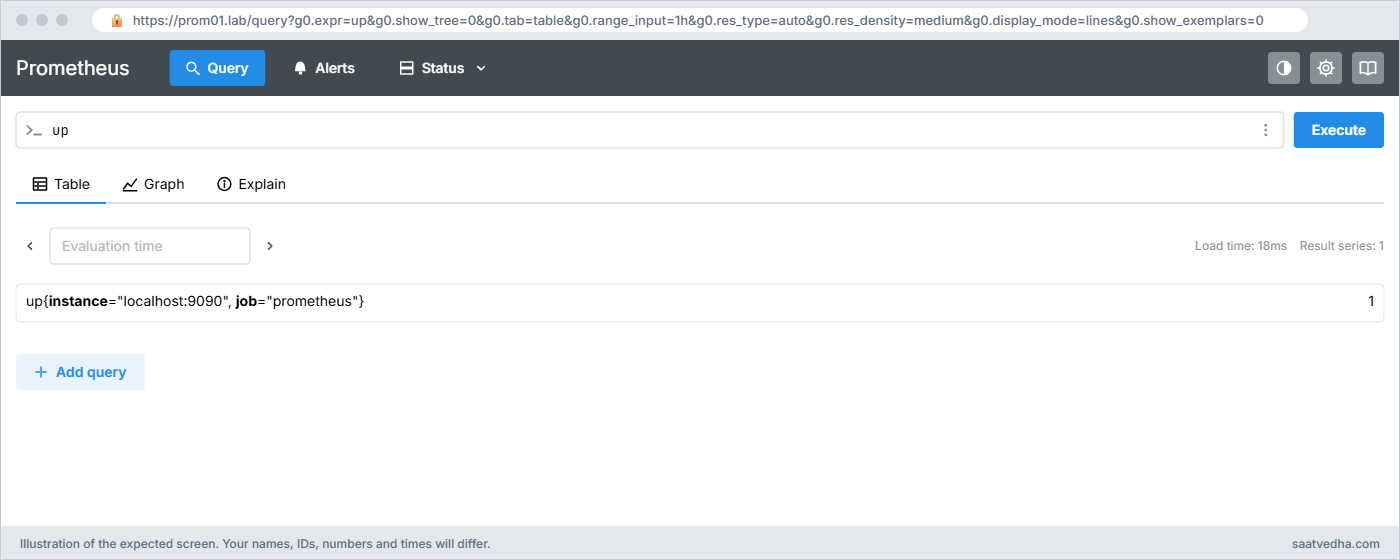
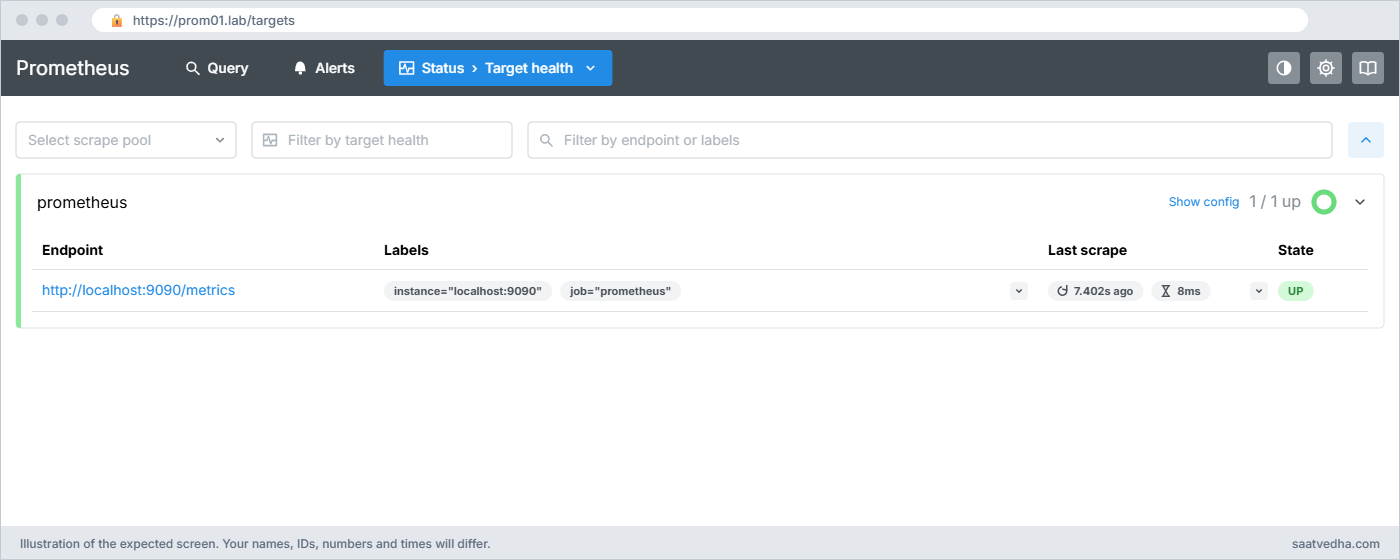
Status > Target health, now reached through Nginx at https://prom01.lab/targets✅ Checkpoint: https://prom01.lab/ asks for a password and then shows the Prometheus UI, and http://192.168.56.60:9090 no longer loads.
10Try native basic auth with bcrypt, then remove it
Now the no-Nginx option. You’ll make a bcrypt hash, write /etc/prometheus/web.yml, check it, and start Prometheus with it for a few minutes.
Paste this whole block on prom01:
HASH=$(htpasswd -nbBC 10 "" 'Lab@Prom2026' | tr -d ':\n')
echo "$HASH"
sudo tee /etc/prometheus/web.yml >/dev/null <<EOF
basic_auth_users:
promadmin: $HASH
EOF
sudo chown prometheus:prometheus /etc/prometheus/web.yml && sudo chmod 640 /etc/prometheus/web.yml
promtool check web-config /etc/prometheus/web.ymlYou should see this (your hash will differ):
$2y$10$W3FQQlOUltbttOylRPpu1ugpv1kZ.EkGDUKCUpVuiq4Q5XK2VgS1K
/etc/prometheus/web.yml SUCCESShtpasswd -nbBC 10 "" prints :hash for an empty user name; tr removes the colon and newline so only the hash is left. Typing the password on the command line leaves it in your shell history; leave out the b and htpasswd asks for it instead. Now add the flag with a systemd drop-in, restart and test:
Paste this whole block on prom01:
sudo mkdir -p /etc/systemd/system/prometheus.service.d
sudo tee /etc/systemd/system/prometheus.service.d/web-config.conf >/dev/null <<'EOF'
[Service]
ExecStart=
ExecStart=/usr/local/bin/prometheus \
--config.file=/etc/prometheus/prometheus.yml \
--storage.tsdb.path=/var/lib/prometheus \
--storage.tsdb.retention.time=15d \
--web.enable-lifecycle \
--web.listen-address=127.0.0.1:9090 \
--web.external-url=https://prom01.lab/ \
--web.config.file=/etc/prometheus/web.yml
EOF
sudo systemctl daemon-reload && sudo systemctl restart prometheus
curl -s -i http://localhost:9090/-/healthy | head -1
curl -s -u promadmin:Lab@Prom2026 http://localhost:9090/-/healthy; echo
sleep 20; curl -s -u promadmin:Lab@Prom2026 http://localhost:9090/api/v1/targets | grep -o '"lastError":"[^"]*"'A drop-in file overrides part of a unit without editing it. The empty ExecStart= line clears the original command, and the next one replaces it with the same flags plus the web config file.
You should see:
HTTP/1.1 401 Unauthorized
Prometheus Server is Healthy.
"lastError":"server returned HTTP status 401 Unauthorized"Local curl now needs the password, and look at the last line: Prometheus’s own job can’t scrape itself any more, so up{job="prometheus"} drops to 0. You’d fix that with a basic_auth block (username plus password_file) in the scrape job, and do the same in Grafana and every script. Adding tls_server_config with a cert and key to the same file turns on HTTPS too.
Remove it again (Nginx is our front door):
sudo rm /etc/systemd/system/prometheus.service.d/web-config.conf
sudo systemctl daemon-reload && sudo systemctl restart prometheus
systemctl cat prometheus | grep -c web.config.file
curl -s http://localhost:9090/-/healthy; echoYou should see this:
0
Prometheus Server is Healthy.Keep /etc/prometheus/web.yml for reference; it does nothing without the flag. Shut prom01 down and take a snapshot called secured.
✅ Checkpoint: Local curl works without a password again, https://prom01.lab/ still asks for one, and prom01 has a snapshot called secured.
Break It, Then Fix It
Three failures you’ll meet the first week you run this for real. The secured snapshot is your safety net.
1502 Bad Gateway
Run this on prom01:
sudo systemctl stop prometheus
curl -sk -u promadmin:Lab@Prom2026 -i https://prom01.lab/-/healthy | head -1
sudo tail -1 /var/log/nginx/error.logYou’ll get this error:
HTTP/1.1 502 Bad Gateway
2026/11/08 06:31:46 [error] 1537#1537: *15 connect() failed (111: Connection refused) while connecting to upstream, client: 127.0.0.1, server: prom01.lab, request: "GET /-/healthy HTTP/1.1", upstream: "http://127.0.0.1:9090/-/healthy", host: "prom01.lab"TLS and the password both worked, so Nginx tried to forward and nothing was listening on 127.0.0.1:9090. You get the same 502 and the same log line when Prometheus is up but on a different address or port than proxy_pass says, for example 127.0.0.1:9091 after a typo, or localhost resolving to ::1 while Prometheus listens on IPv4 only.
Fix: compare what Prometheus listens on with what Nginx forwards to:
sudo systemctl start prometheus
sudo ss -ltnp | grep prometheus
grep proxy_pass /etc/nginx/sites-available/prometheusLISTEN 0 4096 127.0.0.1:9090 0.0.0.0:* users:(("prometheus",pid=1683,fd=8))
proxy_pass http://127.0.0.1:9090;✅ Checkpoint: The two addresses match and the request returns “Prometheus Server is Healthy.” again.
2The certificate doesn’t match the name
A colleague types the short name prom01 instead of prom01.lab. Add prom01 to your laptop’s hosts line next to prom01.lab, or test on prom01 itself:
Run this on prom01:
curl -s --cacert /etc/ssl/prom01/prom01.crt -u promadmin:Lab@Prom2026 https://prom01/-/healthyYou’ll get this error:
curl: (60) SSL: no alternative certificate subject name matches target host name 'prom01'The certificate is trusted, but its SAN list has only prom01.lab and 192.168.56.60. A browser shows NET::ERR_CERT_COMMON_NAME_INVALID for the same reason, and adding the name to CN alone wouldn’t help, because SAN is what gets checked.
Fix: use a listed name, or reissue the certificate with every name people use:
sudo openssl req -x509 -newkey rsa:2048 -nodes -days 365 \
-keyout /etc/ssl/prom01/prom01.key -out /etc/ssl/prom01/prom01.crt \
-subj "/CN=prom01.lab" \
-addext "subjectAltName=DNS:prom01.lab,DNS:prom01,IP:192.168.56.60"
sudo nginx -t && sudo systemctl reload nginxA new certificate means any laptop that imported the old one must import the new one too.
✅ Checkpoint: curl to https://prom01/ with the cacert option returns “Prometheus Server is Healthy.” (or you went back to prom01.lab).
3Wrong password file path, and the login box that keeps coming back
Run this on prom01:
sudo sed -i 's#/etc/nginx/.htpasswd#/etc/nginx/htpasswd#' /etc/nginx/sites-available/prometheus
sudo nginx -t && sudo systemctl reload nginx
curl -sk -u promadmin:Lab@Prom2026 -i https://prom01.lab/-/healthy | head -1
sudo tail -1 /var/log/nginx/error.logYou’ll get this error:
nginx: configuration file /etc/nginx/nginx.conf test is successful
HTTP/1.1 403 Forbidden
2026/11/08 06:38:47 [error] 1627#1627: *17 open() "/etc/nginx/htpasswd" failed (2: No such file or directory), client: 127.0.0.1, server: prom01.lab, request: "GET /-/healthy HTTP/1.1", host: "prom01.lab"The dot is missing from the file name. nginx -t doesn’t open the password file, so the typo passes the test and only fails on a real request. If the file exists but www-data can’t read it you get a 500 and (13: Permission denied) in the log instead.
The “401 loop”, where the browser asks for the password again and again, is a different fault: the file is readable but the password doesn’t match. The error log then says user "promadmin": password mismatch, and htpasswd -v /etc/nginx/.htpasswd promadmin tells you whether the password you’re typing is the one in the file.
Fix:
sudo sed -i 's#/etc/nginx/htpasswd#/etc/nginx/.htpasswd#' /etc/nginx/sites-available/prometheus
sudo nginx -t && sudo systemctl reload nginx
sudo htpasswd -vb /etc/nginx/.htpasswd promadmin Lab@Prom2026Password for user promadmin correct.✅ Checkpoint: htpasswd -v says the password is correct and the browser logs in on the first try.
This happened at work
The dashboard a vendor could see
A colleague of mine was the on-call engineer at a healthcare SaaS company in Pune when this came up during a customer security review. The reviewer ran a port scan on the staging network, found 9090 open on three servers and sent back a screenshot of our Prometheus Targets page, with internal hostnames and the names of the clinic databases we scraped.
Nothing was leaked outside, because staging sat behind the VPN, but the VPN also had vendor accounts on it. The first fix someone tried was a ufw rule allowing 9090 only from the Grafana server, and two days later a new Grafana node came up with a different IP and every dashboard went blank at 11 pm.
The cause was that we’d been treating Prometheus as an internal tool that didn’t need a front door. The team moved every Prometheus to 127.0.0.1, put Nginx in front with TLS and basic auth (later swapped for single sign-on through an OAuth proxy), and gave Grafana a service account in the htpasswd file. The Targets page that started it all is now behind a login, and the scan shows only 443.
Common mistakes and troubleshooting
| Mistake | What happens | What to do instead |
|---|---|---|
| Using basic auth over plain HTTP | The password crosses the network in Base64, which anyone can decode | Always put basic auth inside HTTPS |
| Certificate with CN only and no SAN | Browsers and curl reject it with a name mismatch | Put every DNS name and IP in subjectAltName |
| Running htpasswd -c to add a second user | The file is recreated and the first user is gone | Use -c only the first time |
| Enabling ufw before allowing OpenSSH | Your SSH session drops and you need the VM console | Allow OpenSSH first, then ufw enable |
| Leaving Prometheus on 0.0.0.0:9090 behind Nginx | Anyone can skip Nginx and hit 9090 directly | Bind to 127.0.0.1:9090 with the web.listen-address flag |
| Plain-text password in web.yml | promtool check web-config fails with “hashedSecret too short to be a bcrypted password” | Store a bcrypt hash made with htpasswd -nBC 10 |
| Turning on native auth and forgetting the clients | Self-scrape, Grafana and scripts get 401 and dashboards go blank | Add basic_auth to every client, or keep auth at the proxy |
Interview questions
Click a question to open it. Each one is written the way an interviewer would ask it. Under it you will see why they ask it and one way you could answer, in your own words.
Fresher level
1. Why shouldn’t Prometheus port 9090 be open to the whole network?
Why they ask this: They want to see that you know Prometheus has no login by default and what that exposes.
How you might answer: By default Prometheus has no authentication, so anyone who reaches 9090 can read all metrics, the full config with internal hostnames, and the target list, and can run heavy queries. If the lifecycle or admin API is on, they can also shut it down or delete data. I bind it to 127.0.0.1 and put Nginx with HTTPS and a password in front.
2. What does the SAN field in a certificate do?
Why they ask this: A basic TLS check that comes up whenever certificates break.
How you might answer: Subject Alternative Name lists every DNS name and IP the certificate is valid for, and browsers and curl check that list, not the old Common Name. For prom01 I put DNS:prom01.lab and IP:192.168.56.60, so either works without a name mismatch error.
2–5 years experience
3. Users report 502 Bad Gateway on the Prometheus URL. Walk me through it.
Why they ask this: They want you to know which layer gives a 502 and to go to the right log.
How you might answer: A 502 comes from Nginx and means TLS and auth worked but the upstream didn’t answer. I check /var/log/nginx/error.log for “connect() failed (111: Connection refused) while connecting to upstream”, then systemctl status prometheus and ss -ltnp to see what Prometheus listens on.
Usually Prometheus is down, or proxy_pass points to a different port or address than the web.listen-address flag, for example localhost resolving to ::1 while Prometheus listens on 127.0.0.1.
4. How would you protect Prometheus if you can’t install Nginx on the server?
Why they ask this: They are checking that you know the native web config option and its side effects.
How you might answer: I’d use the web.config.file flag with tls_server_config for the certificate and key, and basic_auth_users with bcrypt hashes made by htpasswd -nBC 10. I validate it with promtool check web-config; the file is re-read on every request, so password and cert changes need no restart.
Then every client needs credentials: the self-scrape job gets a basic_auth block with password_file, and Grafana’s data source gets the user and password, otherwise up for Prometheus itself drops to 0.
Senior level
5. Your security team wants single sign-on instead of shared basic auth passwords for Prometheus and Alertmanager. How would you design it?
Why they ask this: They’re testing whether you can move past the lab setup to something auditable at scale.
How you might answer: I’d keep Prometheus and Alertmanager on localhost or a private network and put an authenticating proxy in front, such as oauth2-proxy behind Nginx talking to our identity provider over OIDC, so access follows group membership and leaves an audit trail per person.
Machine clients like Grafana and federation scrapes would use separate service credentials or mTLS rather than people’s accounts, and I’d still keep the admin and lifecycle APIs off or limited to localhost.
6. How do you handle certificate expiry for monitoring endpoints?
Why they ask this: They want to see operational thinking, not only the one-time setup.
How you might answer: For real domains I use certbot or an internal ACME CA so renewal is automatic, and Nginx reloads after renewal. I also monitor expiry itself, for example with the blackbox exporter’s probe_ssl_earliest_cert_expiry metric and an alert at 21 days.
Self-signed certificates like our lab one are fine for a lab, but in production they get forgotten, so I keep them out of anything people depend on.
Quick quiz
Q1. Which flag makes Prometheus listen only on the local machine?
- web.external-url=http://localhost
- web.listen-address=127.0.0.1:9090
- web.enable-lifecycle
- web.route-prefix=/local
Show answer
B — web.listen-address sets the IP and port the server binds to; 127.0.0.1 is reachable only from the same machine.
Q2. Nginx returns 502 Bad Gateway for https://prom01.lab/. What does that tell you?
- The password is wrong
- The certificate expired
- Nginx could not reach Prometheus on its upstream address
- ufw is blocking 443
Show answer
C — A 502 means Nginx accepted the request but got no answer from the upstream in proxy_pass.
Q3. What must passwords in Prometheus’s web.yml look like?
- Plain text
- MD5 hashes
- Base64 strings
- bcrypt hashes
Show answer
D — basic_auth_users only accepts bcrypt hashes; plain text fails promtool check web-config.
Q4. curl says “no alternative certificate subject name matches target host name”. What is missing?
- The private key
- That name in the certificate’s SAN list
- A password
- The http2 option
Show answer
B — The name you used is not in subjectAltName, so verification fails even if the certificate is trusted.
Q5. Which command should you run before sudo ufw enable on a remote VM?
- sudo ufw allow OpenSSH
- sudo ufw reset
- sudo ufw deny 22
- sudo systemctl stop ssh
Show answer
A — Allow SSH first, or enabling the firewall drops your session.
Quick recap
- An open 9090 shows metrics, config and targets to anyone, with no login.
- Bind Prometheus to 127.0.0.1:9090 and set web.external-url to the address people use, https://prom01.lab/.
- Nginx does TLS with a SAN certificate, basic auth from /etc/nginx/.htpasswd, and proxies to 127.0.0.1:9090; ufw allows only SSH and 443.
- 401 is the password, 403 or 500 is the password file, 502 is Prometheus not answering, a name mismatch is the SAN list.
- The native web.config.file flag with bcrypt hashes and TLS works without Nginx, but every client then needs the password.
Next lesson
Lesson 4: Scrape targets and Node Exporter → Prometheus is now safe but watches only itself. Next you install Node Exporter on node01 and prom01 and learn how targets, jobs and the /metrics format work.
Further reading: secure Prometheus
Want to go deeper into secure Prometheus? The official Prometheus security model explains what is and isn’t protected by default, the HTTPS and authentication page covers web.yml in full, and the Nginx docs for auth_basic and proxy_pass list every directive used here. For real domains see certbot.
If ufw or file permissions are new to you, the Linux administration course covers both, and Lesson 2 has the systemd unit you changed today. You can also see the full plan for this course on the Prometheus Monitoring course page.
