Prometheus recording rules
-
Phase 1: Prometheus foundations and setup
-
Phase 2: Collect, query and store metrics
-
Phase 3: Alerts and dashboards
Prometheus recording rules let Prometheus run a query on a timetable and save the answer as a brand new series. Instead of every Grafana panel and every alert working out CPU percent from raw per-core counters again and again, Prometheus does it once every 30 seconds and stores instance:node_cpu_utilisation:rate5m. Dashboards get faster, alert rules get shorter and everyone uses the same maths.
In this lesson you write the three recording rules the rest of the course depends on, load them on prom01, read them on the Rules page and in PromQL, and unit-test them with promtool test rules so a typo never reaches the server. Lesson 8 then builds alerts on top of these series.
Where this lesson fits
Lesson 7 of 10 in Prometheus Monitoring · Phase 2: Collect, query and store metrics · Before this: Lesson 6, the Prometheus TSDB · Next: Lesson 8, alerting rules
| Time | You need | By the end you can |
|---|---|---|
| About 75 minutes | prom01 and node01 from Lesson 6 (Prometheus as a service, job “node” scraping both VMs with role labels), SSH to prom01 | A working /etc/prometheus/rules/recording.yml with three tested rules, and the habit of checking and testing every rule file before reload |
What it is, in one line
A recording rule is a PromQL expression that Prometheus evaluates on a fixed interval and stores as a new, named time series, so later queries can read the precomputed answer.
In Simple Words
The school’s daily attendance register
In a big school, each class teacher marks attendance for her own forty children every morning. If the principal wanted the whole school’s attendance percentage, she could walk to every classroom, count every name and do the sum herself each time someone asked.
Instead, the office clerk adds it up once at 10 am and writes one line in the school register: “Class 5B, 92%”. When the inspector visits, the principal opens the register and answers in a second, and every report uses the same figure because everyone reads the same line.
The clerk’s line is a recording rule: one calculation done on a timetable and written down under a clear name.
Engineer's View
How the rule engine works
The rule files listed under rule_files in prometheus.yml contain groups. Each group has a name, an optional interval (default: the global evaluation_interval) and a list of rules. Prometheus evaluates the rules in a group one after another at the same timestamp, so a later rule can use the output of an earlier one, and different groups run in parallel.
| Field | Meaning | Sample value |
|---|---|---|
record | Name of the new series | instance:node_memory_available:ratio |
expr | Any PromQL that returns an instant vector or scalar | node_memory_MemAvailable_bytes / node_memory_MemTotal_bytes |
labels | Optional labels added to (or overwriting) every output series | team: platform |
interval (group) | How often the whole group runs | 30s |
limit (group) | Fail the rule if it returns more than this many series (0 = no limit) | 500 |
query_offset (group) | Evaluate a little in the past, to wait for late samples | 1m |
The output is written to the TSDB like scraped data, with the __name__ set to the record value and the labels the expression returned. The official naming convention is level:metric:operations: level is the labels kept after aggregation (instance, job), metric is the original metric name with _total dropped when rate() was applied, and operations lists what was done, newest first (rate5m, ratio, sum). Colons are reserved for recording rules, so never put them in exporter metric names.
How it works, step by step
1Prometheus loads the rule files
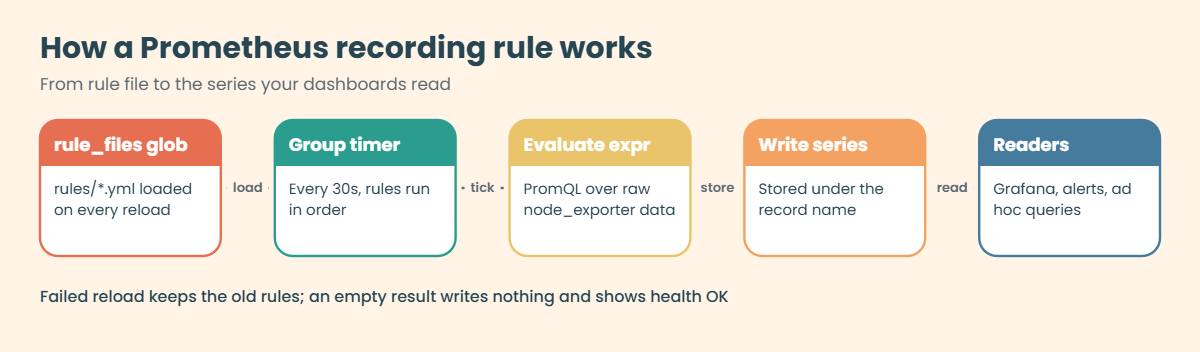
At start and on every reload, Prometheus expands the rule_files globs, parses each YAML file and checks every expression. If any file fails, the reload fails as a whole and the previous rule set keeps running, which is safe but easy to miss. The diagram below shows a rule’s full cycle.
2Each group runs on its own timer
Every interval, the group evaluates its rules in order at one shared timestamp. The result of each rule is appended to the TSDB with that timestamp. If a rule returns no series this time, nothing is written, and any series it wrote last time are marked stale so they vanish from queries straight away instead of hanging around for five minutes.
3Readers use the recorded series
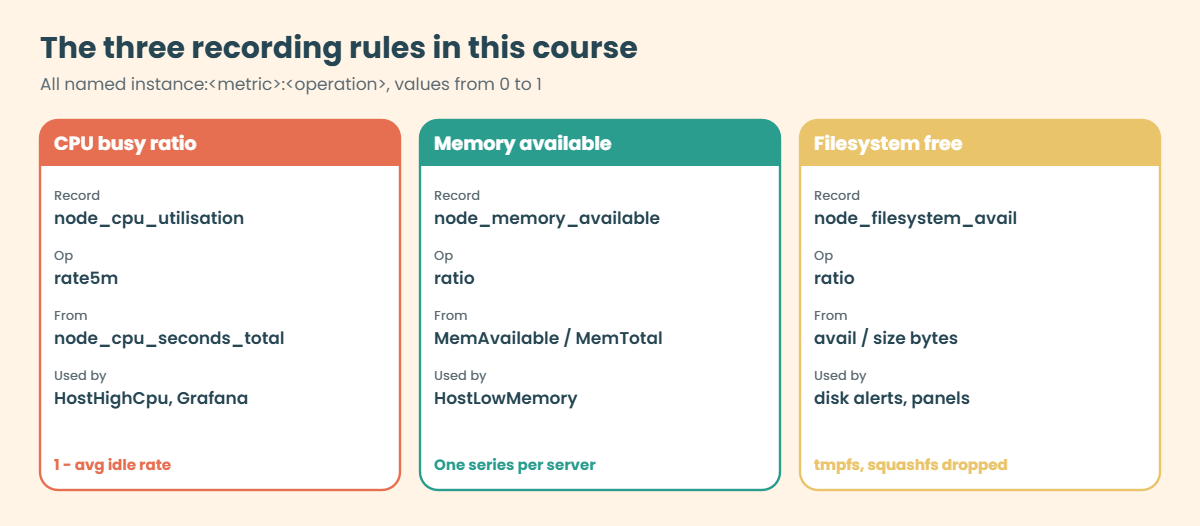
Dashboards, alert rules and ad hoc queries now select instance:node_cpu_utilisation:rate5m directly. A dashboard that showed 30 days of CPU for 500 servers used to read 500 x number-of-cores raw counters for every point; now it reads 500 precomputed series. The comparison below shows the three rules you’ll write, with their raw query and their recorded name side by side.
4When a recording rule is worth it
Not every query deserves a rule, because each rule adds new series and costs memory and disk like any other metric. Use these as a guide:
| Write a rule when… | Skip the rule when… |
|---|---|
| The query is on a dashboard many people open, or on a long time range | It’s a one-off investigation query |
| An alert uses the same heavy expression as a dashboard | The raw query is already a simple selector |
| The expression aggregates thousands of series (per-core, per-path) | The rule output would have almost as many series as its input |
| You need the same definition everywhere (“what is CPU %?”) | The expression depends on a Grafana variable chosen at view time |
Recording rules only write data from the moment they’re loaded. They don’t backfill history, so a new rule’s graph starts empty; promtool tsdb create-blocks-from rules can backfill past data if you need it.
Hands-on lab: write, check and unit-test recording rules on prom01
Before you run any command, double-check it
Read every command twice before you press Enter. Check the target: the server name, the user, the disk or device name, the path and the sizes. These commands are for learning and were tested in our lab, not on your system. At work, run the read-only commands first, follow your change process, make sure a backup exists, and ask a second person to check anything that changes or deletes data. You run them at your own risk.
Everything runs on prom01. You’ll create /etc/prometheus/rules/recording.yml with the three rules from the shared lab plan, confirm prometheus.yml already loads that folder, then write a unit test next to it. Keep the rule names as written, because Lessons 8 and 10 use them.
1Check the rules folder and the rule_files glob
Run this on prom01:
ls -ld /etc/prometheus/rules
grep -n -A1 'rule_files' /etc/prometheus/prometheus.yml
promtool check config /etc/prometheus/prometheus.ymlYou should see this (your dates and line numbers may differ):
drwxr-xr-x 2 prometheus prometheus 4096 Nov 7 18:02 /etc/prometheus/rules
5:rule_files:
6- - /etc/prometheus/rules/*.yml
Checking /etc/prometheus/prometheus.yml
SUCCESS: /etc/prometheus/prometheus.yml is valid prometheus config file syntaxLesson 2 created the folder and wrote the glob /etc/prometheus/rules/*.yml into prometheus.yml, so every .yml file you drop in the folder is loaded on the next reload (Lesson 8 adds alerts.yml next to today’s file). An empty folder is fine, which is why promtool doesn’t mention any rule files yet. If your line numbers differ because of the storage block from Lesson 6, that’s expected.
✅ Checkpoint: /etc/prometheus/rules exists, owned by prometheus, and rule_files lists /etc/prometheus/rules/*.yml.
2Write the recording rules
Paste this whole block:
sudo tee /etc/prometheus/rules/recording.yml >/dev/null <<'EOF'
groups:
- name: node-recording
interval: 30s
rules:
# share of time the CPUs were busy, 0 to 1, one series per server
- record: instance:node_cpu_utilisation:rate5m
expr: 1 - avg without (cpu, mode) (rate(node_cpu_seconds_total{job="node", mode="idle"}[5m]))
# share of memory still available to programs, 0 to 1
- record: instance:node_memory_available:ratio
expr: node_memory_MemAvailable_bytes{job="node"} / node_memory_MemTotal_bytes{job="node"}
# share of each real filesystem still free for normal users, 0 to 1
- record: instance:node_filesystem_avail:ratio
expr: |
node_filesystem_avail_bytes{job="node", fstype!~"tmpfs|overlay|squashfs"}
/ node_filesystem_size_bytes{job="node", fstype!~"tmpfs|overlay|squashfs"}
EOF
sudo chown prometheus:prometheus /etc/prometheus/rules/recording.ymlAll three store ratios between 0 and 1 rather than percentages; that’s the Prometheus convention, and Grafana can show them as percent with a unit setting. avg without (cpu, mode) keeps job, instance and role, so you can still filter by role="app" later. The expr: | form lets a long expression run over several lines.
✅ Checkpoint: /etc/prometheus/rules/recording.yml exists, owned by prometheus, with one group and three rules.
3Check the rules and the config with promtool
Run this on prom01:
promtool check rules /etc/prometheus/rules/recording.yml
promtool check config /etc/prometheus/prometheus.ymlYou should see this:
Checking /etc/prometheus/rules/recording.yml
SUCCESS: 3 rules found
Checking /etc/prometheus/prometheus.yml
SUCCESS: 1 rule files found
SUCCESS: /etc/prometheus/prometheus.yml is valid prometheus config file syntax
Checking /etc/prometheus/rules/recording.yml
SUCCESS: 3 rules foundcheck config also follows the rule_files glob and checks each file it finds, so in practice one command covers both. Both commands parse every PromQL expression too, so a missing [5m] is caught here and not at 2 am.
✅ Checkpoint: Both commands print SUCCESS and “3 rules found”.
4Reload and look at the Rules page
Run this on prom01:
curl -s -X POST localhost:9090/-/reload
sleep 35
curl -s 'localhost:9090/api/v1/rules?type=record' | jq '.data.groups[] | {name, file, interval, rules: [.rules[] | {name, health, lastError}]}'You should see:
{
"name": "node-recording",
"file": "/etc/prometheus/rules/recording.yml",
"interval": 30,
"rules": [
{
"name": "instance:node_cpu_utilisation:rate5m",
"health": "ok",
"lastError": null
},
{
"name": "instance:node_memory_available:ratio",
"health": "ok",
"lastError": null
},
{
"name": "instance:node_filesystem_avail:ratio",
"health": "ok",
"lastError": null
}
]
}Health “ok” means the last evaluation ran without an error; it does not mean the rule returned data, as you’ll see in the break-it section. In the browser, https://prom01.lab/ under Status > Rule health shows the same list with each rule’s last evaluation time and duration.

✅ Checkpoint: The API lists group node-recording with three rules, all health “ok”.
5Query the recorded series
Run this on prom01:
q(){ curl -s localhost:9090/api/v1/query --data-urlencode "query=$1" | jq -r '.data.result[] | [.metric.__name__, .metric.instance, (.metric.mountpoint // "-"), (.value[1] | tonumber * 1000 | round / 1000)] | @tsv'; }
q 'instance:node_cpu_utilisation:rate5m'
q 'instance:node_memory_available:ratio'
q 'instance:node_filesystem_avail:ratio{mountpoint="/"}'You should see this (your values will differ):
instance:node_cpu_utilisation:rate5m 192.168.56.61:9100 - 0.018
instance:node_cpu_utilisation:rate5m 192.168.56.60:9100 - 0.046
instance:node_memory_available:ratio 192.168.56.61:9100 - 0.719
instance:node_memory_available:ratio 192.168.56.60:9100 - 0.484
instance:node_filesystem_avail:ratio 192.168.56.61:9100 / 0.62
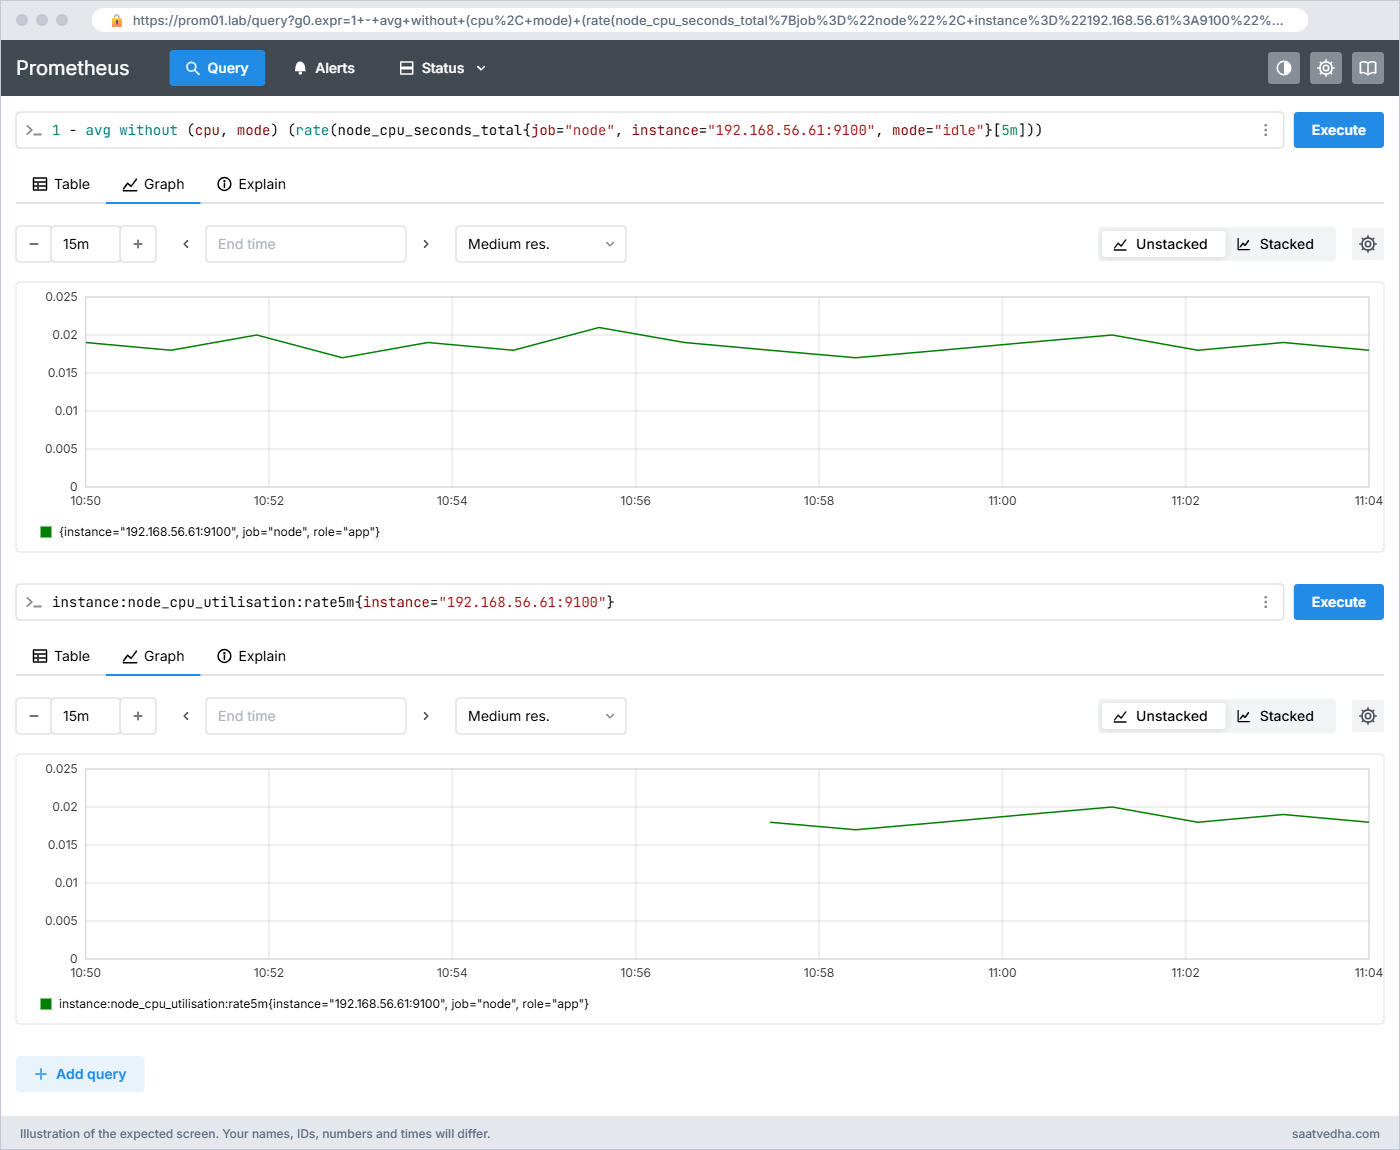
instance:node_filesystem_avail:ratio 192.168.56.60:9100 / 0.56These match what the long queries from Lesson 5 gave you, as ratios instead of percentages. In the Graph tab, compare instance:node_cpu_utilisation:rate5m with the raw expression for the last 15 minutes: the lines overlap, and the recorded one has points every 30 seconds starting from the moment you reloaded.
✅ Checkpoint: All three recorded names return one series per instance (one per mount for the filesystem rule).
6Use recorded series in new queries
Recorded series are ordinary series, so you can build on them. These are queries Lesson 8 turns into alerts and Lesson 10 into dashboard panels:
Run this on prom01:
q '100 * instance:node_cpu_utilisation:rate5m{role="app"}'
q 'instance:node_filesystem_avail:ratio < 0.20'
q 'topk(1, 1 - instance:node_memory_available:ratio)'
q 'max_over_time(instance:node_cpu_utilisation:rate5m[1h])'You should see this (your values will differ):
192.168.56.61:9100 - 1.8
192.168.56.60:9100 - 0.516
192.168.56.61:9100 - 0.031
192.168.56.60:9100 - 0.072The second query prints nothing because no filesystem is below 20% free, which is the healthy answer. Notice the fourth query: max_over_time() over a recorded series is cheap and needs no subquery, which was the expensive fix from Lesson 5’s break-it section.
✅ Checkpoint: You get CPU % for node01 only, nothing for the 20% disk filter, and a peak CPU value for each server over the last hour.
7Write a unit test for the rules
promtool test rules starts an in-memory Prometheus, feeds it series you describe, runs your rules and compares the results. The notation '0+7.5x40' means “start at 0 and add 7.5 each step, 40 times”, and '256000000x40' means the same value 41 times.
Paste this whole block:
sudo tee /etc/prometheus/rules/recording_test.yml.test >/dev/null <<'EOF'
rule_files:
- recording.yml
evaluation_interval: 30s
tests:
- interval: 15s
input_series:
# node01 has 1 CPU, idle 7.5 of every 15 seconds = 50% busy
- series: 'node_cpu_seconds_total{job="node", instance="192.168.56.61:9100", cpu="0", mode="idle"}'
values: '0+7.5x40'
- series: 'node_memory_MemAvailable_bytes{job="node", instance="192.168.56.61:9100"}'
values: '256000000x40'
- series: 'node_memory_MemTotal_bytes{job="node", instance="192.168.56.61:9100"}'
values: '1024000000x40'
promql_expr_test:
- expr: instance:node_cpu_utilisation:rate5m
eval_time: 10m
exp_samples:
- labels: 'instance:node_cpu_utilisation:rate5m{job="node", instance="192.168.56.61:9100"}'
value: 0.5
- expr: instance:node_memory_available:ratio
eval_time: 10m
exp_samples:
- labels: 'instance:node_memory_available:ratio{job="node", instance="192.168.56.61:9100"}'
value: 0.25
EOF
cd /etc/prometheus/rules && promtool test rules recording_test.yml.testYou should see this:
Processing test file: recording_test.yml.test
SUCCESSThe test file ends in .test on purpose: the *.yml glob in prometheus.yml would otherwise try to load it as a rule file and the reload would fail. Paths in rule_files inside the test are relative to the test file, which is why you cd into the folder. Pick input values that give exact answers, because the test compares floats digit for digit and 0.2 can come out as 0.20000000000000007.
✅ Checkpoint: promtool test rules prints SUCCESS for recording_test.yml.test.
8Make check and test part of every change
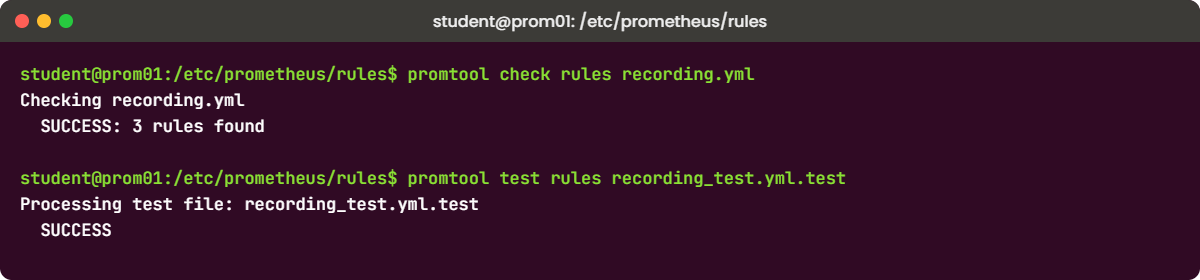
From now on, every rule change goes through the same three commands before the reload. Put them in a small script so nobody skips a step:
Run this on prom01:
sudo tee /usr/local/bin/prom-rules-reload >/dev/null <<'EOF'
#!/bin/bash
set -e
cd /etc/prometheus/rules
promtool check config /etc/prometheus/prometheus.yml
for t in *.test; do [ -e "$t" ] && promtool test rules "$t"; done
curl -sf -X POST localhost:9090/-/reload && echo "reloaded OK"
EOF
sudo chmod 755 /usr/local/bin/prom-rules-reload
prom-rules-reloadYou should see:
Checking /etc/prometheus/prometheus.yml
SUCCESS: 1 rule files found
SUCCESS: /etc/prometheus/prometheus.yml is valid prometheus config file syntax
Checking /etc/prometheus/rules/recording.yml
SUCCESS: 3 rules found
Processing test file: recording_test.yml.test
SUCCESS
reloaded OKset -e stops the script at the first failure, so a broken file never reaches the reload, and curl -f makes a failed reload return an error too. At work the same commands usually run in a CI pipeline on every merge request to the monitoring Git repository.
✅ Checkpoint: prom-rules-reload prints SUCCESS for config, rules and tests, then “reloaded OK”.
Break It, Then Fix It
Three ways recording rules go wrong. The first two are loud, the third is silent, which makes it the dangerous one. Keep a copy of the good file before you start: sudo cp /etc/prometheus/rules/recording.yml ~/recording.yml.good.
1Bad YAML indentation stops the rule file loading
Open recording.yml and pull the expr: of the memory rule two spaces to the left, so it lines up with the dash instead of with record:. Then reload without checking first, the way people do when they’re in a hurry.
The broken part looks like this:
- record: instance:node_memory_available:ratio
expr: node_memory_MemAvailable_bytes{job="node"} / node_memory_MemTotal_bytes{job="node"}Run this on prom01:
curl -s -X POST localhost:9090/-/reload
sudo journalctl -u prometheus -n 5 --no-pager | grep -E 'ERROR'
curl -s localhost:9090/metrics | grep '^prometheus_config_last_reload_successful'You’ll get this error:
failed to reload config: one or more errors occurred while applying the new configuration (--config.file="/etc/prometheus/prometheus.yml")
... level=ERROR source=manager.go:286 msg="loading groups failed" component="rule manager" err="/etc/prometheus/rules/recording.yml: yaml: line 5: did not find expected '-' indicator"
... level=ERROR source=main.go:1772 msg="Failed to apply configuration" err="error loading rules, previous rule set restored"
prometheus_config_last_reload_successful 0“Previous rule set restored” means the old rules keep running, so nothing looks broken in Grafana and the bad file sits on disk until the next restart, when Prometheus will refuse to start at all. prometheus_config_last_reload_successful 0 is the metric to alert on so this never goes unnoticed. promtool check rules would have shown the same YAML error before the reload.
Fix:
sudo cp ~/recording.yml.good /etc/prometheus/rules/recording.yml
prom-rules-reload✅ Checkpoint: prom-rules-reload ends with “reloaded OK” and prometheus_config_last_reload_successful is 1 again.
2A rule name that loads but can’t be queried
Someone renames the memory rule with hyphens: instance:node-memory-available:ratio. Prometheus 3 accepts almost any UTF-8 text as a metric name, so this passes the check, and that’s the trap.
Run this on prom01:
sudo sed -i 's/instance:node_memory_available:ratio/instance:node-memory-available:ratio/' /etc/prometheus/rules/recording.yml
promtool check rules /etc/prometheus/rules/recording.yml && curl -s -X POST localhost:9090/-/reload
sleep 35
curl -s localhost:9090/api/v1/query --data-urlencode 'query=instance:node-memory-available:ratio' | jq -c '.data.result'
curl -s localhost:9090/api/v1/format_query --data-urlencode 'query=instance:node-memory-available:ratio' | jq -r .dataYou’ll get this (no error, and no data):
Checking /etc/prometheus/rules/recording.yml
SUCCESS: 3 rules found
[]
instance:node - memory - available:ratioThe rule is recording fine, but PromQL reads the unquoted name as instance:node minus memory minus available:ratio, three metrics that don’t exist, so the answer is empty. Every dashboard and alert that uses the new name silently shows nothing. You could only reach it with the quoted form {"instance:node-memory-available:ratio"}, which nobody will remember to type.
If you set metric_name_validation_scheme: legacy under global: in prometheus.yml, Prometheus refuses the file at load time with invalid recording rule name, which is a good safety net.
Fix: stick to letters, digits, underscores and colons:
sudo sed -i 's/instance:node-memory-available:ratio/instance:node_memory_available:ratio/' /etc/prometheus/rules/recording.yml
prom-rules-reload✅ Checkpoint: instance:node_memory_available:ratio returns two series again.
3A rule that evaluates to nothing
The quietest failure. Change the CPU rule’s job selector to job="nodes" (a typo that happens when someone renames a job) and run the full check.
Run this on prom01:
sudo sed -i 's/job="node", mode="idle"/job="nodes", mode="idle"/' /etc/prometheus/rules/recording.yml
promtool check rules /etc/prometheus/rules/recording.yml
cd /etc/prometheus/rules && promtool test rules recording_test.yml.testYou’ll get this:
Checking /etc/prometheus/rules/recording.yml
SUCCESS: 3 rules found
Processing test file: recording_test.yml.test
FAILED:
expr: "instance:node_cpu_utilisation:rate5m", time: 10m,
exp: {__name__="instance:node_cpu_utilisation:rate5m", instance="192.168.56.61:9100", job="node"} 5E-01
got: nilcheck rules is happy because the PromQL is valid; there is no series with job=”nodes”. If this had been reloaded, the Rules page would still show health OK, the recorded series would go stale, and any alert like “CPU above 90%” built on it would never fire. Only the unit test, with its got: nil, catches it, which is the best argument for writing tests at all.
Fix:
sudo cp ~/recording.yml.good /etc/prometheus/rules/recording.yml
prom-rules-reloadOn a running server you can also catch empty rules with a query like absent(instance:node_cpu_utilisation:rate5m), which Lesson 8 turns into an alert.
✅ Checkpoint: The test prints SUCCESS again and all three recorded series return data.
This happened at work
The cricket final and the slow dashboard
An SRE friend of mine was on call at a video streaming company in Mumbai on the night of a big cricket final. Traffic was four times a normal evening, and the main Grafana board, the one the whole war room kept open, took 40 seconds to load and then started timing out. Prometheus CPU on the main server was at 100%, and every refresh from twenty laptops made it worse.
The first thing the team tried was raising Grafana’s query timeout, which only meant more queries piled up at once. Looking at the query log showed the cause: the “edge bandwidth” panels summed rate() across about 180,000 per-connection series from the CDN edge servers, over a 6 hour range, every 10 seconds, on every open browser.
They wrote three recording rules on the spot, cluster:edge_bytes_sent:rate1m and two friends, aggregated by cluster and region, checked them with promtool, reloaded, and pointed the panels at them. Within ten minutes the board loaded in about a second and Prometheus CPU dropped to 30%. The follow-up was a rule in their dashboard review: any panel over 10,000 series or used in an alert must read a recorded series, and every rule file ships with a promtool test rules file in the same merge request.
Common mistakes and troubleshooting
| Mistake | What happens | What to do instead |
|---|---|---|
| Reloading without promtool check rules | A YAML or PromQL error fails the reload; the old rules keep running until the next restart, which then fails | Run promtool check config (or the prom-rules-reload script) before every reload |
| Naming the test file *.yml inside the rules folder | The rule_files glob loads the test as a rule file and the reload fails | Give tests a different extension (.test) or keep them in a tests/ folder |
| Using sum by (instance) when you need job and role later | Dashboards can no longer filter by role or job | Use avg without (cpu, mode) or keep the labels you need in by (…) |
| Hyphens or spaces in record names | The rule loads but unquoted queries parse as subtraction and return nothing | Use letters, digits, _ and : only, following level:metric:operations |
| Trusting health OK on the Rules page | A rule with a wrong label returns nothing and still shows OK | Unit-test with promtool test rules and alert on absent() of key recorded series |
| Recording rules with almost as many output series as input | Twice the memory with no speed gain | Aggregate in the rule; record only when it reduces series or query cost |
| A rule group interval much longer than the rate window | Graphs look like steps and alerts react late | Keep interval at or below the scrape interval x 2, and the rate window at least 4 scrapes |
Interview questions
Click a question to open it. Each one is written the way an interviewer would ask it. Under it you will see why they ask it and one way you could answer, in your own words.
Fresher level
1. What is a recording rule and why would you use one?
Why they ask this: They want a clear definition and one practical reason, not a textbook list.
How you might answer: A recording rule is a PromQL expression Prometheus runs on a schedule, saving the result as a new series under a name I choose. I use them when a query is heavy or used in many places, like CPU percent per server from per-core counters.
Then dashboards and alerts read instance:node_cpu_utilisation:rate5m directly, which is faster and makes sure everyone uses the same definition.
2. Explain the naming convention level:metric:operations with an example.
Why they ask this: They are checking you can read and write rule names that teams will recognise.
How you might answer: Take instance:node_cpu_utilisation:rate5m. The level, instance, says which labels are kept after aggregation; the metric part says what’s measured; rate5m says the operation, a 5 minute rate.
If I summed requests per job I’d write job:http_requests:rate5m, dropping _total because rate() was applied. Colons are only for recording rules, never for exporter metric names.
2–5 years experience
3. You changed a rule file and reloaded, but the new rule isn’t on the Rules page. Walk me through what you check.
Why they ask this: They want to see a calm, ordered troubleshooting path.
How you might answer: First the reload result itself: the /-/reload response and the journal, looking for “loading groups failed” and “previous rule set restored”, and prometheus_config_last_reload_successful. Then I run promtool check config, which also checks every file the rule_files glob matches.
If the reload worked, I check the file is matched by the glob, readable by the prometheus user, and that the group name isn’t a duplicate. Finally I look at the rule’s lastError on the Rules page or /api/v1/rules.
4. How do you test recording rules before they reach production?
Why they ask this: They are testing whether you know promtool test rules and use it seriously.
How you might answer: I write a test file with input_series in the expanding notation, like 0+7.5×40 for a counter, and promql_expr_test cases with eval_time and exp_samples. promtool test rules runs it with an in-memory engine and prints the expected and actual values on failure.
I pick inputs that give exact results, include a case for the label selectors, and run promtool check config plus the tests in CI on every merge request, so an empty rule like a job typo fails with got: nil before anyone reloads.
Senior level
5. Your Prometheus has 400 recording rules and rule evaluation is falling behind. How do you investigate and fix it?
Why they ask this: They want you to know the rule engine metrics and how groups run.
How you might answer: I’d check prometheus_rule_group_last_duration_seconds against prometheus_rule_group_interval_seconds and look at prometheus_rule_group_iterations_missed_total. Groups whose evaluation takes longer than their interval are the problem, and the Rules page shows per-rule durations.
Rules in one group run in order, so I split slow independent rules into separate groups, which run in parallel, and make heavy rules build on cheaper recorded series. I’d also ask whether some rules are needed at all, and add a limit per group so one bad rule can’t produce millions of series.
6. A team wants a new recording rule on a 1-year dashboard, starting today. What do you tell them?
Why they ask this: They are checking whether you understand that rules don’t backfill and what the options are.
How you might answer: The rule only writes data from the moment it’s loaded, so the dashboard would be empty for the past. If the raw data is still within retention, promtool tsdb create-blocks-from rules can evaluate the rule over a past range and produce blocks to add to the TSDB.
For a 1-year view, local retention probably isn’t long enough anyway, so I’d discuss downsampling or long-term storage like Thanos or Mimir, and keep the rule small enough to be cheap to store for a year.
Quick quiz
Q1. What does a recording rule produce?
- An email
- A new time series stored in the TSDB
- A Grafana panel
- A change to prometheus.yml
Show answer
B — The result of the expression is stored under the record name like any scraped series.
Q2. In instance:node_cpu_utilisation:rate5m, what does “instance” tell you?
- The rule only runs on one instance
- The labels kept after aggregation
- The Prometheus server name
- The scrape job
Show answer
B — The level part says which labels survive the aggregation.
Q3. Rules inside one group are evaluated…
- In parallel, in random order
- One after another, in the order written
- Only when someone queries them
- Once at startup
Show answer
B — Sequential evaluation lets a later rule use an earlier rule’s output.
Q4. A rule’s selector has a typo (job=”nodes”). What does the Rules page show?
- An error in red
- Health OK, but the recorded series has no data
- The rule is removed automatically
- Prometheus fails to start
Show answer
B — The PromQL is valid and returns an empty result, which is not an error.
Q5. Why did the lab name the test file recording_test.yml.test?
- promtool only reads .test files
- So the rule_files glob *.yml doesn’t load it as a rule file
- Tests must be hidden from promtool check
- It’s required by YAML
Show answer
B — The glob would otherwise pick up the test file and the reload would fail.
Quick recap
- A recording rule runs a PromQL expression every group interval and stores the answer as a new series named by record.
- Name rules level:metric:operations with letters, digits, underscores and colons; hyphens load in Prometheus 3 but break unquoted queries.
- Rules live in groups in /etc/prometheus/rules/*.yml; rules in a group run in order, groups run in parallel.
- promtool check config and check rules catch YAML and PromQL errors; only promtool test rules catches a rule that returns nothing.
- A failed reload keeps the old rules running, so watch prometheus_config_last_reload_successful.
Next lesson
Lesson 8: Prometheus alerting rules → You build InstanceDown, HostHighCpu, HostDiskWillFillIn24h and HostLowMemory on top of today’s recorded series, watch them go pending and firing, and test them with promtool.
Further reading: Prometheus recording rules
Want to go deeper into Prometheus recording rules? The official recording rules reference, the rule naming best practices and the unit testing for rules page cover everything in this lesson in more depth. For the queries behind these rules see PromQL examples, and for what they cost in storage see the Prometheus TSDB.
You can also see the full plan for this course on the Prometheus Monitoring course page.
