Scrape targets and Node Exporter
-
Phase 1: Prometheus foundations and setup
-
Phase 2: Collect, query and store metrics
-
Phase 3: Alerts and dashboards
So far Prometheus watches only itself. In this lesson you install the Prometheus Node Exporter on node01 and on prom01, so Prometheus can read CPU, memory, disk and network numbers from both Linux machines, and you learn the words every Prometheus job uses: target, job, instance and scrape.
You’ll read the raw /metrics page line by line, switch collectors on and off, publish your own number with the textfile collector, lock port 9100 down with ufw, and then break the scrape twice on purpose so you can recognise “connection refused” and “context deadline exceeded” on sight.
Where this lesson fits
Lesson 4 of 10 in Prometheus Monitoring · Phase 2: Collect, query and store metrics · Before this: Lesson 3, secure Prometheus · Next: Lesson 5, PromQL examples
| Time | You need | By the end you can |
|---|---|---|
| About 90 minutes | prom01 with the secured snapshot from Lesson 3, node01 from Lesson 1, SSH to both as student | Both VMs exporting metrics on 9100, a node job in Prometheus with role labels, and both targets UP on the Target health page |
What it is, in one line
Node Exporter is a small program that turns a Linux machine’s CPU, memory, disk and network figures into a /metrics page that Prometheus can scrape.
In Simple Words
The meter reader and the building
Think of the electricity meter reader who visits your apartment building every month. He doesn’t knock on each flat and ask people how much power they used; there’s a panel of meters near the lift, and he reads them all from one place, in the same format, every time.
The building is the server, the meter panel is Node Exporter and the reader is Prometheus. If he arrives and the panel room is locked, or the watchman never opens the gate, he writes “couldn’t read” in his book, and that blank is itself useful information.
Engineer's View
Targets, jobs, instances and the text format
A target is one HTTP endpoint Prometheus scrapes, such as 192.168.56.61:9100. A job is a named group of targets that do the same thing, such as all Node Exporters. Every series Prometheus stores from a scrape gets two labels added: job (the job_name) and instance (by default the host:port of the target).
| Type | What it means | Example from Node Exporter or Prometheus |
|---|---|---|
| counter | Only goes up; resets to 0 when the process restarts | node_cpu_seconds_total, node_network_receive_bytes_total |
| gauge | Goes up and down; the current value is what matters | node_load1, node_memory_MemAvailable_bytes, node_filesystem_avail_bytes |
| histogram | Counts observations in buckets (le=”…”), plus _sum and _count | prometheus_http_request_duration_seconds_bucket |
| summary | Quantiles worked out by the client, plus _sum and _count | go_gc_duration_seconds{quantile=”0.5″} |
On every scrape Prometheus also writes a few series of its own for each target: up (1 or 0), scrape_duration_seconds, scrape_samples_scraped and scrape_series_added. scrape_interval sets how often a target is scraped and scrape_timeout how long Prometheus waits; the timeout defaults to 10s and can’t be longer than the interval.
Node Exporter splits its work into collectors (cpu, meminfo, filesystem, netdev, loadavg and about forty more). Most are on by default and a few, such as systemd and processes, are off. You turn one on with --collector.NAME, off with --no-collector.NAME, and --collector.disable-defaults switches all of them off so you can list only the ones you want.
How it works, step by step
1One scrape, start to finish
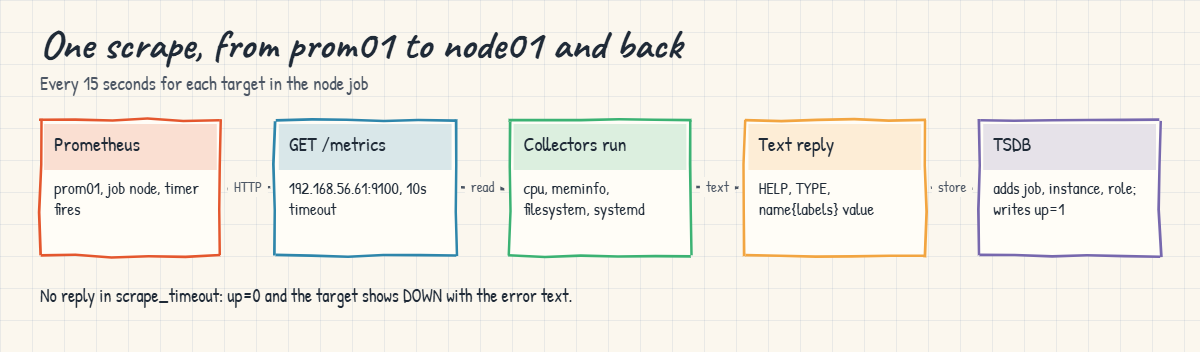
Every 15 seconds Prometheus opens an HTTP connection to each target and sends GET /metrics. Node Exporter runs every enabled collector at that moment, reading files under /proc and /sys, and answers with plain text. Nothing is cached in between, so each scrape is a fresh reading.
The drawing below follows one scrape from prom01 to node01 and back into the TSDB.
2What a /metrics page looks like
Each metric has a # HELP line (a description) and a # TYPE line, then one line per series: name, labels in curly brackets, and a value. This is from Node Exporter 1.12.1:
# HELP node_load1 1m load average.
# TYPE node_load1 gauge
node_load1 0.22
# HELP node_cpu_seconds_total Seconds the CPUs spent in each mode.
# TYPE node_cpu_seconds_total counter
node_cpu_seconds_total{cpu="0",mode="idle"} 797.14
node_cpu_seconds_total{cpu="0",mode="system"} 4.78
node_cpu_seconds_total{cpu="0",mode="user"} 15.07
# HELP node_filesystem_avail_bytes Filesystem space available to non-root users in bytes.
# TYPE node_filesystem_avail_bytes gauge
node_filesystem_avail_bytes{device="/dev/sda2",device_error="",fstype="ext4",mountpoint="/"} 1.9599686656e+10Large numbers use exponent form: 1.9599686656e+10 bytes is about 19.6 GB. Counters end in _total by convention, and units are in the name (_seconds, _bytes), always base units, never milliseconds or megabytes.
3Reading the Target health page
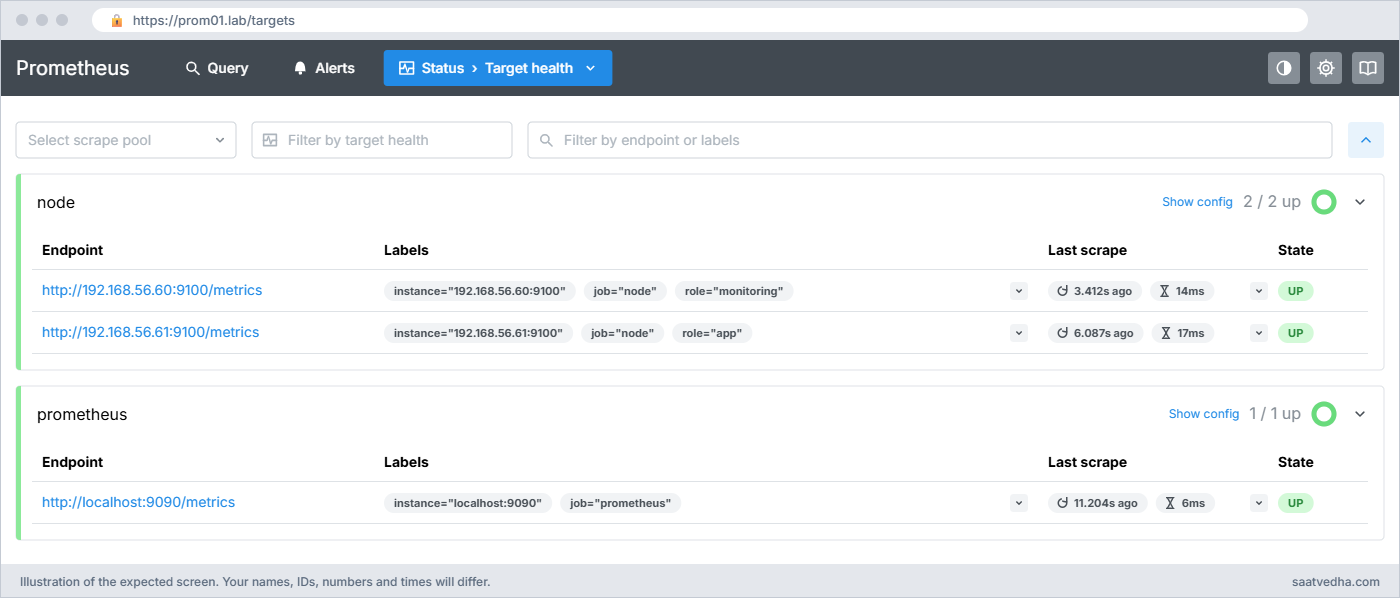
Status > Target health groups targets by job (the UI calls these scrape pools). Each target shows its endpoint, labels, last scrape time, scrape duration and state.
| State | Meaning | Where to look |
|---|---|---|
| UP | The last scrape got a valid response | Nothing to do |
| DOWN | The last scrape failed; the error is shown next to it | The error text tells you the layer |
| UNKNOWN | Not scraped yet, usually right after a reload | Wait one interval |
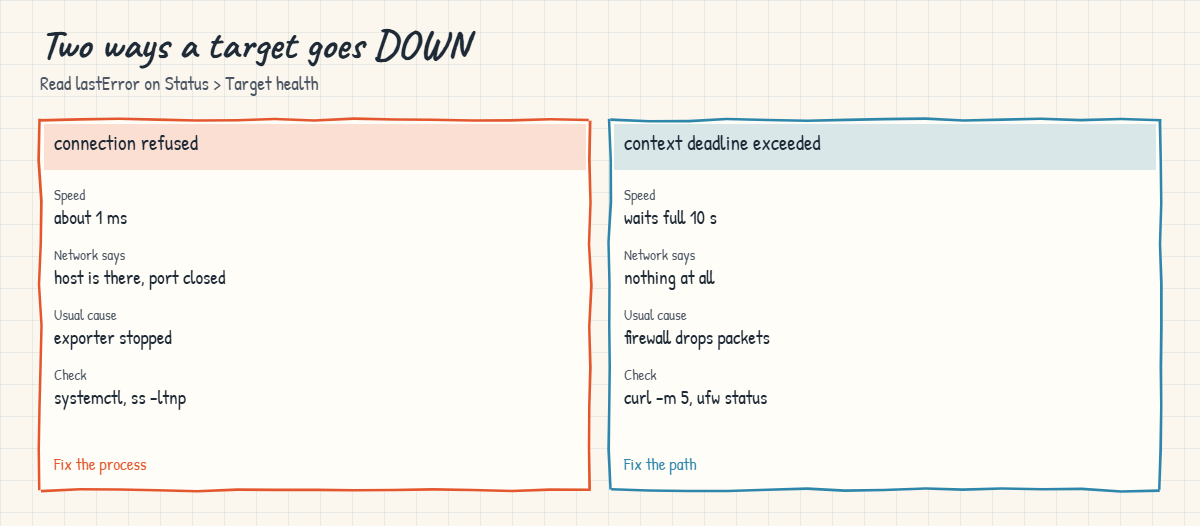
The second drawing shows the two errors you’ll see most often and what each one means on the network.
4Labels, relabelling and finding targets automatically
Labels under a target in static_configs are attached to every series from it, which is how you’ll tell prom01 (role monitoring) from node01 (role app) in queries. relabel_configs goes further: it runs before the scrape and can rewrite labels using regular expressions, for example to show a friendly name instead of the IP.
relabel_configs:
- source_labels: [__address__]
regex: "192.168.56.61:9100"
target_label: instance
replacement: "node01"Tested on Prometheus 3.16, this makes the target show as instance="node01". This course keeps the default host:port instance so that every later lesson’s queries match, but you’ll see this pattern a lot at work.
Typing every server into static_configs doesn’t scale. file_sd_configs reads target lists from YAML or JSON files that a script or Ansible can write, and Prometheus picks up changes without a reload; there are also built-in discovery methods for Kubernetes, EC2, Consul and others. If the files don’t exist yet, promtool warns but still passes:
Checking /etc/prometheus/prometheus.yml
WARNING: file "/etc/prometheus/targets/*.yml" for file_sd in scrape job "node" does not exist
SUCCESS: /etc/prometheus/prometheus.yml is valid prometheus config file syntax Hands-on lab: install Node Exporter on node01 and prom01 and scrape both
Before you run any command, double-check it
Read every command twice before you press Enter. Check the target: the server name, the user, the disk or device name, the path and the sizes. These commands are for learning and were tested in our lab, not on your system. At work, run the read-only commands first, follow your change process, make sure a backup exists, and ask a second person to check anything that changes or deletes data. You run them at your own risk.
Start prom01 (secured snapshot) and node01. Each step says which VM to use. Prometheus on prom01 now listens on 127.0.0.1 only, so you query it with curl localhost:9090 on prom01, or in the browser at https://prom01.lab/ with your password.
1Download and check Node Exporter on node01
Run this on node01:
VER=1.12.1
mkdir -p ~/dl && cd ~/dl
wget -q https://github.com/prometheus/node_exporter/releases/download/v$VER/node_exporter-$VER.linux-amd64.tar.gz
wget -q https://github.com/prometheus/node_exporter/releases/download/v$VER/sha256sums.txt
sha256sum -c sha256sums.txt --ignore-missing
tar xzf node_exporter-$VER.linux-amd64.tar.gz && ls node_exporter-$VER.linux-amd64You should see this:
node_exporter-1.12.1.linux-amd64.tar.gz: OK
LICENSE node_exporter NOTICE✅ Checkpoint: The checksum says OK and the folder has the node_exporter binary.
2Create the user, the textfile folder and install the binary
Run this on node01:
sudo useradd --system --no-create-home --shell /usr/sbin/nologin node_exporter
sudo install -m 755 -o root -g root node_exporter-$VER.linux-amd64/node_exporter /usr/local/bin/
sudo mkdir -p /var/lib/node_exporter/textfile_collector
sudo chown -R node_exporter:node_exporter /var/lib/node_exporter
node_exporter --version | head -1You should see this:
node_exporter, version 1.12.1 (branch: HEAD, revision: 6044da783597cc3b57aef7580ddcdcff58a4ee99)Node Exporter doesn’t need root, and it logs a warning if you run it as root. The textfile folder is where scripts will drop extra metrics in step 6.
✅ Checkpoint: id node_exporter works and node_exporter reports version 1.12.1.
3Write the systemd unit and start it
Paste this whole block on node01:
sudo tee /etc/systemd/system/node_exporter.service >/dev/null <<'EOF'
[Unit]
Description=Prometheus Node Exporter
Documentation=https://github.com/prometheus/node_exporter
Wants=network-online.target
After=network-online.target
[Service]
Type=simple
User=node_exporter
Group=node_exporter
ExecStart=/usr/local/bin/node_exporter \
--collector.systemd \
--collector.textfile.directory=/var/lib/node_exporter/textfile_collector
Restart=on-failure
RestartSec=5s
[Install]
WantedBy=multi-user.target
EOF
sudo systemctl daemon-reload
sudo systemctl enable --now node_exporter
sudo journalctl -u node_exporter --no-pager | grep -E 'Starting|Listening|TLS'You should see this (your times and PID will differ):
Nov 08 07:02:11 node01 node_exporter[1288]: time=2026-11-08T07:02:11.468Z level=INFO source=node_exporter.go:217 msg="Starting node_exporter" version="(version=1.12.1, branch=HEAD, revision=6044da783597cc3b57aef7580ddcdcff58a4ee99)"
Nov 08 07:02:11 node01 node_exporter[1288]: time=2026-11-08T07:02:11.470Z level=INFO source=tls_config.go:372 msg="Listening on" address=[::]:9100
Nov 08 07:02:11 node01 node_exporter[1288]: time=2026-11-08T07:02:11.470Z level=INFO source=tls_config.go:375 msg="TLS is disabled." http2=false address=[::]:9100--collector.systemd turns on a collector that is off by default and exports the state of every systemd unit, so you can alert when a service you care about is failed. --collector.textfile.directory points the textfile collector at your folder. The full list of enabled collectors is also in the journal, under “Enabled collectors”.
✅ Checkpoint: systemctl is-active node_exporter prints active and the journal shows “Listening on” with port 9100.
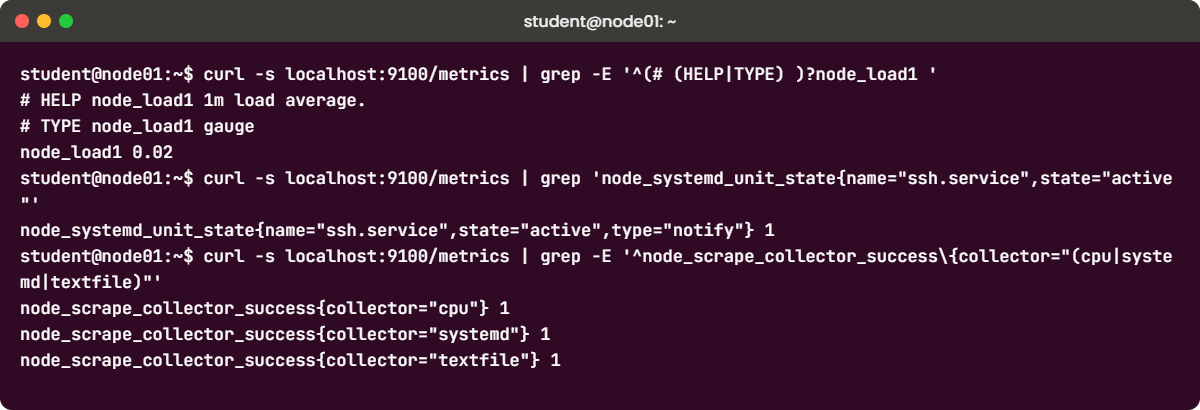
4Read your own /metrics page
Run this on node01:
curl -s localhost:9100/metrics | wc -l
curl -s localhost:9100/metrics | grep -E '^(# (HELP|TYPE) )?node_load1 '
curl -s localhost:9100/metrics | grep 'node_systemd_unit_state{name="ssh.service"'
curl -s localhost:9100/metrics | grep -E '^node_scrape_collector_success\{collector="(cpu|systemd|textfile)"'After the line count from wc, you should see this (your load value will differ):
# HELP node_load1 1m load average.
# TYPE node_load1 gauge
node_load1 0.02
node_systemd_unit_state{name="ssh.service",state="activating",type="notify"} 0
node_systemd_unit_state{name="ssh.service",state="active",type="notify"} 1
node_systemd_unit_state{name="ssh.service",state="deactivating",type="notify"} 0
node_systemd_unit_state{name="ssh.service",state="failed",type="notify"} 0
node_systemd_unit_state{name="ssh.service",state="inactive",type="notify"} 0
node_scrape_collector_success{collector="cpu"} 1
node_scrape_collector_success{collector="systemd"} 1
node_scrape_collector_success{collector="textfile"} 1The line count comes first, and on a small VM it’s in the hundreds or low thousands. The systemd collector writes one series per unit and state, with 1 on the current state. node_scrape_collector_success tells you whether each collector worked on this scrape; a 0 there means a collector is failing and its metrics are missing, even though up is still 1.
✅ Checkpoint: wc shows several hundred lines, node_load1 has HELP and TYPE lines, and all three collectors show success 1.
5Allow 9100 from prom01 only
Run this on node01:
sudo ufw allow OpenSSH
sudo ufw allow from 192.168.56.60 to any port 9100 proto tcp
sudo ufw enable
sudo ufw status numberedYou should see:
Rules updated
Rules updated (v6)
Rules updated
Command may disrupt existing ssh connections. Proceed with operation (y|n)? y
Firewall is active and enabled on system startup
Status: active
To Action From
-- ------ ----
[ 1] OpenSSH ALLOW IN Anywhere
[ 2] 9100/tcp ALLOW IN 192.168.56.60
[ 3] OpenSSH (v6) ALLOW IN Anywhere (v6)The /metrics page shows your kernel version, mount points, network interfaces and running services, so it shouldn’t be open to everyone. Now only prom01 can scrape it. Test from prom01, and from your laptop to see the difference:
Run this on prom01, then the same curl on your laptop:
curl -s -m 5 http://192.168.56.61:9100/metrics | grep '^node_load1 'node_load1 0.04 (from prom01)
(from the laptop: nothing for 5 seconds, then curl gives up quietly with exit code 28)✅ Checkpoint: prom01 gets node_load1 from node01, and the laptop times out.
6Publish your own metric with the textfile collector
Scripts like a nightly backup can’t run a web server, but they can write a file. Node Exporter reads every *.prom file in the folder on each scrape.
Paste this whole block on node01:
D=/var/lib/node_exporter/textfile_collector
cat <<EOF | sudo -u node_exporter tee $D/backup.prom.$$ >/dev/null
# HELP backup_last_success_timestamp_seconds Unix time of the last good backup.
# TYPE backup_last_success_timestamp_seconds gauge
backup_last_success_timestamp_seconds $(date +%s)
EOF
sudo -u node_exporter mv $D/backup.prom.$$ $D/backup.prom
curl -s localhost:9100/metrics | grep -E '^backup_|^node_textfile_scrape_error'You should see this (your timestamp will differ):
backup_last_success_timestamp_seconds 1.794118411e+09
node_textfile_scrape_error 0Writing to a temporary name and then using mv makes the update atomic, so Node Exporter never reads a half-written file. In a real backup script you’d run the same three lines at the end, only when the backup succeeded, and later alert when time() - backup_last_success_timestamp_seconds is more than a day.
✅ Checkpoint: backup_last_success_timestamp_seconds appears in /metrics and node_textfile_scrape_error is 0.
7Install Node Exporter on prom01 too
The monitoring server needs watching as well. Repeat steps 1 to 3 on prom01 with the same commands and unit file. prom01’s ufw (from Lesson 3) doesn’t open 9100, which is right: Prometheus scrapes 192.168.56.60:9100 from the same machine, and Linux sends traffic to its own address through the loopback interface, which ufw allows.
Then run this on prom01:
systemctl is-active node_exporter
curl -s http://192.168.56.60:9100/metrics | grep '^node_load1 'You should see this (your load value will differ):
active
node_load1 0.11✅ Checkpoint: node_exporter is active on prom01 and answers on 192.168.56.60:9100.
8Add the node job with labels
Paste this whole block on prom01:
sudo cp /etc/prometheus/prometheus.yml /etc/prometheus/prometheus.yml.bak
sudo tee -a /etc/prometheus/prometheus.yml >/dev/null <<'EOF'
- job_name: "node"
static_configs:
- targets: ["192.168.56.60:9100"]
labels:
role: "monitoring"
- targets: ["192.168.56.61:9100"]
labels:
role: "app"
EOF
promtool check config /etc/prometheus/prometheus.yml && curl -s -X POST http://localhost:9090/-/reload && echo reloadedYou should see this:
Checking /etc/prometheus/prometheus.yml
SUCCESS: /etc/prometheus/prometheus.yml is valid prometheus config file syntax
reloadedtee -a appends to the end of the file, which works because scrape_configs is the last section and the new job is indented two spaces like the prometheus job. Open the file with cat and check that both - job_name lines line up. The job uses the global 15s interval; you could set scrape_interval and scrape_timeout inside the job to override it.
✅ Checkpoint: promtool says SUCCESS and the reload prints “reloaded”.
9Check targets and query up
Run this on prom01 (wait 15 seconds after the reload):
curl -s 'http://localhost:9090/api/v1/query?query=up' | python3 -c 'import json,sys
for r in json.load(sys.stdin)["data"]["result"]: print(r["metric"]["instance"], r["metric"]["job"], r["metric"].get("role","-"), r["value"][1])'
curl -s 'http://localhost:9090/api/v1/query?query=scrape_samples_scraped' | python3 -c 'import json,sys
for r in json.load(sys.stdin)["data"]["result"]: print(r["metric"]["instance"], r["value"][1])'The first command prints this:
localhost:9090 prometheus - 1
192.168.56.60:9100 node monitoring 1
192.168.56.61:9100 node app 1The small Python part prints one line per series from the JSON answer: instance, job, role and value. The second command then prints each instance with the number of samples its last scrape returned, from a few hundred to a few thousand depending on the collectors. You could use jq instead if you install it, and Lesson 5 does.
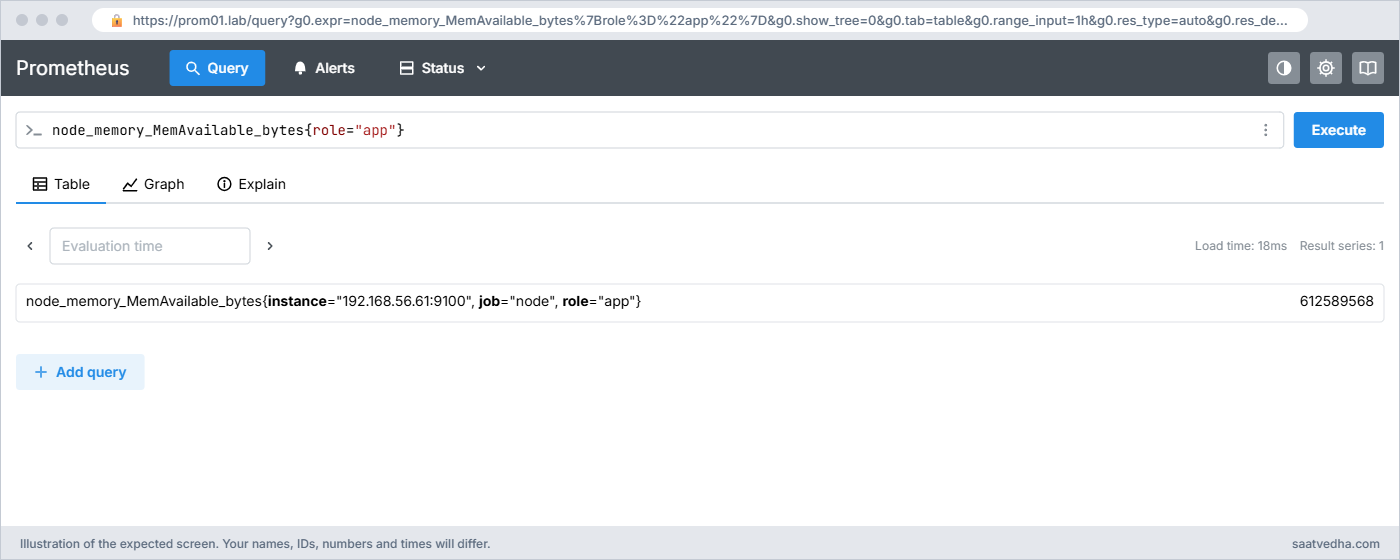
Three targets, all up 1, and the role label you set shows up on each node series. In the browser at https://prom01.lab/ open Status > Target health: the node pool shows 2/2 up with last scrape times a few seconds old. Then try node_memory_MemAvailable_bytes{role="app"} in the Query page.
✅ Checkpoint: up is 1 for localhost:9090, 192.168.56.60:9100 and 192.168.56.61:9100.
Break It, Then Fix It
Two failures that make a target go DOWN, and one that stops Prometheus accepting the config. They undo cleanly, so no snapshot is needed, but take one if you like.
1connection refused: the exporter is stopped
Run this on node01, then the curl on prom01 after 20 seconds:
sudo systemctl stop node_exporter
# on prom01:
curl -s http://localhost:9090/api/v1/targets | python3 -c 'import json,sys
for t in json.load(sys.stdin)["data"]["activeTargets"]: print(t["scrapeUrl"], t["health"], t["lastError"])'You’ll get this error:
http://localhost:9090/metrics up
http://192.168.56.60:9100/metrics up
http://192.168.56.61:9100/metrics down Get "http://192.168.56.61:9100/metrics": dial tcp 192.168.56.61:9100: connect: connection refused“connection refused” comes back in about a millisecond, because node01 is alive and its kernel answered “nothing is listening on 9100” (a TCP reset). So the network and firewall are fine and the exporter process is the problem: stopped, crashed, or listening on a different port.
Fix:
sudo systemctl start node_exporter # on node01
sudo ss -ltnp | grep 9100LISTEN 0 4096 *:9100 *:* users:(("node_exporter",pid=1342,fd=3))✅ Checkpoint: The target shows UP again on the next scrape and up{instance=”192.168.56.61:9100″} is 1.
2context deadline exceeded: the firewall drops the scrape
Run this on node01:
sudo ufw status numbered | grep 9100
sudo ufw delete 2 # the number of the 9100 rule from the line aboveWait 30 seconds and run the same targets command on prom01, or look at the node01 target in Status > Target health.
You’ll get this error:
http://localhost:9090/metrics up
http://192.168.56.60:9100/metrics up
http://192.168.56.61:9100/metrics down Get "http://192.168.56.61:9100/metrics": context deadline exceededThis time nothing answered at all. ufw’s default policy drops the packet silently, so Prometheus waits for the full scrape_timeout (10 seconds) and gives up; scrape_duration_seconds for that target sits at about 10. The same error appears when a server is overloaded and too slow, or when a cloud security group or network firewall in between drops the traffic, so check curl -m 5 from the Prometheus host first.
Fix:
sudo ufw allow from 192.168.56.60 to any port 9100 proto tcp # on node01✅ Checkpoint: The target is UP again and scrape_duration_seconds for node01 is back to a few milliseconds.
3Two jobs with the same name
A colleague adds node01 in a new job block instead of to the existing one, and copies the name.
Run this on prom01:
sudo tee -a /etc/prometheus/prometheus.yml >/dev/null <<'EOF'
- job_name: "node"
static_configs:
- targets: ["192.168.56.62:9100"]
EOF
promtool check config /etc/prometheus/prometheus.ymlYou’ll get this error:
Checking /etc/prometheus/prometheus.yml
FAILED: parsing YAML file /etc/prometheus/prometheus.yml: found multiple scrape configs with job name "node"Every job_name must be unique, because it becomes the job label and the name of the scrape pool. A reload with this file would fail and keep the old config; a restart would leave Prometheus down. To add a server, put it under the existing job’s targets, or give a new job its own name.
Fix: remove the last four lines you added, then check:
sudo head -n -4 /etc/prometheus/prometheus.yml | sudo tee /etc/prometheus/prometheus.yml.new >/dev/null
sudo mv /etc/prometheus/prometheus.yml.new /etc/prometheus/prometheus.yml
sudo chown prometheus:prometheus /etc/prometheus/prometheus.yml
promtool check config /etc/prometheus/prometheus.ymlIf you’d rather not count lines, open the file in nano and delete the second node block by hand.
✅ Checkpoint: promtool says SUCCESS and the file has one job named node with two targets.
This happened at work
Half the network went quiet at 2 am
I was on the night shift in a telecom NOC in Hyderabad when the Prometheus alert for up == 0 fired for about 140 of our 300 Linux servers within five minutes. The graphs for those boxes stopped, and the shift lead’s first thought was that Node Exporter had crashed after the evening’s patching.
We restarted node_exporter on three of them, and nothing changed. Then someone ran curl localhost:9100/metrics on one server and got a full page, so the exporter was fine. The Target health page said context deadline exceeded for every failed target, not “connection refused”, and a curl -m 5 from the Prometheus server to one of them hung and timed out.
The cause was a new firewall baseline the security team had pushed with the patches. It allowed only a fixed list of ports, and 9100 wasn’t on it, so packets were dropped silently. We added a rule allowing 9100 from our two Prometheus servers only, and the targets came back on the next scrape.
Two things changed after that night. The firewall baseline now includes the monitoring ports, with the Prometheus servers as the only allowed source, and our runbook starts with one line: “connection refused means the process, deadline exceeded means the network”.
Common mistakes and troubleshooting
| Mistake | What happens | What to do instead |
|---|---|---|
| Running node_exporter as root | It works, but a bug in any collector runs with full rights, and it logs a warning | Use the node_exporter system user |
| Leaving 9100 open to every network | Anyone can read your kernel version, mounts and running services | Allow 9100 only from the Prometheus servers with ufw or a security group |
| Writing the textfile .prom directly | Node Exporter can read a half-written file and report a parse error | Write to a temp file and mv it into place |
| Setting scrape_timeout higher than scrape_interval | promtool fails with “scrape timeout greater than scrape interval” | Keep the timeout at or below the interval |
| Adding a new job block with an existing job_name | Config fails with “found multiple scrape configs with job name” | Add targets to the existing job, or give the job a new name |
| Turning on every optional collector | Many more series, slower scrapes, more memory in Prometheus | Enable only what you will query, like systemd or processes |
| Treating up == 1 as “all metrics are fine” | A failing collector drops its metrics while the scrape still succeeds | Also watch node_scrape_collector_success == 0 |
Interview questions
Click a question to open it. Each one is written the way an interviewer would ask it. Under it you will see why they ask it and one way you could answer, in your own words.
Fresher level
1. What are a job and an instance in Prometheus?
Why they ask this: They want the basic vocabulary used on every Prometheus page.
How you might answer: A job is a named group of targets that do the same thing, set by job_name in scrape_configs, like node for all Node Exporters. An instance is one target in that job, by default its host and port such as 192.168.56.61:9100. Prometheus adds both as labels to every series it scrapes.
2. What is the difference between a counter and a gauge? Give one Node Exporter example of each.
Why they ask this: A basic check that you can read metrics correctly before querying them.
How you might answer: A counter only goes up and resets to zero on restart, like node_network_receive_bytes_total or node_cpu_seconds_total, so I look at its rate. A gauge goes up and down and its current value matters, like node_memory_MemAvailable_bytes or node_load1.
2–5 years experience
3. A target shows DOWN. How do you tell whether it’s the exporter or the network?
Why they ask this: They want you to read the error text instead of restarting things at random.
How you might answer: I read the lastError on the Target health page. “connection refused” comes back instantly and means the host is reachable but nothing listens on the port, so I check systemctl status node_exporter and ss -ltnp on that host.
“context deadline exceeded” means nothing answered within scrape_timeout, so it’s usually a firewall silently dropping packets or an overloaded host. I run curl -m 5 to the target from the Prometheus server and check ufw or the security group.
4. How would you get the result of a nightly backup script into Prometheus?
Why they ask this: They’re checking that you know the textfile collector and the push problem for short jobs.
How you might answer: The script can’t be scraped because it finishes and exits, so at the end of a successful run it writes backup_last_success_timestamp_seconds with the current time to a .prom file in Node Exporter’s textfile folder, writing to a temp file and using mv so the update is atomic.
Then I alert when time() minus that metric is more than about 26 hours. For jobs on hosts without Node Exporter, Pushgateway is the other option.
Senior level
5. You have 2,000 servers that come and go. How would you manage scrape targets?
Why they ask this: They want to see you move past static_configs to discovery and automation.
How you might answer: I wouldn’t list them by hand. If they’re in a cloud or Kubernetes I’d use the built-in service discovery, such as ec2_sd_configs or kubernetes_sd_configs, and relabel_configs to keep only the ones with the right tag and to turn cloud metadata into labels like role and env.
For on-prem servers I’d have Ansible or the CMDB write file_sd_configs JSON files, which Prometheus watches without a reload. Either way I’d keep label names consistent across teams so dashboards and alerts work everywhere.
6. Node Exporter on a busy host is adding a lot of series. How would you reduce it?
Why they ask this: They are checking practical cardinality control at both ends.
How you might answer: On the exporter I’d turn off collectors we never query, or use the collector’s own filters, for example the filesystem mount point and type excludes and the systemd unit include and exclude flags. That reduces work on the host too.
On the Prometheus side I’d use metric_relabel_configs to drop specific metrics or label values after the scrape, and I’d check Status > TSDB status to confirm which metric names have the most series before and after.
Quick quiz
Q1. Which port does Node Exporter listen on by default?
- 9090
- 9093
- 9100
- 3000
Show answer
C — Node Exporter uses 9100; 9090 is Prometheus, 9093 Alertmanager and 3000 Grafana.
Q2. A target shows “connect: connection refused”. What is the most likely cause?
- A firewall silently drops the traffic
- Nothing is listening on that port on the target host
- scrape_interval is too short
- Prometheus is out of disk space
Show answer
B — Connection refused is an immediate TCP reset from a reachable host with no listener on that port.
Q3. What type is node_network_receive_bytes_total?
- gauge
- counter
- histogram
- summary
Show answer
B — It only goes up (until restart) and ends in _total, so it is a counter.
Q4. How do you enable a Node Exporter collector that is off by default, such as systemd?
- Add it to prometheus.yml
- Use the collector.systemd flag on node_exporter
- Restart Prometheus with the systemd flag
- Put a file in the textfile folder
Show answer
B — Collectors are switched on with the collector.NAME flag on the exporter itself.
Q5. Prometheus refuses a config with “found multiple scrape configs with job name”. What do you do?
- Restart Prometheus
- Make each job_name unique, or add targets to the existing job
- Increase scrape_timeout
- Delete the TSDB
Show answer
B — Every job_name must be unique in scrape_configs.
Quick recap
- A target is one /metrics endpoint, a job groups targets, and Prometheus adds job and instance labels to every series.
- Metric types are counter, gauge, histogram and summary, and every scrape also writes up, scrape_duration_seconds and scrape_samples_scraped.
- Node Exporter runs as its own user on 9100, with collectors switched on or off by flags and a textfile folder for script metrics.
- ufw on node01 allows 9100 only from 192.168.56.60, and the node job scrapes both VMs with role labels.
- “connection refused” points at the exporter process, “context deadline exceeded” at the network or firewall.
Next lesson
Lesson 5: PromQL examples you will use every day → Now that real Linux metrics are flowing in, you learn PromQL by writing the queries you’ll use daily: CPU, memory, disk, network and “when will this disk fill up”.
Further reading: Prometheus Node Exporter
Want to go deeper into Prometheus Node Exporter? The official Node Exporter guide, the node_exporter project page with the full collector list, the metric types and exposition format pages, and the scrape_config reference cover everything in this lesson. To understand the Linux numbers behind these metrics, read Linux performance monitoring, and Lesson 3 explains why Prometheus is only on localhost now.
You can also see the full plan for this course on the Prometheus Monitoring course page.
