Prometheus Alertmanager: routing alerts to email
-
Phase 1: Prometheus foundations and setup
-
Phase 2: Collect, query and store metrics
-
Phase 3: Alerts and dashboards
Prometheus Alertmanager is the part that turns a firing alert into a message a person reads. In Lesson 8 your InstanceDown alert went red on the Alerts page, but nobody’s phone buzzed. Today you install Alertmanager 0.34 on prom01, connect Prometheus to it, and get that alert delivered as a real email to a local mail catcher called Mailpit, so you can test everything without a mail server or an internet account.
You’ll also group alerts so ten dead servers make one email instead of ten, silence an alert during planned work with amtool, and use inhibition so a dead host doesn’t also spam you with its memory and disk warnings.
Where this lesson fits
Lesson 9 of 10 in Prometheus Monitoring · Phase 3: Alerts and dashboards · Before this: Lesson 8, alerting rules · Next: Lesson 10, Grafana dashboards
| Time | You need | By the end you can |
|---|---|---|
| About 90 minutes | prom01 and node01 with the four alerts from Lesson 8 loaded, sudo on prom01, and a browser on your laptop | InstanceDown arriving as an email in Mailpit, a silence you created with amtool, and an inhibit rule you watched in action |
What it is, in one line
Alertmanager receives firing alerts from Prometheus, groups the related ones together, drops anything silenced or inhibited, and sends the rest to people by email, chat or paging tools.
In Simple Words
The school office during exam week
Picture a school office on a rainy exam morning. Twenty teachers ring the office within five minutes to say a student hasn’t come. The clerk doesn’t call twenty parents in a panic; she waits a couple of minutes, notices that all twenty students are from the same bus route, and makes one call to the bus contractor.
If the principal has already said “bus route 4 is cancelled today”, she ignores those calls completely, and if the whole school has a power cut she doesn’t bother reporting that the fans in each class have stopped. Alertmanager is that clerk: it waits, groups, checks the notice board and then makes the smallest number of useful calls.
Engineer's View
How Alertmanager handles an alert
Alertmanager is a separate Go binary with its own config file, alertmanager.yml, and its own small storage folder for silences and the notification log. Prometheus finds it through the alerting block in prometheus.yml and sends alerts as JSON to /api/v2/alerts, re-sending every firing alert about once a minute so Alertmanager knows it’s still active.
| Config piece | What it does | Our lab value |
|---|---|---|
| global | Defaults shared by receivers, such as the SMTP server | smtp_smarthost 127.0.0.1:1025, smtp_require_tls false |
| route | The tree that picks a receiver from the alert’s labels | one root route to team-email |
| group_by | Labels that make alerts belong to the same notification | alertname, job |
| group_wait | How long to wait for more alerts before the first message of a new group | 30s |
| group_interval | How long to wait before telling a group about new or changed alerts | 5m |
| repeat_interval | How often to remind about alerts that are still firing and unchanged | 4h |
| receivers | Where messages go: email_configs, slack_configs, webhook_configs, msteamsv2_configs and more | team-email to oncall@lab.local |
| inhibit_rules | Mute target alerts while a matching source alert fires | InstanceDown mutes warnings for the same instance |
Silences are made at run time (through the web UI, the API or amtool) and saved in the data folder, so they survive restarts and never need a config change. For high availability you run two or three Alertmanagers that share silences and the notification log over a gossip port, 9094 by default, and point Prometheus at all of them; with one node in a lab we switch that clustering off.
How it works, step by step
1Prometheus sends the firing alert
When InstanceDown turns firing, Prometheus posts it to every Alertmanager in its alerting block. The alert carries its labels (alertname, instance, job, severity, role), its annotations and a start time, and Prometheus keeps sending it while it stays active.
2Alertmanager matches a route and a group
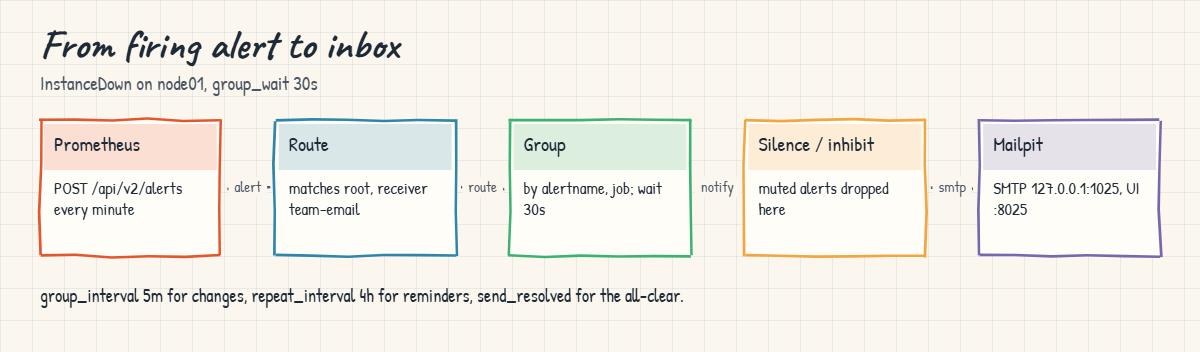
The alert walks down the route tree from the top until it finds the most specific matching route, which names the receiver. The group_by labels then decide which bucket it joins: with [alertname, job] every InstanceDown for job node lands in the same group, whatever the instance. The diagram below follows one alert all the way to Mailpit.
3Waiting, then one message per group
A brand new group waits group_wait (30 seconds) so that alerts arriving together go out together; if node01 and node02 both die, you get “[FIRING:2] InstanceDown” in one mail. After that, new alerts joining the group are batched every group_interval, and if nothing changes, a reminder goes out after repeat_interval.
4Silences and inhibition are checked before sending
Right before a notification, Alertmanager drops alerts that match an active silence (someone said “I know, I’m patching node01”) and alerts muted by an inhibit rule (the host is down, so its warnings are noise). The muted alerts still show in the UI as suppressed, and they come back on their own when the silence ends or the source alert resolves. The stack below shows the order of these checks.
5Receivers other than email
Email is the easiest to test in a lab, but the same routing feeds any receiver. At work you’ll usually see a route tree that sends severity="critical" to a paging tool and everything else to a chat channel.
| Receiver block | Sends to | Notes |
|---|---|---|
| email_configs | Any SMTP server | Needs smarthost, from and usually TLS and auth |
| slack_configs | A Slack channel | Incoming webhook URL or app token |
| msteamsv2_configs | Microsoft Teams | Uses a Teams workflow webhook URL |
| webhook_configs | Your own HTTP endpoint | JSON payload, good for ticketing tools and custom bots |
| pagerduty_configs, opsgenie_configs | Paging tools | For critical alerts that must wake someone |
Hands-on lab: Alertmanager, Mailpit and your first alert email
Before you run any command, double-check it
Read every command twice before you press Enter. Check the target: the server name, the user, the disk or device name, the path and the sizes. These commands are for learning and were tested in our lab, not on your system. At work, run the read-only commands first, follow your change process, make sure a backup exists, and ask a second person to check anything that changes or deletes data. You run them at your own risk.
Everything runs on prom01 unless the step says otherwise. Alertmanager will listen on 9093 and Mailpit catches mail on 127.0.0.1:1025 and shows it on a web page at 8025. Take a snapshot of prom01 first (call it “before-alertmanager”) so you can roll back if something goes wrong.
1Download and verify Alertmanager
Run this on prom01:
VER=0.34.2
cd /tmp
wget -q https://github.com/prometheus/alertmanager/releases/download/v$VER/alertmanager-$VER.linux-amd64.tar.gz
wget -q https://github.com/prometheus/alertmanager/releases/download/v$VER/sha256sums.txt
sha256sum -c --ignore-missing sha256sums.txt
tar xzf alertmanager-$VER.linux-amd64.tar.gz
ls alertmanager-$VER.linux-amd64You should see this:
alertmanager-0.34.2.linux-amd64.tar.gz: OK
LICENSE NOTICE alertmanager alertmanager.yml amtoolThe checksum line must say OK before you go further. The tarball holds two programs: alertmanager (the server) and amtool (the command-line client that checks config, lists alerts and manages silences).
✅ Checkpoint: sha256sum says OK and the folder holds alertmanager and amtool.
2Create the user, folders and binaries
Paste this whole block:
VER=0.34.2
sudo useradd --system --no-create-home --shell /usr/sbin/nologin alertmanager
sudo install -m 0755 /tmp/alertmanager-$VER.linux-amd64/alertmanager /tmp/alertmanager-$VER.linux-amd64/amtool /usr/local/bin/
sudo mkdir -p /etc/alertmanager /var/lib/alertmanager
sudo chown alertmanager:alertmanager /var/lib/alertmanager
alertmanager --version | head -1
amtool --version | head -1You should see this:
alertmanager, version 0.34.2 (branch: HEAD, revision: e8349048265ccc0871c3d0d668b05eacc68baf50)
amtool, version 0.34.2 (branch: HEAD, revision: e8349048265ccc0871c3d0d668b05eacc68baf50)Same pattern as Prometheus in Lesson 2: a system user with no shell, binaries owned by root, and only the data folder writable by the service.
✅ Checkpoint: Both alertmanager and amtool report version 0.34.2.
3Install Mailpit as a local mail catcher
Mailpit is a small open-source SMTP server that accepts every mail and shows it on a web page instead of delivering it. It’s perfect for testing alert email without a real mail account.
Paste this whole block:
MPVER=1.33.1
cd /tmp
wget -q https://github.com/axllent/mailpit/releases/download/v$MPVER/mailpit-linux-amd64.tar.gz
tar xzf mailpit-linux-amd64.tar.gz mailpit
sudo install -m 0755 mailpit /usr/local/bin/mailpit
sudo useradd --system --no-create-home --shell /usr/sbin/nologin mailpit
sudo mkdir -p /var/lib/mailpit && sudo chown mailpit:mailpit /var/lib/mailpit
sudo tee /etc/systemd/system/mailpit.service >/dev/null <<'EOF'
[Unit]
Description=Mailpit test mail server
After=network-online.target
[Service]
User=mailpit
Group=mailpit
ExecStart=/usr/local/bin/mailpit --smtp 127.0.0.1:1025 --listen 0.0.0.0:8025 --database /var/lib/mailpit/mailpit.db
Restart=on-failure
[Install]
WantedBy=multi-user.target
EOF
sudo systemctl daemon-reload
sudo systemctl enable --now mailpit
sudo journalctl -u mailpit -n 4 --no-pagerYou should see this (each line starts with the date and time, cut here as “…”):
... level=info msg="[smtpd] starting on 127.0.0.1:1025 (no encryption)"
... level=warning msg="[http] listening on 0.0.0.0:8025 without --ui-auth-file or --allowed-hosts; the API is reachable from any host that can route to this interface"
... level=info msg="[http] starting on 0.0.0.0:8025"
... level=info msg="[http] accessible via http://0.0.0.0:8025/"SMTP listens only on localhost, so only programs on prom01 can send mail through it. The web page listens on all interfaces, and Mailpit warns about that; in step 6 ufw lets only your laptop reach it. Note “(no encryption)”: Mailpit doesn’t offer STARTTLS unless you give it a certificate, which matters in the Break It section.
✅ Checkpoint: mailpit.service is running and the journal shows SMTP on 127.0.0.1:1025.
4Write alertmanager.yml and check it
Paste this whole block:
sudo tee /etc/alertmanager/alertmanager.yml >/dev/null <<'EOF'
global:
smtp_smarthost: '127.0.0.1:1025'
smtp_from: 'alertmanager@prom01.lab'
smtp_require_tls: false
route:
receiver: team-email
group_by: ['alertname', 'job']
group_wait: 30s
group_interval: 5m
repeat_interval: 4h
receivers:
- name: team-email
email_configs:
- to: 'oncall@lab.local'
send_resolved: true
inhibit_rules:
- source_matchers: [alertname="InstanceDown"]
target_matchers: [severity="warning"]
equal: [instance]
EOF
sudo chown root:alertmanager /etc/alertmanager/alertmanager.yml
sudo chmod 640 /etc/alertmanager/alertmanager.yml
amtool check-config /etc/alertmanager/alertmanager.ymlYou should see this:
Checking '/etc/alertmanager/alertmanager.yml' SUCCESS
Found:
- global config
- route
- 1 inhibit rules
- 1 receivers
- 0 templates
smtp_require_tls: false is needed because Alertmanager insists on STARTTLS by default, and Mailpit on localhost doesn’t offer it. With a real mail server you’d leave TLS on and add smtp_auth_username and smtp_auth_password_file. Email receivers don’t send “resolved” mails unless you ask, hence send_resolved: true.
The file is readable by the alertmanager group only (640), because at work it holds SMTP passwords and webhook URLs. If amtool says permission denied as student, run it with sudo.
✅ Checkpoint: amtool check-config prints SUCCESS with 1 receiver and 1 inhibit rule.
5Run Alertmanager as a systemd service
Paste this whole block:
sudo tee /etc/systemd/system/alertmanager.service >/dev/null <<'EOF'
[Unit]
Description=Prometheus Alertmanager
Wants=network-online.target
After=network-online.target
[Service]
Type=simple
User=alertmanager
Group=alertmanager
ExecStart=/usr/local/bin/alertmanager \
--config.file=/etc/alertmanager/alertmanager.yml \
--storage.path=/var/lib/alertmanager \
--web.listen-address=:9093 \
--web.external-url=http://prom01.lab:9093/ \
--cluster.listen-address=
ExecReload=/bin/kill -HUP $MAINPID
Restart=on-failure
[Install]
WantedBy=multi-user.target
EOF
sudo systemctl daemon-reload
sudo systemctl enable --now alertmanager
sudo journalctl -u alertmanager -n 4 --no-pager -o cat
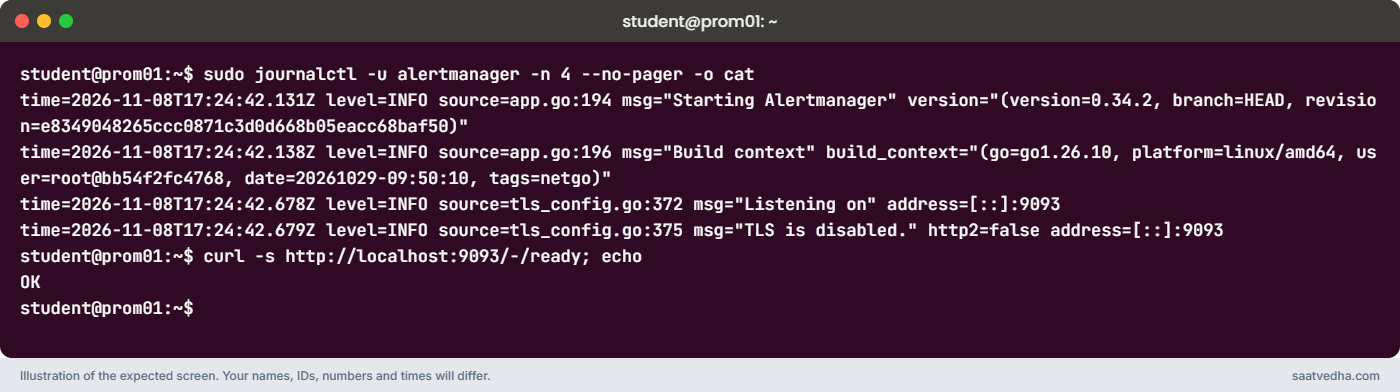
curl -s http://localhost:9093/-/ready; echoYou should see this (your times will differ):
time=2026-11-08T17:24:42.131Z level=INFO source=app.go:194 msg="Starting Alertmanager" version="(version=0.34.2, branch=HEAD, revision=e8349048265ccc0871c3d0d668b05eacc68baf50)"
time=2026-11-08T17:24:42.138Z level=INFO source=app.go:196 msg="Build context" build_context="(go=go1.26.10, platform=linux/amd64, user=root@bb54f2fc4768, date=20261029-09:50:10, tags=netgo)"
time=2026-11-08T17:24:42.678Z level=INFO source=tls_config.go:372 msg="Listening on" address=[::]:9093
time=2026-11-08T17:24:42.679Z level=INFO source=tls_config.go:375 msg="TLS is disabled." http2=false address=[::]:9093
OK-o cat prints only the messages, without the date, host name and PID that journalctl normally puts in front. address=[::]:9093 is one socket that takes both IPv6 and IPv4 connections on port 9093. IPv6 is on by default in Ubuntu 26.04, so this is the line you’ll get. On a VM with IPv6 switched off, the same two lines say address=0.0.0.0:9093.
![Prometheus Alertmanager start-up on prom01: journalctl shows Listening on address=[::]:9093 and /-/ready returns OK](https://saatvedha.com/wp-content/uploads/2026/11/prometheus-alertmanager-screen-3.png)
An empty --cluster.listen-address= switches off the gossip port 9094, which a single Alertmanager doesn’t need. --web.external-url is the address put into the “View in Alertmanager” link of every email, so it must be a name your laptop can open.
✅ Checkpoint: alertmanager.service is active and /-/ready returns OK.
6Open 9093 and 8025 to your laptop only
Run this on prom01:
sudo ufw allow from 192.168.56.1 to any port 9093 proto tcp
sudo ufw allow from 192.168.56.1 to any port 8025 proto tcp
sudo ufw status | grep -E '9093|8025'You should see this:
9093/tcp ALLOW 192.168.56.1
8025/tcp ALLOW 192.168.56.1Now browse from the laptop to http://prom01.lab:9093 for the Alertmanager UI and http://prom01.lab:8025 for the Mailpit inbox. Alertmanager has no login of its own, so at work you’d put it behind the same Nginx and basic auth you built for Prometheus in Lesson 3.
✅ Checkpoint: Both pages open from your laptop and nothing else can reach those ports.
7Point Prometheus at Alertmanager
Open /etc/prometheus/prometheus.yml with sudo nano and add the alerting block above rule_files, plus a scrape job for Alertmanager’s own metrics at the end of scrape_configs.
Add these parts:
alerting:
alertmanagers:
- static_configs:
- targets: ['localhost:9093']
# ...under scrape_configs:
- job_name: alertmanager
static_configs:
- targets: ['localhost:9093']Then run this:
promtool check config /etc/prometheus/prometheus.yml
curl -s -X POST http://localhost:9090/-/reload
curl -s http://localhost:9090/api/v1/alertmanagers | jq -c .dataYou should see:
Checking /etc/prometheus/prometheus.yml
SUCCESS: 2 rule files found
SUCCESS: /etc/prometheus/prometheus.yml is valid prometheus config file syntax
Checking /etc/prometheus/rules/alerts.yml
SUCCESS: 4 rules found
Checking /etc/prometheus/rules/recording.yml
SUCCESS: 3 rules found
{"activeAlertmanagers":[{"url":"http://localhost:9093/api/v2/alerts"}],"droppedAlertmanagers":[]}activeAlertmanagers lists the address Prometheus will post alerts to. If it’s empty, the alerting block is in the wrong place or indented wrongly. On Status > Target health you’ll also see the new alertmanager job as UP.
✅ Checkpoint: /api/v1/alertmanagers shows http://localhost:9093/api/v2/alerts as active.
8Fire InstanceDown and read the email
Run this on node01:
sudo systemctl stop node_exporterWait about two minutes, then run this on prom01:
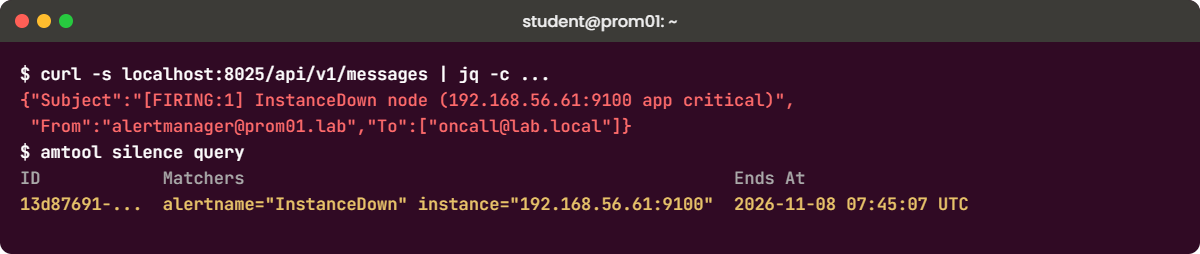
curl -s http://localhost:8025/api/v1/messages | jq -c '.messages[] | {Subject, From: .From.Address, To: [.To[].Address]}'You should see:
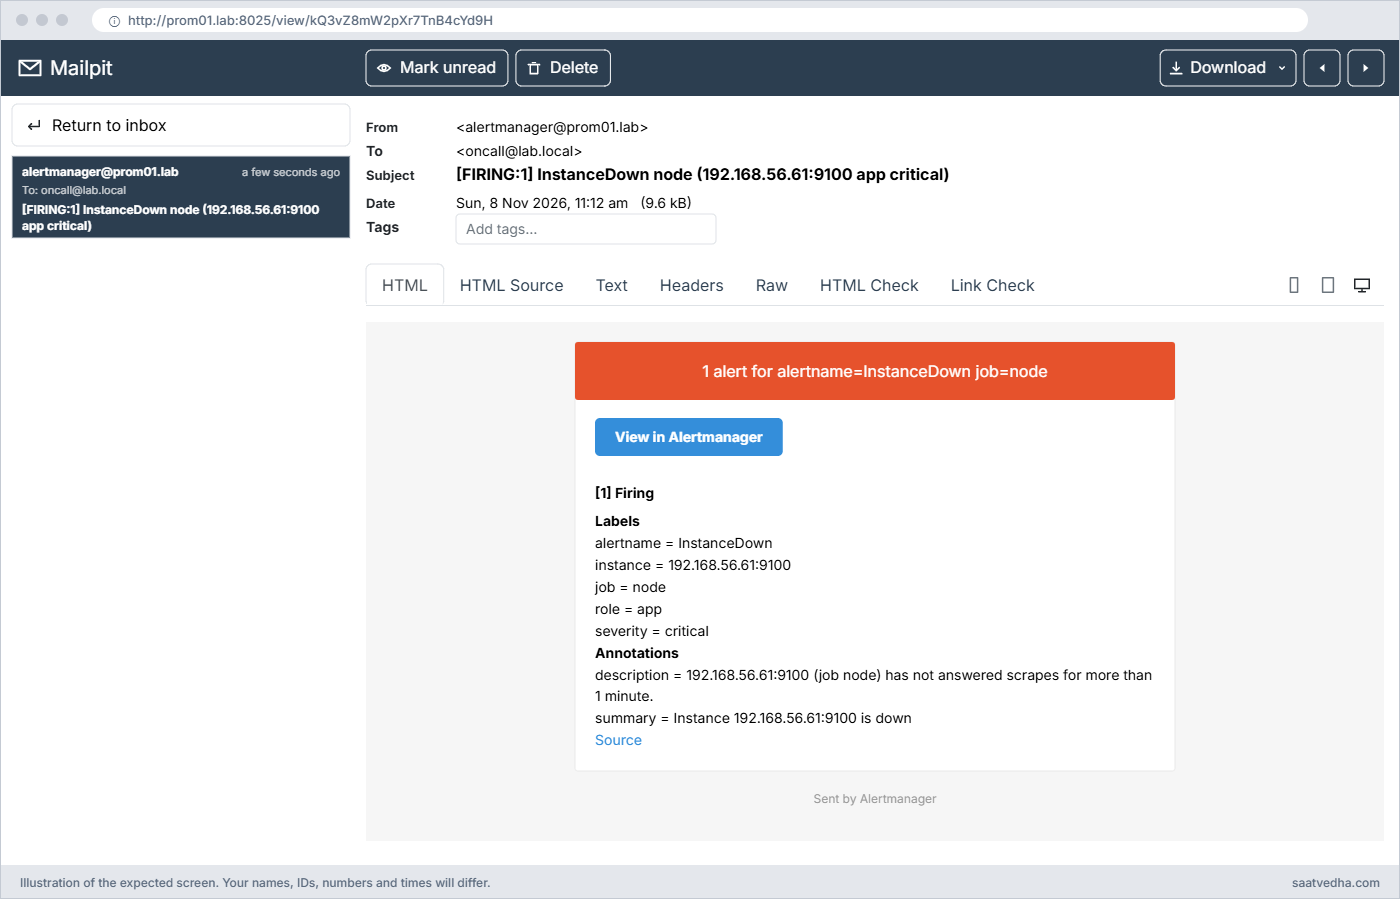
{"Subject":"[FIRING:1] InstanceDown node (192.168.56.61:9100 app critical)","From":"alertmanager@prom01.lab","To":["oncall@lab.local"]}The timing adds up: about 15 seconds for the failed scrape and first evaluation, one minute of for, then 30 seconds of group_wait. The subject shows the group labels (InstanceDown node) and, in brackets, the labels that differ. Open the mail in the Mailpit page to see the full body:
1 alert for alertname=InstanceDown job=node
View in Alertmanager ( http://prom01.lab:9093/#/alerts?receiver=team-email ) *[1] Firing* *Labels*
alertname = InstanceDown
instance = 192.168.56.61:9100
job = node
role = app
severity = critical
*Annotations*
description = 192.168.56.61:9100 (job node) has not answered scrapes for more than 1 minute.
summary = Instance 192.168.56.61:9100 is down
Source ( https://prom01.lab/graph?g0.expr=up%7Bjob%3D%22node%22%7D+%3D%3D+0&g0.tab=1 )
✅ Checkpoint: Mailpit has a [FIRING:1] InstanceDown email for 192.168.56.61:9100.
9Watch inhibition mute a warning
While node01 is still down, pretend its memory warning also fired. amtool alert add posts a test alert straight to Alertmanager. First save the URL so you don’t type it every time:
Run this on prom01:
mkdir -p ~/.config/amtool
echo 'alertmanager.url: http://localhost:9093' > ~/.config/amtool/config.yml
amtool alert add HostLowMemory severity=warning job=node instance=192.168.56.61:9100 --annotation='summary="Low memory test"'
amtool alert query
amtool alert query --inhibitedYou should see this (your times will differ):
Alertname Starts At Summary State
InstanceDown 2026-11-08 05:41:21 UTC Instance 192.168.56.61:9100 is down active
Alertname Starts At Summary State
HostLowMemory 2026-11-08 05:44:18 UTC Low memory test suppressed Plain alert query hides muted alerts, so only InstanceDown appears. With --inhibited you see HostLowMemory as suppressed, because a firing InstanceDown has the same instance label. No email goes out for it.
Put the value in quotes inside --annotation; newer amtool versions warn about unquoted values with spaces.
✅ Checkpoint: HostLowMemory for 192.168.56.61:9100 shows as suppressed and no email arrives for it.
10Silence node01 during planned work, then bring it back
Run this on prom01:
amtool silence add alertname=InstanceDown instance=192.168.56.61:9100 --duration=2h --comment="node01 maintenance, patching"
amtool silence query
amtool alert query --silencedYou should see this (your silence ID and times will differ):
13d87691-aa9b-4656-a893-e00715068e29
ID Matchers Ends At Created By Comment
13d87691-aa9b-4656-a893-e00715068e29 alertname="InstanceDown" instance="192.168.56.61:9100" 2026-11-08 07:45:07 UTC student node01 maintenance, patching
Alertname Starts At Summary State
InstanceDown 2026-11-08 05:41:21 UTC Instance 192.168.56.61:9100 is down suppressed 
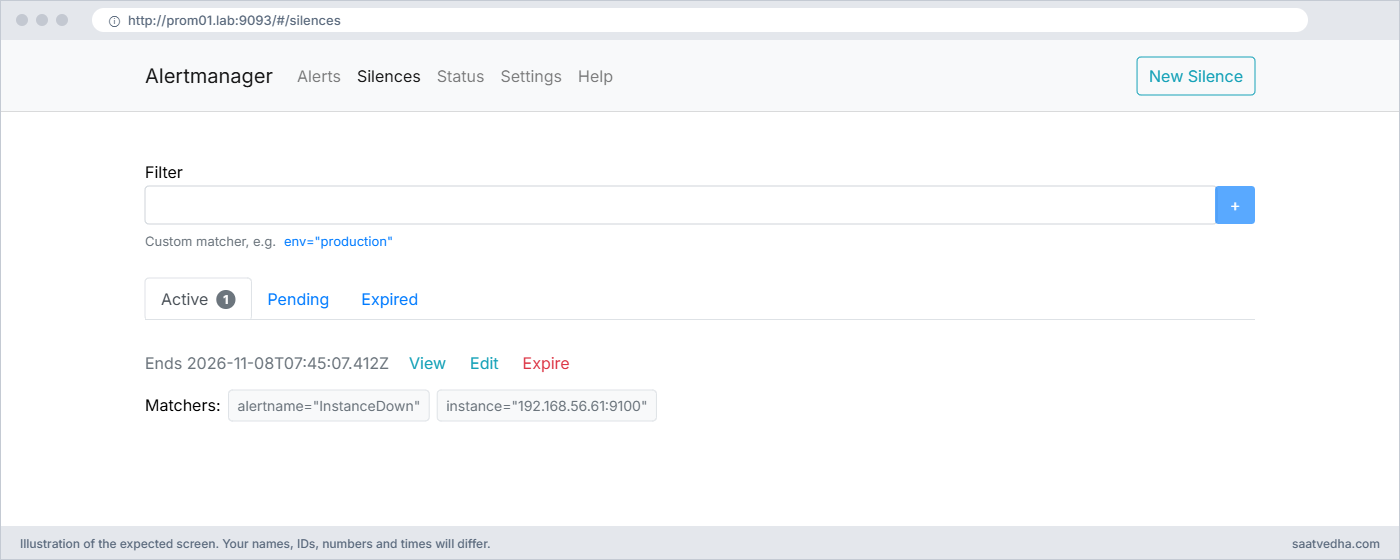
The first line is the silence ID. Created By defaults to your Linux user name; use --author to set a real name. While the silence lasts, no reminders go out after repeat_interval.
Now finish the “maintenance”, expire the silence and start node01’s exporter:
Run this (the silence expire on prom01, the start on node01):
amtool silence expire $(amtool silence query -q)
# on node01:
sudo systemctl start node_exportersilence query -q prints only IDs, which is handy for scripts. Within about five minutes (the group_interval) Mailpit gets a second mail whose subject starts with [RESOLVED].
✅ Checkpoint: The silence is gone, node01 is UP and Mailpit holds both a FIRING and a RESOLVED InstanceDown email.
Break It, Then Fix It
Three ways alert email goes quiet. Each one looks like “Alertmanager is broken” from the outside, and each one has a different log line telling you the truth.
1A config error that amtool catches
Rename the receiver in the route but not in the receivers list, which happens a lot when someone tidies names:
Run this:
sudo sed -i 's/ receiver: team-email/ receiver: team-mail/' /etc/alertmanager/alertmanager.yml
sudo amtool check-config /etc/alertmanager/alertmanager.ymlYou’ll get this error:
Checking '/etc/alertmanager/alertmanager.yml' FAILED: undefined receiver "team-mail" used in route
amtool: error: failed to validate 1 file(s)
If you reload Alertmanager with this file, it logs the same error and keeps running the old config, the same as Prometheus does with bad rules. A restart, though, would fail and leave you with no alerting at all. Other common messages are yaml: line 10: could not find expected ':' for a missing colon and field smtp_requre_tls not found in type config.plain for a misspelt key.
Fix:
sudo sed -i 's/ receiver: team-mail/ receiver: team-email/' /etc/alertmanager/alertmanager.yml
sudo amtool check-config /etc/alertmanager/alertmanager.yml && sudo systemctl reload alertmanager✅ Checkpoint: amtool check-config says SUCCESS and the reload runs without errors.
2Emails stop because TLS is required
Remove the smtp_require_tls: false line (many people do, thinking it’s insecure), reload, and fire InstanceDown again by stopping node_exporter on node01:
Run this on prom01 (and stop node_exporter on node01):
sudo sed -i '/smtp_require_tls: false/d' /etc/alertmanager/alertmanager.yml
sudo systemctl reload alertmanager
# two minutes after stopping node_exporter on node01:
sudo journalctl -u alertmanager -n 20 --no-pager | grep -i notifyYou’ll get this error:
... level=WARN source=retry_stage.go:165 msg="Notify attempt failed, will retry later" component=dispatcher receiver=team-email integration=email[0] aggrGroup="{}:{alertname=\"InstanceDown\", job=\"node\"}" attempts=1 err="'require_tls' is true (default) but \"127.0.0.1:1025\" does not advertise the STARTTLS extension"The config is valid, so amtool won’t warn you; the failure only shows when Alertmanager tries to send. The default is to require STARTTLS, and Mailpit doesn’t offer it. A wrong port in smtp_smarthost gives a different line: err="establish connection to server: dial tcp 127.0.0.1:1026: connect: connection refused".
You can also watch alertmanager_notifications_failed_total{integration="email"} in Prometheus, which is a good alert of its own.
Fix:
sudo sed -i "s/^ smtp_from: 'alertmanager@prom01.lab'/&\n smtp_require_tls: false/" /etc/alertmanager/alertmanager.yml
sudo amtool check-config /etc/alertmanager/alertmanager.yml && sudo systemctl reload alertmanagerAlertmanager retries failed sends, so the waiting email arrives within a minute or so after the reload. Start node_exporter on node01 again when it does.
✅ Checkpoint: The InstanceDown mail arrives in Mailpit and the journal has no new “Notify attempt failed” lines.
3Alerts never reach Alertmanager
Now break the other side. Change the target in Prometheus’s alerting block to a wrong port, reload Prometheus, and stop node_exporter on node01 again:
Run this on prom01:
sudo sed -i "s/- targets: \['localhost:9093'\]/- targets: ['localhost:9039']/" /etc/prometheus/prometheus.yml
curl -s -X POST http://localhost:9090/-/reload
# after stopping node_exporter on node01 and waiting two minutes:
sudo journalctl -u prometheus -n 20 --no-pager | grep -i "error sending"You’ll get this error:
... level=ERROR source=sendloop.go:239 msg="Error sending alerts" component=notifier alertmanager=http://localhost:9039/api/v2/alerts count=1 err="Post \"http://localhost:9039/api/v2/alerts\": dial tcp 127.0.0.1:9039: connect: connection refused"The sed changes both the alerting target and the alertmanager scrape job, so that job goes DOWN too. The alert is red on the Prometheus Alerts page, Alertmanager’s UI is empty, and no mail arrives, so always check which side has the alert. Prometheus counts these failures in prometheus_notifications_errors_total and prometheus_notifications_dropped_total.
Fix:
sudo sed -i "s/- targets: \['localhost:9039'\]/- targets: ['localhost:9093']/" /etc/prometheus/prometheus.yml
promtool check config /etc/prometheus/prometheus.yml && curl -s -X POST http://localhost:9090/-/reload
curl -s http://localhost:9090/api/v1/alertmanagers | jq -c .data.activeAlertmanagersThen start node_exporter on node01 again.
✅ Checkpoint: activeAlertmanagers shows localhost:9093 again and the InstanceDown email reaches Mailpit.
This happened at work
Forty emails before breakfast
A colleague who looks after the plant monitoring at a textile machinery manufacturer in Coimbatore told me this over filter coffee. One Monday at 6:10 am a core switch on the shop floor rebooted after a firmware update that nobody had announced. Forty machine controllers and their Linux gateways vanished from the network for eleven minutes, and the maintenance supervisor’s phone got more than forty separate emails: InstanceDown for every gateway, then high-memory and disk warnings from the same boxes as their exporters came back half-started.
The first instinct of the team was to raise for on every alert to 15 minutes, which would have hidden real failures too. When they looked at alertmanager.yml the problem was clear: group_by listed instance, so every gateway was its own group and its own email, and there were no inhibit rules at all.
They changed group_by to [alertname, site], added a site label to every scrape target, and added an inhibit rule so InstanceDown mutes warnings for the same instance. They also added a SwitchDown alert from the SNMP exporter that inhibits InstanceDown for everything behind that switch. The next unplanned reboot produced two emails, one saying the switch was down and one saying it was back, and the supervisor finally stopped muting his phone.
Common mistakes and troubleshooting
| Mistake | What happens | What to do instead |
|---|---|---|
| group_by including instance | One email per server during an outage, the inbox floods | Group by alertname and a wider label such as job, site or cluster |
| Leaving smtp_require_tls on with a server that has no STARTTLS | “does not advertise the STARTTLS extension” in the log and no email | Use TLS where the server supports it; turn it off only for local test servers like Mailpit |
| Restarting instead of checking config first | A typo stops Alertmanager and every alert in the company goes quiet | Run amtool check-config, then systemctl reload, never a blind restart |
| Silencing with a too-wide matcher | alertname=~”.+” mutes everything, including real outages elsewhere | Match alertname and instance, set a short duration and a clear comment |
| Inhibit rule without equal | A single InstanceDown mutes warnings for every server | Always list equal labels such as instance or cluster |
| No alert on Alertmanager itself | Nobody notices when email delivery breaks | Scrape Alertmanager and alert on alertmanager_notifications_failed_total and up{job=”alertmanager”} |
Interview questions
Click a question to open it. Each one is written the way an interviewer would ask it. Under it you will see why they ask it and one way you could answer, in your own words.
Fresher level
1. What is the difference between Prometheus and Alertmanager when it comes to alerts?
Why they ask this: They want a clean split of responsibilities.
How you might answer: Prometheus evaluates the alerting rules and decides when an alert is firing, then sends it to Alertmanager. Alertmanager never looks at metrics; it groups alerts, applies silences and inhibition, picks a receiver from the route tree and sends the email or chat message.
That is why the rule file only has labels like severity, and the email address lives in alertmanager.yml.
2. A server is being patched tonight. How do you stop its alerts without changing any config?
Why they ask this: They want to hear silences, ideally with amtool, and sensible scope.
How you might answer: I’d add a silence with amtool for that instance only, for example amtool silence add with matchers alertname=InstanceDown and instance=192.168.56.61:9100, a two hour duration and a comment saying why. Or I’d create it in the Alertmanager UI.
Silences live in Alertmanager’s data folder, so no reload is needed, and when the work finishes early I expire it with amtool silence expire and the ID.
2–5 years experience
3. Explain group_wait, group_interval and repeat_interval with an example.
Why they ask this: They are checking whether you understand the timing that controls notification volume.
How you might answer: With group_wait 30s, when the first InstanceDown arrives Alertmanager waits 30 seconds so that other InstanceDown alerts for the same job join the same email. If a new instance joins the group later, it waits for group_interval, 5 minutes in my lab, before sending an update.
If nothing changes, repeat_interval, 4 hours for us, decides when a reminder is sent for alerts still firing. Short repeat intervals are a common source of alert fatigue.
4. Alerts are firing in Prometheus but no email arrives. Walk me through how you troubleshoot.
Why they ask this: They want a methodical path through both programs and the mail server.
How you might answer: First I check /api/v1/alertmanagers in Prometheus and the Prometheus journal for “Error sending alerts”. If Alertmanager has the alert, I check whether it’s silenced or inhibited with amtool alert query with the silenced and inhibited flags.
Then I look at the Alertmanager journal for “Notify attempt failed”, which tells me if it’s TLS, authentication or a wrong smarthost, and I check alertmanager_notifications_failed_total. amtool config routes test with the alert’s labels confirms which receiver it should reach.
Senior level
5. How would you run Alertmanager so that alerting survives the loss of one server?
Why they ask this: They want to see you understand clustering and why Prometheus sends to all instances.
How you might answer: I’d run two or three Alertmanagers on different hosts, joined with the cluster flags on port 9094 so they share silences and the notification log. Every Prometheus lists all of them in its alerting block, not a load balancer, because each instance must receive every alert.
The gossip deduplicates notifications, so people still get one email, and if one node dies the others carry on. I’d also alert on the cluster size metric and on failed notifications.
6. Design a routing tree for a company with a database team, a network team and a 24×7 NOC.
Why they ask this: They are checking practical routing design with labels and child routes.
How you might answer: I’d make sure every alert carries team and severity labels from the rules or the scrape config. The root route sends to a default chat channel; child routes match team=”db” or team=”network” to their own receivers, and inside each a severity=”critical” child goes to the paging tool with continue set where the NOC also needs a copy.
I’d test the tree with amtool config routes test before every change, and add inhibit rules so a site or switch outage mutes the host alerts behind it.
Quick quiz
Q1. Which file and port does Alertmanager use in this lab?
- /etc/prometheus/prometheus.yml on 9090
- /etc/alertmanager/alertmanager.yml on 9093
- /etc/alertmanager/alertmanager.yml on 9100
- /etc/amtool/config.yml on 9094
Show answer
B — Alertmanager reads /etc/alertmanager/alertmanager.yml and serves its UI and API on 9093.
Q2. Alertmanager logs “does not advertise the STARTTLS extension”. What is the fix for a local test mail server?
- Raise group_wait
- Set smtp_require_tls: false
- Restart Prometheus
- Add an inhibit rule
Show answer
B — Alertmanager requires STARTTLS by default; a local server like Mailpit without TLS needs smtp_require_tls: false.
Q3. Ten servers go down within ten seconds. With group_by [alertname, job] and group_wait 30s, how many InstanceDown emails do you get at first?
- Ten
- Five
- One
- None
Show answer
C — All ten alerts share alertname and job, so they join one group and go out together after group_wait.
Q4. Which command shows alerts muted by an inhibit rule?
- amtool alert query
- amtool alert query with the inhibited flag
- amtool check-config
- promtool test rules
Show answer
B — Plain alert query hides muted alerts; adding the inhibited flag lists the ones suppressed by inhibition.
Q5. Where are silences stored?
- In alertmanager.yml
- In prometheus.yml
- In Alertmanager’s data folder, created at run time
- In the Prometheus TSDB
Show answer
C — Silences are created through the UI, API or amtool and saved in the storage path folder, so they need no config reload.
Quick recap
- Prometheus decides an alert is firing; Alertmanager groups it, checks silences and inhibition, and delivers it.
- The route tree and group_by decide who gets a message and how many messages an outage produces; group_wait, group_interval and repeat_interval control the timing.
- amtool checks the config, lists alerts and manages silences, and check-config should run before every reload.
- Silent email usually means one of three things: a config error, an SMTP problem such as required TLS, or Prometheus pointing at the wrong Alertmanager.
- Your lab now has Alertmanager on prom01:9093, Mailpit on 1025/8025, the team-email receiver and an inhibit rule for InstanceDown.
Next lesson
Lesson 10: Grafana dashboards for Prometheus → You install Grafana, import the Node Exporter Full dashboard and build your own dashboard with a variable for each server.
Further reading: Prometheus Alertmanager
Want to go deeper into Prometheus Alertmanager? The official Alertmanager overview explains grouping, inhibition and silences, the configuration reference lists every receiver type and option, and the Alertmanager GitHub page documents amtool. Mailpit’s options are on its GitHub page.
If your alerts don’t fire in the first place, go back to Lesson 8 on alerting rules. You can also see the full plan for this course on the Prometheus Monitoring course page.
