Prometheus TSDB: storage, retention and deleting series
-
Phase 1: Prometheus foundations and setup
-
Phase 2: Collect, query and store metrics
-
Phase 3: Alerts and dashboards
The Prometheus TSDB is the small database built into the Prometheus binary, and it’s the part people forget until the disk fills up at 3 am. In this lesson you open /var/lib/prometheus on prom01 and see what each folder is for: the head block in memory, the write-ahead log, the two-hour blocks and the compaction that merges them. Then you set a size limit next to the 15 day time limit, so the disk can never be eaten by surprise.
You’ll also do the jobs that need care on a real server: work out how much disk you need, find which metrics and labels cost the most, take a snapshot backup, and delete series you don’t want with the admin API, switched on only for as long as you need it.
Where this lesson fits
Lesson 6 of 10 in Prometheus Monitoring · Phase 2: Collect, query and store metrics · Before this: Lesson 5, PromQL examples · Next: Lesson 7, recording rules
| Time | You need | By the end you can |
|---|---|---|
| About 90 minutes | prom01 and node01 from Lesson 5 (Prometheus as a service, job “node” scraping both VMs), SSH to prom01, a VM snapshot is a good idea before you start | Explain how Prometheus stores data, size its disk with a formula, set safe retention, and back up and delete series without breaking anything |
What it is, in one line
The Prometheus TSDB keeps the last couple of hours of samples in memory with a write-ahead log for safety, then writes them to disk as compressed, read-only blocks that are merged over time and deleted when they pass the retention limit.
In Simple Words
The shop notebook and the yearly register
Picture a kirana store owner in a busy market. Every sale goes into a small rough notebook on the counter, written fast, and at the same time a copy goes on a carbon sheet in the drawer, so if tea spills on the notebook nothing is lost.
Every evening he copies the day’s sales neatly into a bound register and starts a fresh page. At month end his son binds the daily pages into one thicker book, and once a book is older than the shop needs, it goes to the raddiwala to make room on the shelf.
In Prometheus the rough notebook is the head block, the carbon copy is the WAL, the neat pages are two-hour blocks, binding is compaction and the raddiwala is retention.
Engineer's View
What sits inside /var/lib/prometheus
The TSDB is append-only and organised by time. New samples go to the head, an in-memory structure covering roughly the last two to three hours. Every sample is also written to the write-ahead log (wal/), split into segment files of up to 128 MB, so a crash or restart can rebuild the head by replaying it.
Full chunks of the head (120 samples each) are flushed to chunks_head/ and memory-mapped, which keeps RAM use down.
| Path | What it holds | Can you delete it? |
|---|---|---|
| 01K… (ULID folders) | One persisted block: chunks/ with compressed samples, index, meta.json, tombstones | Only through retention or the admin API, never by hand while running |
wal/ | Write-ahead log segments plus checkpoint.N folders | No. Losing it loses the last few hours |
chunks_head/ | Memory-mapped full chunks of the head block | No |
lock | Stops a second Prometheus from opening the same folder | Only if no Prometheus is running and it was left behind |
queries.active | Queries running right now, logged again after a crash | Harmless, recreated on start |
snapshots/ | Snapshots you made with the admin API | Yes, once you have copied them somewhere safe |
Each block has a ULID as its name, which sorts by creation time. A block’s meta.json records its time range and sample, series and chunk counts, and its compaction.level says how many merges it has been through. Samples compress very well (Gorilla-style delta-of-delta timestamps and XOR-encoded values), and the docs quote an average of only 1 to 2 bytes per sample.
How it works, step by step
1A scrape lands in the head and the WAL
Every scrape gives Prometheus a batch of samples. The scrape loop appends them to the head in memory and to the current WAL segment on disk in one commit, and only then counts the scrape as done. If the WAL write fails (disk full, read-only filesystem), the whole scrape is thrown away and you’ll see “Scrape commit failed” in the log.
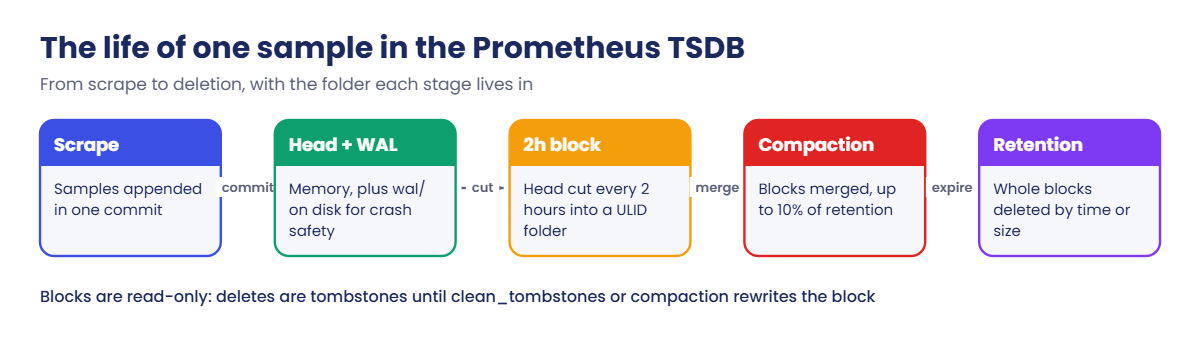
When a series’ in-memory chunk fills up (120 samples, which is 30 minutes at a 15 second interval), it’s written to chunks_head/ and memory-mapped. The diagram below follows a sample from the scrape all the way to deletion.
2The head is cut into two-hour blocks and compacted
Once the head covers more than about three hours, Prometheus writes the oldest two hours out as a new block folder, drops that range from memory (“Head GC”) and truncates the WAL up to that point, keeping a checkpoint. In the background, compaction merges small blocks into bigger ones, up to 10% of the retention time or 31 days, whichever is smaller. With 15 days of retention, the biggest blocks cover about 36 hours.
Blocks never change after they’re written. That’s why deleting data is a two-step job: you first mark series as deleted with tombstones, and the data is only removed when the block is rewritten by compaction or clean_tombstones.
3Retention by time, by size, or both
Retention only ever deletes whole blocks. With time retention a block goes once all of its data is older than the limit, so you always keep a little more than you asked for. With size retention Prometheus deletes the oldest blocks until the total (blocks plus WAL plus chunks_head) is under the limit.
If you set both, whichever is hit first wins.
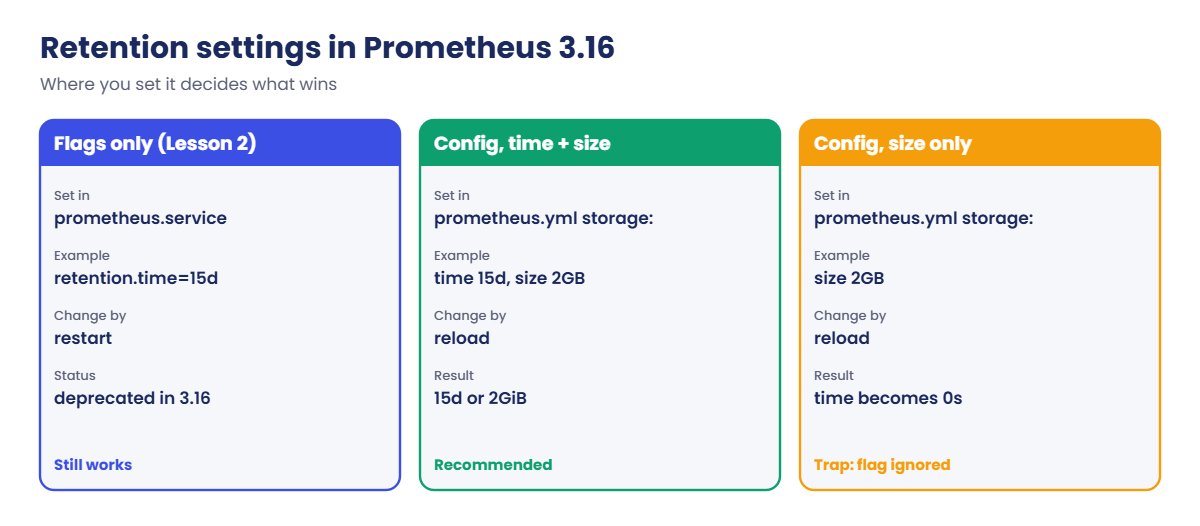
In Prometheus 3.16 the --storage.tsdb.retention.time and --storage.tsdb.retention.size flags still work but are marked deprecated in prometheus --help; the new home is a storage.tsdb.retention block in prometheus.yml, which you can change with a reload instead of a restart. The comparison below shows how each setting behaves.
4Cardinality and disk sizing
Memory and disk both follow the number of active series. A series is one metric name plus one unique set of label values, so one metric with a label order_id that takes 5,000 values becomes 5,000 series, and every one costs memory in the head and space in the index. Fewer series help far more than a longer scrape interval.
The docs give a simple formula for disk: retention seconds x samples per second x bytes per sample. You can read both live numbers from Prometheus itself.
| What | PromQL |
|---|---|
| Samples ingested per second | rate(prometheus_tsdb_head_samples_appended_total[1h]) |
| Active series in the head | prometheus_tsdb_head_series |
| Real bytes per sample after compression | prometheus_tsdb_compaction_chunk_size_bytes_sum / prometheus_tsdb_compaction_chunk_samples_sum |
| Disk used by blocks | prometheus_tsdb_storage_blocks_bytes |
| WAL size | prometheus_tsdb_wal_storage_size_bytes |
| Blocks deleted by size or time limit | prometheus_tsdb_size_retentions_total, prometheus_tsdb_time_retentions_total |
Leave room on top: the docs suggest keeping the size limit at 80 to 85% of the disk you give Prometheus, because compaction writes the new block before deleting the old ones.
Hands-on lab: retention, snapshots and deleting series on prom01
Before you run any command, double-check it
Read every command twice before you press Enter. Check the target: the server name, the user, the disk or device name, the path and the sizes. These commands are for learning and were tested in our lab, not on your system. At work, run the read-only commands first, follow your change process, make sure a backup exists, and ask a second person to check anything that changes or deletes data. You run them at your own risk.
All commands run on prom01. Prometheus is reached locally on localhost:9090 as set up in Lesson 3, and the data folder is /var/lib/prometheus, owned by the prometheus user. Your numbers will be different from mine, depending on how long your lab has been running.
1Look inside the data folder
Run this on prom01:
sudo ls -la /var/lib/prometheus
sudo du -sh /var/lib/prometheus/* | sort -hYou should see this (your block IDs, sizes and times will differ):
total 32
drwxr-xr-x 6 prometheus prometheus 4096 Nov 8 06:00 .
drwxr-xr-x 45 root root 4096 Nov 7 17:12 ..
drwxr-xr-x 3 prometheus prometheus 4096 Nov 8 03:00 01K9JZ7Q3M6H4RZB2W5ESXK0TA
drwxr-xr-x 3 prometheus prometheus 4096 Nov 8 05:00 01K9K6386VGMD0XKT1A3T9S2QY
drwxr-xr-x 2 prometheus prometheus 4096 Nov 8 05:00 chunks_head
-rw-r--r-- 1 prometheus prometheus 0 Nov 7 17:40 lock
-rw-r--r-- 1 prometheus prometheus 20001 Nov 8 05:59 queries.active
drwxr-xr-x 3 prometheus prometheus 4096 Nov 8 05:00 wal
0 /var/lib/prometheus/lock
20K /var/lib/prometheus/queries.active
380K /var/lib/prometheus/01K9K6386VGMD0XKT1A3T9S2QY
1.6M /var/lib/prometheus/01K9JZ7Q3M6H4RZB2W5ESXK0TA
2.1M /var/lib/prometheus/chunks_head
4.8M /var/lib/prometheus/walThe two ULID folders are persisted blocks; the bigger one has already been through compaction. Your lab only has three targets, so everything is tiny, and the WAL is the biggest piece because it holds the last few hours uncompressed.
✅ Checkpoint: You can see at least the wal, chunks_head and lock entries, all owned by prometheus.
2Read one block’s meta.json
Run this on prom01:
B=$(sudo ls /var/lib/prometheus | grep '^01' | tail -1)
sudo cat /var/lib/prometheus/$B/meta.json
sudo ls /var/lib/prometheus/$B
sudo stat -c '%s %n' /var/lib/prometheus/$B/chunks/*You should see this (your block ID and counts will differ):
{
"ulid": "01K9K6386VGMD0XKT1A3T9S2QY",
"minTime": 1794110400000,
"maxTime": 1794117600000,
"stats": {
"numSamples": 158664,
"numFloatSamples": 158664,
"numSeries": 2117,
"numChunks": 2117
},
"compaction": {
"level": 1,
"sources": [
"01K9K6386VGMD0XKT1A3T9S2QY"
]
},
"version": 1
}
chunks index meta.json tombstones
271804 /var/lib/prometheus/01K9K6386VGMD0XKT1A3T9S2QY/chunks/000001minTime and maxTime are Unix milliseconds two hours apart, so this is a fresh level 1 block cut from the head. 158,664 samples in a 271,804 byte chunk file works out at about 1.7 bytes per sample, which matches what the docs promise.
✅ Checkpoint: meta.json shows a two-hour range (maxTime minus minTime is 7200000) and sample and series counts.

3Check the TSDB status page and API
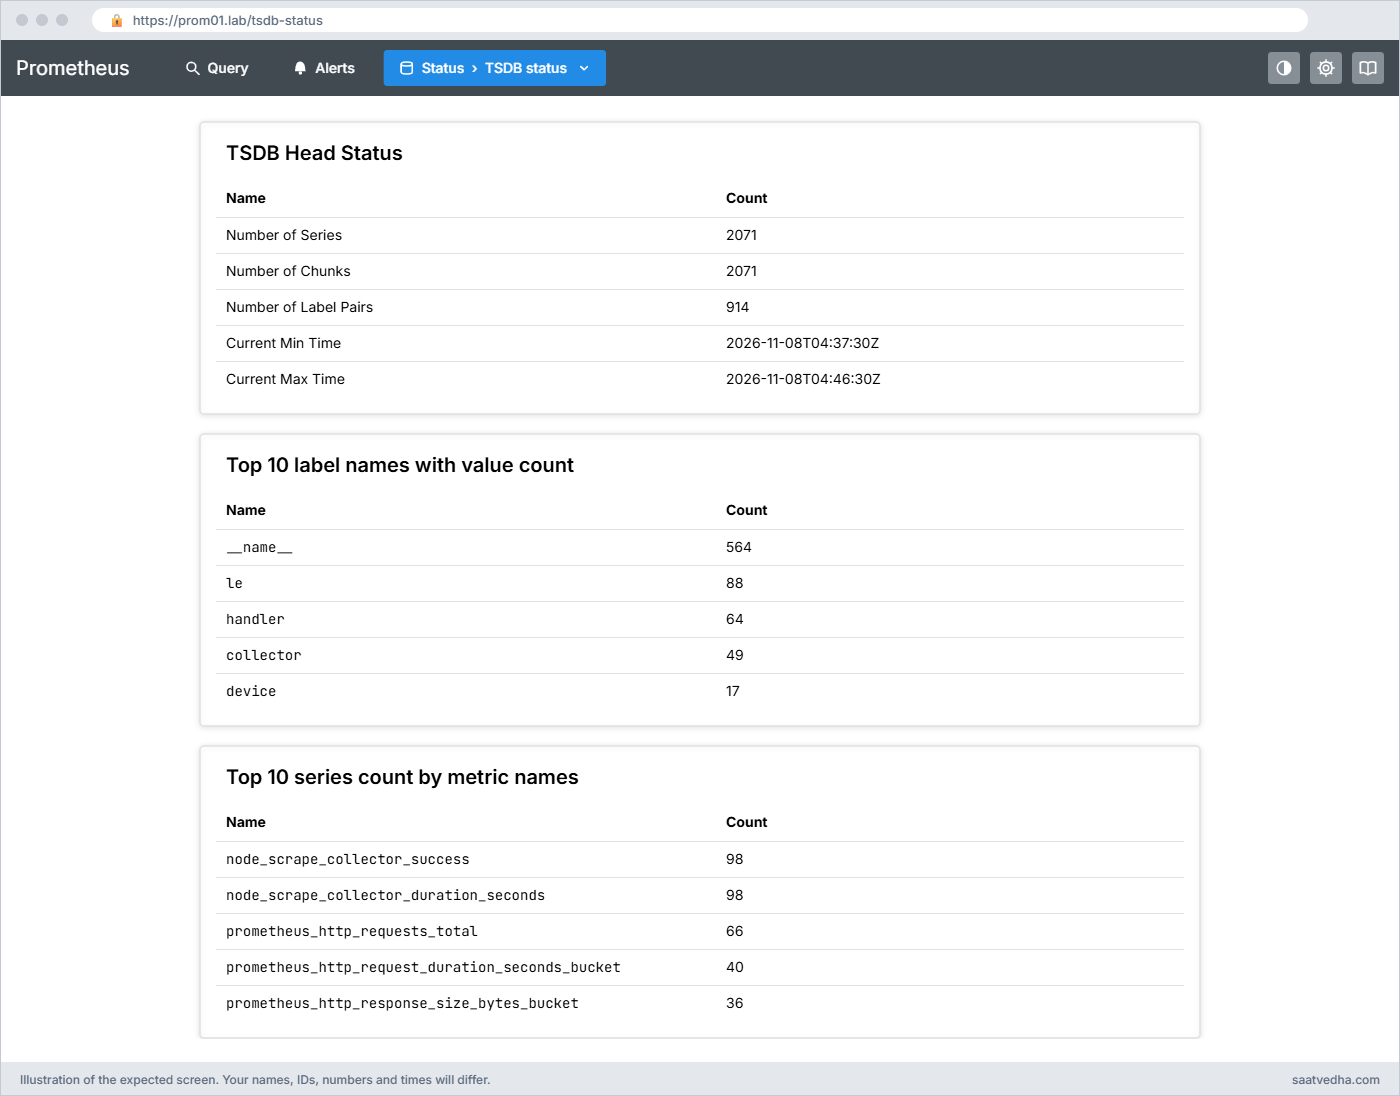
In the browser open https://prom01.lab/ and go to Status > TSDB status. It shows head statistics and the top metrics and labels by series count. The same data comes from the API:
Run this on prom01:
curl -s localhost:9090/api/v1/status/tsdb | jq -c '.data.headStats'
curl -s localhost:9090/api/v1/status/tsdb | jq -r '.data.seriesCountByMetricName[0:5][] | "\(.value)\t\(.name)"'
curl -s localhost:9090/api/v1/status/tsdb | jq -r '.data.labelValueCountByLabelName[0:5][] | "\(.value)\t\(.name)"'You should see this (your numbers will differ):
{"numSeries":2071,"numLabelPairs":914,"chunkCount":2071,"minTime":1794112650830,"maxTime":1794113190829}
98 node_scrape_collector_success
98 node_scrape_collector_duration_seconds
66 prometheus_http_requests_total
40 prometheus_http_request_duration_seconds_bucket
36 prometheus_http_response_size_bytes_bucket
564 __name__
88 le
64 handler
49 collector
17 deviceAbout 2,000 series in total for three targets is normal. Notice the two node_scrape_collector_* metrics at the top: node_exporter reports a success flag and a duration for every collector on every host. You’ll drop the duration one in step 8, because nobody graphs it.
✅ Checkpoint: headStats.numSeries is in the low thousands and you can name the top metric by series count.
4Work out how much disk you need
Run this on prom01:
q(){ curl -s localhost:9090/api/v1/query --data-urlencode "query=$1" | jq -r '.data.result[0].value[1]'; }
SPS=$(q 'sum(rate(prometheus_tsdb_head_samples_appended_total[1h]))')
BPS=$(q 'prometheus_tsdb_compaction_chunk_size_bytes_sum / prometheus_tsdb_compaction_chunk_samples_sum')
echo "samples/s=$SPS bytes/sample=$BPS"
python3 -c "print(round($SPS * 15*86400 * $BPS / 1024**2), 'MiB for 15 days')"You should see this (your numbers will differ):
samples/s=145.93 bytes/sample=1.716
311 MiB for 15 daysAbout 146 samples a second (roughly 2,200 series every 15 seconds) costs about 300 MiB for 15 days of blocks. Add the WAL and chunks_head, which hold a few hours uncompressed, and leave space for compaction, and the 2 GB you set next is plenty for this lab. At work, 1,000 servers with node_exporter at 15 seconds is about 45,000 samples a second, which comes to roughly 100 GB for 15 days.
✅ Checkpoint: You have a samples per second figure and a disk estimate in MiB for 15 days.
5Set retention by time and size in prometheus.yml
The Lesson 2 unit file still has --storage.tsdb.retention.time=15d, which keeps working. In 3.16 the recommended place is the config file, and a value there replaces the flag values, so always write both time and size together. Open the config with sudo nano /etc/prometheus/prometheus.yml and add this block at the top level, next to global::
Add this to /etc/prometheus/prometheus.yml:
storage:
tsdb:
retention:
time: 15d
size: 2GBThen run this on prom01:
promtool check config /etc/prometheus/prometheus.yml
curl -s -X POST localhost:9090/-/reload
sudo journalctl -u prometheus -n 20 --no-pager | grep -i retention
curl -s localhost:9090/api/v1/status/runtimeinfo | jq -r .data.storageRetentionYou should see this (your times and PID will differ):
Checking /etc/prometheus/prometheus.yml
SUCCESS: /etc/prometheus/prometheus.yml is valid prometheus config file syntax
Nov 08 06:12:40 prom01 prometheus[1187]: time=2026-11-08T06:12:40.285Z level=INFO source=main.go:1148 msg="TSDB retention updated" duration=15d size=2GiB percentage=0
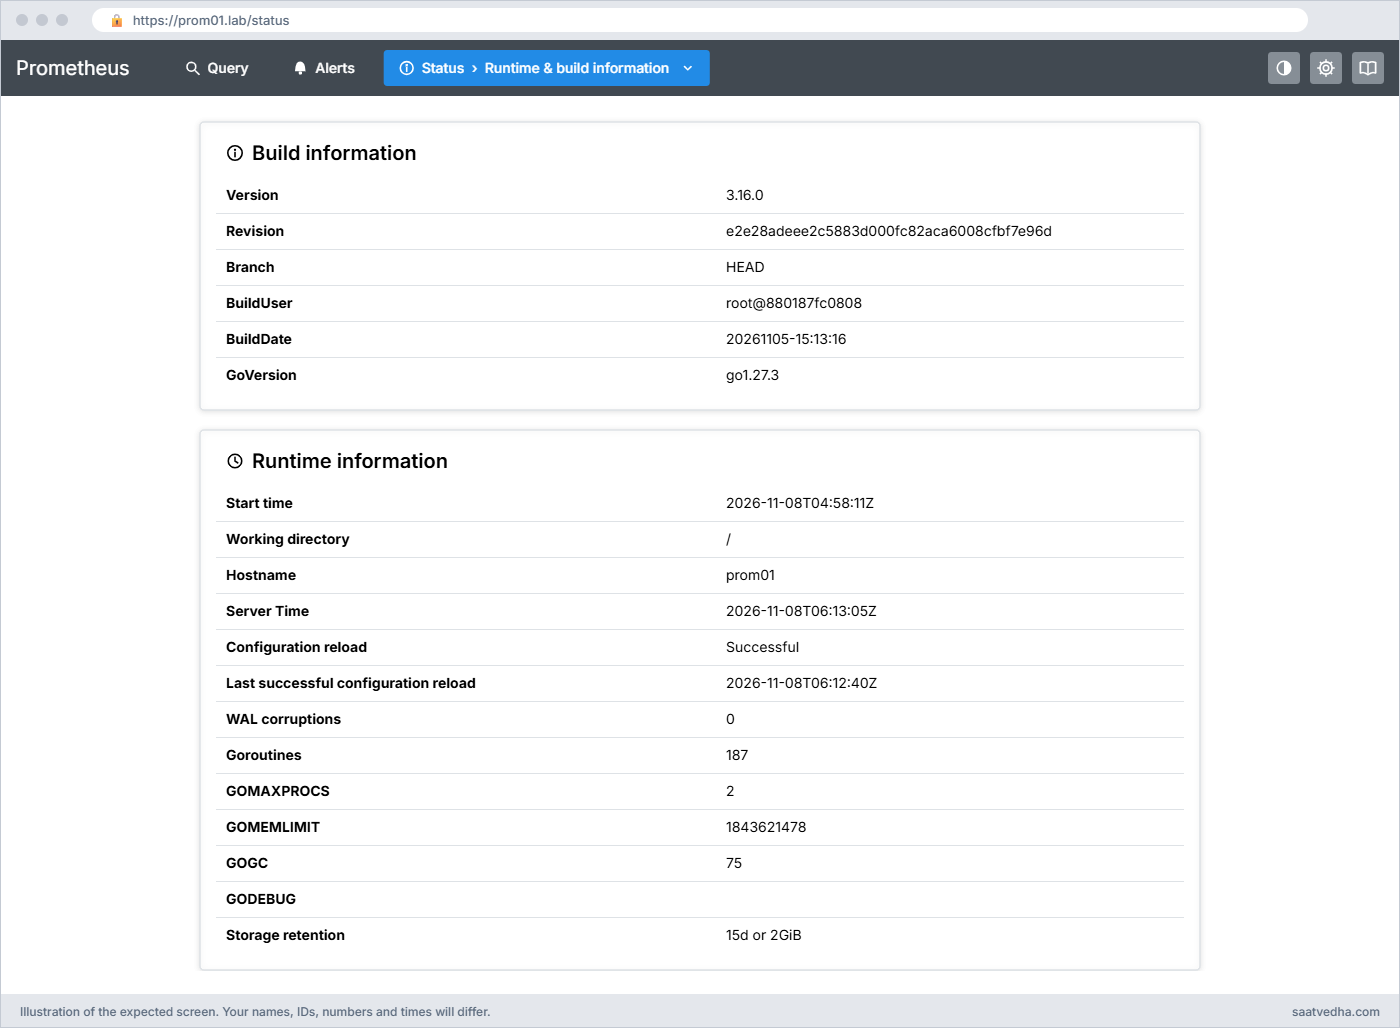
15d or 2GiBNo restart was needed. storageRetention reads “15d or 2GiB”, meaning whichever limit is reached first. The size uses powers of two, so 2GB is 2 GiB here. If you prefer to stay with flags, the same thing is --storage.tsdb.retention.size=2GB in the unit file plus a restart, but expect the flags to go away in a later major release.
✅ Checkpoint: runtimeinfo shows storageRetention “15d or 2GiB” and the journal has a “TSDB retention updated” line.
6Turn on the admin API for a short while and take a snapshot
The admin API can delete data, so it stays off by default and you switch it on only while you need it. Take a VirtualBox snapshot of prom01 before this step if you haven’t already.
Run this on prom01:
sudo sed -i 's/--web.enable-lifecycle/--web.enable-lifecycle --web.enable-admin-api/' /etc/systemd/system/prometheus.service
grep -n 'admin-api' /etc/systemd/system/prometheus.service
sudo systemctl daemon-reload && sudo systemctl restart prometheus
sleep 5
curl -s -X POST localhost:9090/api/v1/admin/tsdb/snapshotYou should see this (your snapshot name will differ):
15: --web.enable-lifecycle --web.enable-admin-api \
{"status":"success","data":{"name":"20261108T061840Z-1584f8aa3a6f7adc"}}The snapshot is a folder under /var/lib/prometheus/snapshots/ holding hard links to the existing blocks plus a fresh block made from the head, so it’s fast and takes almost no extra space until the originals are deleted. Copy it off the server and remove the local copy:
SNAP=20261108T061840Z-1584f8aa3a6f7adc # use the name you got
sudo tar -C /var/lib/prometheus/snapshots -czf ~/prom-snap-$SNAP.tar.gz $SNAP
ls -lh ~/prom-snap-*.tar.gz
sudo promtool tsdb list -r /var/lib/prometheus/snapshots/$SNAP-rw-r--r-- 1 student student 1.9M Nov 8 06:19 /home/student/prom-snap-20261108T061840Z-1584f8aa3a6f7adc.tar.gz
BLOCK ULID MIN TIME MAX TIME DURATION NUM SAMPLES NUM CHUNKS NUM SERIES SIZE
01K9JZ7Q3M6H4RZB2W5ESXK0TA 2026-11-07 17:40:12 +0000 UTC 2026-11-08 03:00:00 +0000 UTC 9h19m48s 812416 9370 2185 1MiB614KiB409B
01K9K6386VGMD0XKT1A3T9S2QY 2026-11-08 03:00:00 +0000 UTC 2026-11-08 05:00:00 +0000 UTC 2h0m0s 158664 2117 2117 365KiB147B
01K9KB4P1E0Z8N7R6D5HCQW3JX 2026-11-08 05:00:00 +0000 UTC 2026-11-08 06:18:40 +0000 UTC 1h18m40s 103107 2205 2205 290KiB153BTo restore, you’d stop Prometheus, move the snapshot’s block folders into an empty data folder, fix ownership and start it again. Copy the tar file to your laptop with scp if you want a real off-box backup.
✅ Checkpoint: The snapshot API returned “success”, the tar file exists in your home folder, and tsdb list shows its blocks.
7Analyse the snapshot with promtool
promtool tsdb analyze reads a block and prints the labels and metrics that cost the most. Point it at the snapshot, not at the live folder: on a running server it opens the folder read-only and leaves a tmp_dbro_sandbox... directory behind in it.
Run this on prom01:
sudo promtool tsdb analyze --limit=5 /var/lib/prometheus/snapshots/$SNAPYou should see this (shortened; your block ID and counts will differ):
Block ID: 01K9KB4P1E0Z8N7R6D5HCQW3JX
Duration: 1h18m40s
Total Series: 2205
Label names: 57
Postings (unique label pairs): 914
Postings entries (total label pairs): 9805
Label pairs most involved in churning:
67 job=prometheus
67 instance=localhost:9090
...
Highest cardinality labels:
564 __name__
88 le
64 handler
49 collector
17 device
Highest cardinality metric names:
98 node_scrape_collector_duration_seconds
98 node_scrape_collector_success
66 prometheus_http_requests_total
60 prometheus_http_request_duration_seconds_bucket
54 prometheus_http_response_size_bytes_bucket“Highest cardinality labels” tells you how many different values each label name has. In a healthy setup you see small numbers like these; a label with tens of thousands of values (user IDs, order IDs, full URLs) is the thing to hunt. “Churning” means series that started or stopped inside the block, which is high when pods or targets come and go a lot.
✅ Checkpoint: promtool printed the block summary and the highest cardinality labels and metric names.
8Stop collecting a metric and delete its history
First stop new samples for node_scrape_collector_duration_seconds with metric_relabel_configs, which runs after the scrape and before storage. Add these lines to the node job in prometheus.yml, at the same indentation as static_configs::
Add this to the node job:
metric_relabel_configs:
- source_labels: [__name__]
regex: 'node_scrape_collector_duration_seconds'
action: dropThen run this on prom01:
promtool check config /etc/prometheus/prometheus.yml && curl -s -X POST localhost:9090/-/reload
sleep 30
q 'scrape_samples_scraped{job="node"}'; q 'scrape_samples_post_metric_relabeling{job="node"}'
curl -s -o /dev/null -w '%{http_code}\n' -X POST -g \
'localhost:9090/api/v1/admin/tsdb/delete_series?match[]=node_scrape_collector_duration_seconds'
curl -s -o /dev/null -w '%{http_code}\n' -X POST localhost:9090/api/v1/admin/tsdb/clean_tombstones
q 'count(node_scrape_collector_duration_seconds)'You should see this (your sample counts will differ):
643
594
204
204
nullEach node scrape still fetches 643 samples, but only 594 are stored now. The two 204 responses mean “done, nothing to return”: delete_series wrote tombstones and clean_tombstones rewrote the affected blocks without that data. The count query returns nothing (null from jq), so the history is gone from the blocks and the head.
delete_series without start and end deletes the whole history of every matching series. Add -d “start=2026-11-08T04:00:00Z” -d “end=2026-11-08T05:00:00Z” to delete only a time range, and always test your match[] selector in the Query page first, because there is no undo except the snapshot.
✅ Checkpoint: scrape_samples_post_metric_relabeling is lower than scrape_samples_scraped, both admin calls returned 204, and the deleted metric returns no data.
9Turn the admin API off again and clean up
Run this on prom01:
sudo sed -i 's/ --web.enable-admin-api//' /etc/systemd/system/prometheus.service
sudo systemctl daemon-reload && sudo systemctl restart prometheus
sleep 5
curl -s -X POST localhost:9090/api/v1/admin/tsdb/snapshot
sudo rm -rf /var/lib/prometheus/snapshots/$SNAPYou should see this:
{"status":"error","errorType":"unavailable","error":"admin APIs disabled"}That error is what you want to see. Keep the tar file; the snapshot folder on the server was only a staging copy, and once the blocks it links to have been deleted by retention it would start using real disk space.
✅ Checkpoint: The snapshot call now answers “admin APIs disabled” and the unit file no longer contains enable-admin-api.
Break It, Then Fix It
Three failures: one you’ll meet when a disk fills up, one when a developer adds the wrong label, and one quiet config trap that’s new in Prometheus 3. Take a VirtualBox snapshot of prom01 first.
1No space left on device
You won’t fill prom01’s real disk. Instead you create a tiny 3 MB RAM disk and run a second, temporary Prometheus on it on port 9095.
Run this on prom01:
sudo mkdir -p /mnt/tiny && sudo mount -t tmpfs -o size=3M,mode=1777 tmpfs /mnt/tiny
/usr/local/bin/prometheus --config.file=/etc/prometheus/prometheus.yml \
--storage.tsdb.path=/mnt/tiny/data --web.listen-address=127.0.0.1:9095 > ~/tiny.log 2>&1 &
sleep 20; df -h /mnt/tiny
dd if=/dev/zero of=/mnt/tiny/filler bs=1K count=4000 2>&1 | head -1
sleep 30; grep -m1 'no space' ~/tiny.logYou’ll get this error:
Filesystem Size Used Avail Use% Mounted on
tmpfs 3.0M 252K 2.8M 9% /mnt/tiny
dd: error writing '/mnt/tiny/filler': No space left on device
time=2026-11-08T06:31:01.595Z level=ERROR source=scrape.go:1527 msg="Scrape commit failed" component="scrape manager" scrape_pool=node target=http://192.168.56.61:9100/metrics err="write to WAL: log samples: write /mnt/tiny/data/wal/00000000: no space left on device"Prometheus doesn’t crash. Each scrape that can’t be written to the WAL is thrown away, so you silently get gaps, and prometheus_tsdb_wal_writes_failed_total goes up. Now see what happens if it starts on a full disk:
kill %1; sleep 2
/usr/local/bin/prometheus --config.file=/etc/prometheus/prometheus.yml \
--storage.tsdb.path=/mnt/tiny/data2 --web.listen-address=127.0.0.1:9095 2>&1 | grep ERRORtime=... level=ERROR source=query_logger.go:144 msg="Error allocating query log file." component=activeQueryTracker filesize=20001 err="write /mnt/tiny/data2/queries.active: no space left on device"
time=... level=ERROR source=main.go:1027 msg="failed to initialize active query tracker" err="create mmap-ed active query log: write /mnt/tiny/data2/queries.active: no space left on device"This time it exits straight away, so on a real server systemd would restart it in a loop. The fix is always to make space first: delete the thing that filled the disk (here the filler file), or grow the disk, and only then start Prometheus.
Fix and clean up:
rm /mnt/tiny/filler
sudo umount /mnt/tiny && rm ~/tiny.logTo be warned before this happens, alert on the free space of the filesystem that holds /var/lib/prometheus and on increase(prometheus_tsdb_wal_writes_failed_total[5m]) > 0, and keep the size retention well below the disk size.
✅ Checkpoint: You saw “no space left on device” in both cases, and /mnt/tiny is unmounted again.
2A label that explodes the series count
A developer adds an order ID as a label. Simulate it with a tiny Python exporter on prom01 that serves 5,000 series of shop_order_value_rupees{order_id="..."} on port 9300.
Run this on prom01:
cat > ~/orders_exporter.py <<'EOF'
import random, http.server
class H(http.server.BaseHTTPRequestHandler):
def do_GET(self):
lines = ['# TYPE shop_order_value_rupees gauge']
lines += ['shop_order_value_rupees{order_id="ORD%07d"} %d' % (1000000 + i, random.randint(100, 9000)) for i in range(5000)]
body = ('\n'.join(lines) + '\n').encode()
self.send_response(200)
self.send_header('Content-Type', 'text/plain; version=0.0.4')
self.end_headers()
self.wfile.write(body)
def log_message(self, *a): pass
http.server.HTTPServer(('127.0.0.1', 9300), H).serve_forever()
EOF
python3 ~/orders_exporter.py &Add a job under scrape_configs: in prometheus.yml, check, reload, wait 30 seconds and look at the TSDB status again:
- job_name: shop
static_configs:
- targets: ['127.0.0.1:9300']promtool check config /etc/prometheus/prometheus.yml && curl -s -X POST localhost:9090/-/reload
sleep 30
curl -s localhost:9090/api/v1/status/tsdb | jq -c '.data.headStats.numSeries, .data.seriesCountByMetricName[0], .data.labelValueCountByLabelName[0:2]'You’ll see this:
7212
{"name":"shop_order_value_rupees","value":5000}
[{"name":"order_id","value":5000},{"name":"__name__","value":570}]That one metric has tripled the size of your whole Prometheus. In real life the order IDs never repeat, so every scrape adds new series and the head grows until memory runs out. The same TSDB status table is where you’d spot it at work.
Fix: guard the job with sample_limit, then drop the metric:
- job_name: shop
sample_limit: 2000
static_configs:
- targets: ['127.0.0.1:9300']promtool check config /etc/prometheus/prometheus.yml && curl -s -X POST localhost:9090/-/reload
sleep 30
curl -s localhost:9090/api/v1/targets | jq -c '.data.activeTargets[] | select(.labels.job=="shop") | {health, lastError}'{"health":"down","lastError":"sample limit exceeded"}sample_limit rejects the whole scrape if it returns too many samples, so one bad release can’t sink the server, and the target turns red so someone notices. The real fix belongs in the application (put the order ID in logs, not in a label). For the lab, remove the shop job from prometheus.yml, reload, and stop the exporter with kill %1 (or pkill -f orders_exporter.py).
The 5,000 stale series leave the head at the next head compaction, within about two hours.
✅ Checkpoint: The shop target showed “sample limit exceeded”, and after removing the job, prometheus_tsdb_head_series falls back to about 2,200 within two hours.
3Size in the config file quietly switches off time retention
This trap is new with config file retention. Edit the storage: block from lab step 5 so it has only a size, and reload:
Change the block to this, then reload:
storage:
tsdb:
retention:
size: 2GBpromtool check config /etc/prometheus/prometheus.yml && curl -s -X POST localhost:9090/-/reload
sudo journalctl -u prometheus -n 20 --no-pager | grep 'retention updated'
curl -s localhost:9090/api/v1/status/runtimeinfo | jq -r .data.storageRetentionYou’ll see this:
... level=INFO source=main.go:1148 msg="TSDB retention updated" duration=0s size=2GiB percentage=0
2GiBNo error, but duration=0s means time retention is now off, even though the unit file still says --storage.tsdb.retention.time=15d. The config file block replaces the flags as a whole, so data is now kept until the 2 GiB limit is hit, which might be months, and anyone who promised “15 days” for privacy reasons is now wrong.
Fix: always write both values:
storage:
tsdb:
retention:
time: 15d
size: 2GB✅ Checkpoint: After the fix and a reload, the journal shows duration=15d size=2GiB and runtimeinfo says “15d or 2GiB”.
This happened at work
The shipment ID that filled the disk
My team lead tells this one from a logistics company in Ahmedabad, during the Diwali rush when parcels double. One Tuesday morning the Prometheus that watched their tracking platform was restarting every few minutes, and every restart took longer, because it was replaying a WAL that had grown to 18 GB. The on-call engineer’s first move was to raise the VM’s memory from 16 to 32 GB, which bought about forty minutes.
The TSDB status page told the real story once Prometheus stayed up long enough to open it. A metric called tracking_event_processing_seconds had 1.9 million series, and its shipment_id label had 1.9 million values. A developer had added the label a week earlier to debug one stuck parcel and the change went out with the festival release.
They dropped the label with metric_relabel_configs the same day and deleted the old series with the admin API, which brought the head from 2.3 million series to about 300,000. Afterwards they added sample_limit to every application job, an alert on prometheus_tsdb_head_series growing more than 20% in a day, and a line in the release checklist: IDs go in logs and traces, never in metric labels.
Common mistakes and troubleshooting
| Mistake | What happens | What to do instead |
|---|---|---|
| Deleting block folders or WAL files by hand while Prometheus runs | Corrupt data, failed compactions, or Prometheus refusing to start | Use retention, or the admin API delete_series and clean_tombstones |
| Setting retention.size equal to the disk size | Compaction needs room for a new block before deleting old ones, so the disk fills anyway | Keep the size limit at 80 to 85% of the space you give Prometheus |
Leaving --web.enable-admin-api on permanently | Anyone who can reach the API can delete all your data with one request | Turn it on for the job, then remove the flag and restart |
| Putting only size in the config file retention block | Time retention silently becomes 0 and data is kept far longer than agreed | Always write both time and size in storage.tsdb.retention |
| Copying /var/lib/prometheus with cp or rsync as a backup | A backup taken mid-write can be inconsistent and miss head data | Use the snapshot API and copy the snapshot folder |
| Adding labels with unbounded values (user ID, order ID, URL with query string) | Series count and memory explode, scrapes slow down, Prometheus may be OOM-killed | Keep label values to a small fixed set; use sample_limit as a safety net |
| Running promtool tsdb analyze on the live data folder | A tmp_dbro_sandbox folder is left behind inside /var/lib/prometheus | Analyse a snapshot, or remove the sandbox folder afterwards |
Interview questions
Click a question to open it. Each one is written the way an interviewer would ask it. Under it you will see why they ask it and one way you could answer, in your own words.
Fresher level
1. What is the WAL in Prometheus and why does it exist?
Why they ask this: They want to know you understand how Prometheus avoids losing recent data on a crash.
How you might answer: The write-ahead log is a set of segment files in the wal folder where every scraped sample is written before it counts as stored. Recent samples live in the in-memory head block, so if Prometheus crashes or restarts, it replays the WAL to rebuild the head.
Once the head is cut into a two-hour block on disk, the WAL is truncated up to that point. That replay is also why a server with a huge WAL takes a long time to start.
2. How do you control how long Prometheus keeps data?
Why they ask this: A practical check that you know retention time, size and where to set them.
How you might answer: There’s time retention, 15 days by default, and size retention, which is off by default. If both are set, whichever is reached first wins, and only whole blocks are deleted.
In Prometheus 3.16 I set them in prometheus.yml under storage.tsdb.retention with both time and size, because that can be changed with a reload; the old command-line flags still work but are deprecated. I keep the size at about 80% of the disk.
2–5 years experience
3. Your manager asks how much disk a new Prometheus for 400 servers needs for 30 days. Walk me through the estimate.
Why they ask this: They want to see you use the formula and real numbers, not guess.
How you might answer: I’d measure or estimate samples per second: a node_exporter host is roughly 600 to 1,000 series, so 400 hosts at 15 seconds is about 400 x 700 / 15, say 19,000 samples a second. Disk is retention seconds x samples per second x bytes per sample, so 30 x 86,400 x 19,000 x 2 bytes is about 98 GB.
Then I add room for the WAL and compaction and keep retention.size around 80% of the volume, so I’d ask for 150 GB. After a week I’d check the real bytes per sample with prometheus_tsdb_compaction_chunk_size_bytes_sum divided by chunk_samples_sum and adjust.
4. A team wants some sensitive series removed from Prometheus history today. How do you do it safely?
Why they ask this: They are checking you know the admin API, tombstones and the risks.
How you might answer: First I stop new data with a metric_relabel_configs drop rule and a reload, then I enable the admin API temporarily, take a snapshot, and test the match[] selector in the Query page. Then I POST delete_series with that selector, optionally with start and end, which writes tombstones, and call clean_tombstones so the data is removed from the blocks for good.
Finally I remove the admin API flag and restart, and I tell them about the snapshot and any remote-write copies, because those still contain the data.
Senior level
5. Prometheus memory keeps growing week by week and it was OOM-killed twice. How do you investigate?
Why they ask this: They want a structured approach to cardinality, the most common real cause.
How you might answer: I’d graph prometheus_tsdb_head_series over a few weeks and open Status > TSDB status to see which metric names and label names have the most series and values. promtool tsdb analyze on a snapshot also shows churn, which matters with short-lived pods.
Usually one label is unbounded, like an ID or a raw URL. I fix it at the source if I can, drop or rewrite it with metric_relabel_configs meanwhile, add sample_limit per job, and alert when head series grow faster than expected. Adding RAM only buys time.
6. How would you back up Prometheus, and when is local retention the wrong answer altogether?
Why they ask this: They are testing whether you know the limits of local storage and the usual long-term options.
How you might answer: For local backup I use the admin API snapshot, which hard-links blocks and flushes the head, then copy the snapshot folder off the box; restoring means putting those blocks into an empty data folder. A plain copy of a running data folder can be inconsistent.
But local storage is a single node with no replication, so for months or years of data, or for a global view across many Prometheus servers, I’d use remote write to a system such as Thanos, Mimir or VictoriaMetrics with object storage, and keep local retention short.
Quick quiz
Q1. How long does a freshly cut Prometheus block normally cover?
- 15 minutes
- 2 hours
- 1 day
- 15 days
Show answer
B — The head is written out as blocks covering two hours; compaction later merges them into bigger ones.
Q2. What happens when you call delete_series through the admin API?
- The block folders are deleted at once
- Tombstones mark the data as deleted until clean_tombstones or compaction removes it
- The metric is added to a drop list in prometheus.yml
- Nothing unless Prometheus is restarted
Show answer
B — Blocks are immutable, so deletion is recorded as tombstones first.
Q3. You set storage.tsdb.retention with only size: 2GB in prometheus.yml. What happens to the 15d retention flag?
- It still applies alongside the size
- Prometheus refuses to start
- It is replaced, and time retention becomes 0 (off)
- It becomes 15 days per GB
Show answer
C — The config block replaces the flag values, which you saw in the log as duration=0s.
Q4. Which change reduces Prometheus disk and memory use the most?
- Removing an order_id label with thousands of values
- Changing scrape_interval from 15s to 20s
- Enabling the admin API
- Taking more snapshots
Show answer
A — Cost follows the number of series, and an unbounded label creates thousands of them.
Q5. What does sample_limit do when a target returns too many samples?
- Keeps the first N samples
- Rejects the whole scrape and marks the target down with “sample limit exceeded”
- Drops the target from the config
- Compresses the samples harder
Show answer
B — The whole scrape fails, which protects the server and makes the problem visible.
Quick recap
- New samples go to the in-memory head and the WAL, then into two-hour blocks that compaction merges and retention deletes.
- Blocks are read-only; deleting series means tombstones plus clean_tombstones, through an admin API you enable only when needed.
- In 3.16 set retention in prometheus.yml under storage.tsdb.retention, always with both time and size, and reload instead of restart.
- Disk needed is about retention seconds x samples per second x 1 to 2 bytes, with 15 to 20% extra for compaction.
- Cardinality drives cost: watch the TSDB status page, drop bad labels with metric_relabel_configs, and protect jobs with sample_limit.
Next lesson
Lesson 7: Prometheus recording rules → You precompute heavy queries like CPU and memory percent into new series, name them properly, and test them with promtool before they reach production.
Further reading: Prometheus TSDB
Want to go deeper into Prometheus TSDB? The official storage documentation explains blocks, the WAL and the sizing formula, the TSDB admin API section covers snapshot, delete_series and clean_tombstones, and the promtool reference lists every tsdb subcommand. To query the series you keep, go back to PromQL examples, and for Linux disk space troubleshooting see Linux performance monitoring.
You can also see the full plan for this course on the Prometheus Monitoring course page.
