Grafana dashboards for Prometheus

A Grafana Prometheus dashboard is what most people outside the ops team will see of your monitoring. Managers, developers and the night-shift operator rarely open the Prometheus Query page, but they will keep a Grafana screen open all day. In this last lesson you install Grafana OSS 13.3 on prom01, connect it to Prometheus, import the famous Node Exporter Full dashboard in under a minute, and then build a small dashboard of your own so you understand what’s inside the imported one.

You’ll also make Prometheus scrape Grafana itself, break the data source and a variable on purpose, and finish with a short map of where to go after this course.

Where this lesson fits

Lesson 10 of 10 in Prometheus Monitoring · Phase 3: Alerts and dashboards · Before this: Lesson 9, Alertmanager and email

TimeYou needBy the end you can
About 90 minutesprom01 and node01 from the earlier lessons, Prometheus with the Lesson 7 recording rules, internet access on prom01 for aptGrafana on http://prom01.lab:3000 with the Node Exporter Full dashboard and your own four-panel dashboard with an instance drop-down

What it is, in one line

Grafana is a web application that sends PromQL queries to Prometheus and draws the answers as graphs, numbers, gauges and tables on dashboards you can share.

In Simple Words

The scoreboard at the cricket ground

At a cricket match the scorers in the box keep every ball in their book: runs, wickets, extras, overs. That book is complete and exact, but forty thousand people in the stands can’t read it. So the big scoreboard shows only what matters right now, in large numbers and colours, and the commentators put up a run-rate graph when the chase gets tight.

Prometheus is the scorebook and Grafana is the scoreboard. Grafana keeps no scores of its own; every number it shows comes from asking Prometheus.

Engineer's View

How Grafana talks to Prometheus

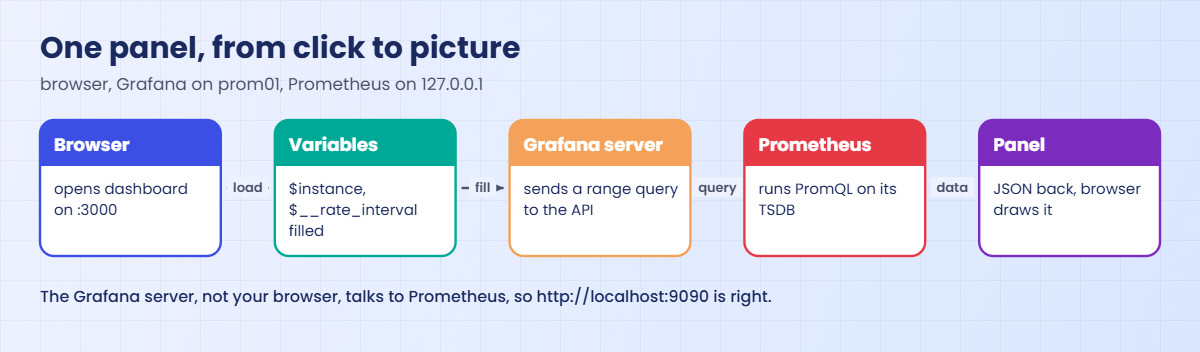
Grafana is a Go server with a web front end, its own small SQLite database (/var/lib/grafana/grafana.db) for users, dashboards and data source settings, and its config in /etc/grafana/grafana.ini. A data source tells Grafana where Prometheus is. Every panel on a dashboard holds one or more PromQL queries; when you open the dashboard, the Grafana server sends those queries to Prometheus’s /api/v1/query_range API (server-side, so your browser never needs to reach Prometheus) and the browser draws the result.

Grafana pieceWhat it isIn this lab
Data sourceConnection settings for one backendName Prometheus, URL http://localhost:9090
DashboardA page of panels saved as JSONNode Exporter Full (ID 1860) and “prom01 lab overview”
PanelOne visualisation with its queriesTime series, Stat, Gauge, Table
VariableA drop-down whose value is put into queries$instance from label_values(node_uname_info{job=”node”}, instance)
$__rate_intervalA range Grafana works out from the zoom level and scrape intervalUsed inside rate() instead of a fixed [5m]

Because Grafana runs on prom01 and Prometheus listens on 127.0.0.1:9090 since Lesson 3, http://localhost:9090 works without any password. Grafana itself listens on port 3000, and the first login is admin with password admin, which it forces you to change.

How it works, step by step

1You open a dashboard in the browser

Your laptop’s browser loads the dashboard JSON from Grafana on port 3000. The JSON lists the panels, their positions, their queries and the variables at the top. Grafana fills in variables such as $instance and $__rate_interval before anything is sent.

2The Grafana server queries Prometheus

For each panel, the Grafana backend sends the finished PromQL with the dashboard’s time range and a step to Prometheus, gets JSON back and hands it to the browser to draw. The diagram below follows one panel from your click to the picture.

Grafana Prometheus dashboard: how a panel query travels from the browser through Grafana to Prometheus

3Variables turn one dashboard into many

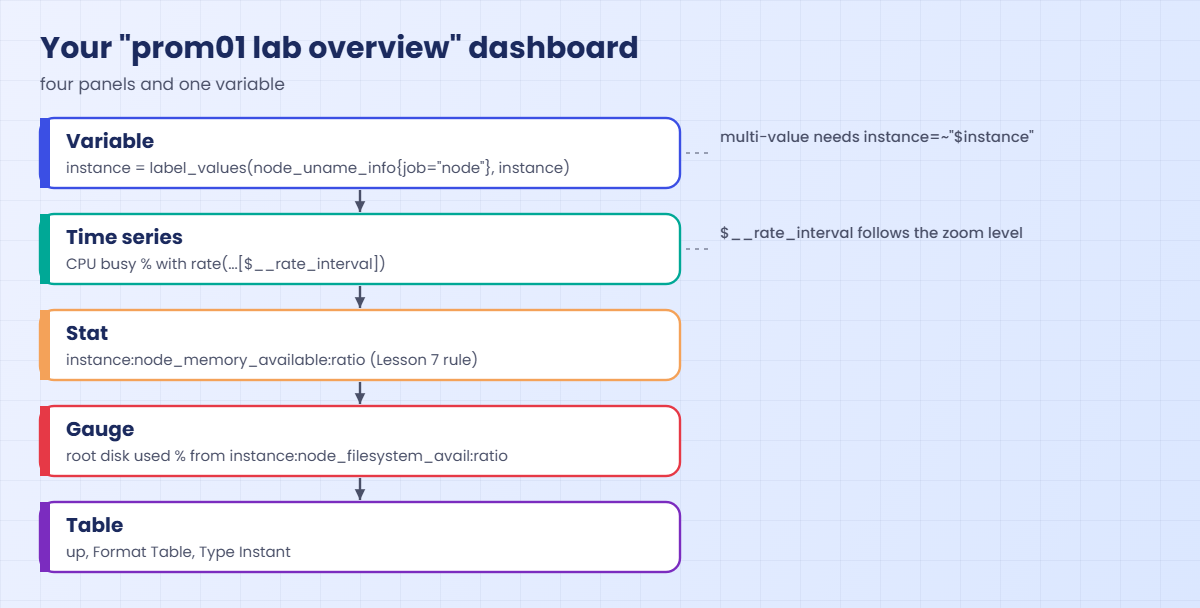
A query variable runs its own small query first, for example “all values of the instance label on node_uname_info“, and shows them as a drop-down. Panels use instance=~"$instance", so picking node01 changes every panel at once. With Multi-value or Include All turned on, Grafana joins the choices with |, which is why you must use the regex matcher =~ and not =.

4Panels pick a visualisation for the job

The same numbers can be shown many ways, and choosing well is half of a good dashboard. A trend over time wants a time series; “how much memory is available right now” wants a big single number; disk fullness reads best as a gauge with coloured thresholds; and “which targets are up” is a table. The layers below show what you’ll build.

Grafana Prometheus dashboard built in the lab: instance variable, CPU, memory, disk and targets panels

5Imported dashboards and your own

grafana.com hosts thousands of community dashboards. Node Exporter Full (ID 1860) is the one most Linux teams import first: it has panels for CPU, memory, disk, network and much more, with drop-downs for Datasource, Job, Nodename and Instance. Importing is quick, but you can’t fix a “No data” panel if you’ve never built one, so you’ll do both.

OptionGood forWatch out for
Import from grafana.comA full host view in one minutePanels may expect labels or collectors you don’t have
Build your ownThe four or five numbers your team cares aboutTakes time; keep it small and focused
Provision from filesSame dashboards and data sources on every Grafana, kept in GitProvisioned items can’t be edited in the UI

Hands-on lab: Grafana 13.3, Node Exporter Full and your own dashboard

Before you run any command, double-check it

Read every command twice before you press Enter. Check the target: the server name, the user, the disk or device name, the path and the sizes. These commands are for learning and were tested in our lab, not on your system. At work, run the read-only commands first, follow your change process, make sure a backup exists, and ask a second person to check anything that changes or deletes data. You run them at your own risk.

Everything runs on prom01. Grafana will listen on 3000, and you’ll reach it from your laptop at http://prom01.lab:3000 (the laptop’s hosts file got prom01.lab in Lesson 3). The Grafana screens change a little between 13.x releases, so if a button label differs slightly, look for the nearest match.

1Add the Grafana APT repository

Paste this whole block:

sudo apt-get install -y apt-transport-https wget gnupg
sudo mkdir -p /etc/apt/keyrings
sudo wget -O /etc/apt/keyrings/grafana.asc https://apt.grafana.com/gpg-full.key
sudo chmod 644 /etc/apt/keyrings/grafana.asc
echo "deb [signed-by=/etc/apt/keyrings/grafana.asc] https://apt.grafana.com stable main" | sudo tee /etc/apt/sources.list.d/grafana.list
sudo apt-get update

You should see the repository line echoed back by tee:

deb [signed-by=/etc/apt/keyrings/grafana.asc] https://apt.grafana.com stable main

Then apt-get update prints a Get or Hit line for https://apt.grafana.com stable InRelease and one for stable/main amd64 Packages, and finishes with Reading package lists... Done. If you get a GPG or NO_PUBKEY error instead, the key download failed, so run the wget line again.

The signed-by part means apt trusts this key only for the Grafana repository, not for every package on the system. This is the method Grafana documents for Debian and Ubuntu; the old apt-key method is deprecated and you shouldn’t use it on new systems.

✅ Checkpoint: apt-get update fetches the apt.grafana.com stable InRelease without a GPG error.

2Install Grafana OSS and start it

Run this:

sudo apt-get install -y grafana
sudo systemctl daemon-reload
sudo systemctl enable --now grafana-server
apt-cache policy grafana | head -7
systemctl is-active grafana-server

You should see this:

grafana:
  Installed: 13.3.0
  Candidate: 13.3.0
  Version table:
 *** 13.3.0 500
        500 https://apt.grafana.com stable/main amd64 Packages
        100 /var/lib/dpkg/status
active

*** marks the version that’s installed. 500 is the priority apt gives a normal enabled repository, and the 100 line is dpkg’s own record of the installed package. Without head the table goes on with every older release in the repository, starting with 13.2.5 and 13.2.4.

Grafana Prometheus dashboard install on prom01: apt-cache policy shows grafana 13.3.0 from apt.grafana.com stable/main and grafana-server active
apt-cache policy on prom01: grafana 13.3.0 installed from apt.grafana.com stable/main, and grafana-server active

The package is called grafana (the open-source edition) and the service is grafana-server. Your minor version may be newer; anything starting with 13.3 behaves the same for this lesson. Logs go to the journal and to /var/log/grafana/grafana.log.

✅ Checkpoint: grafana-server is active and apt-cache shows a 13.3 version installed.

Grafana Prometheus dashboard lab: Grafana health check and up{job=
Lab steps 3 and 8: the Grafana health API on prom01 and Prometheus scraping Grafana on localhost:3000.

3Open port 3000 to your laptop and log in

Run this:

sudo ufw allow from 192.168.56.1 to any port 3000 proto tcp
curl -s http://localhost:3000/api/health

You should see this (the commit hash is cut here as “…”):

Rule added
{
  "database": "ok",
  "version": "13.3.0",
  "commit": "..."
}

Browse from your laptop to http://prom01.lab:3000, log in as admin with password admin, and set a new password when asked. Don’t skip that screen; a Grafana with admin/admin on a network is one of the most common findings in security audits.

✅ Checkpoint: You are logged in to Grafana as admin with your own password.

4Add Prometheus as a data source

Go to Connections > Add new connection, search for Prometheus, open it and click Add new data source. Fill in only these fields and leave the rest as they are:

FieldValue
NamePrometheus
Prometheus server URLhttp://localhost:9090
AuthenticationNo Authentication
Scrape interval (under Interval behaviour)15s
Prometheus type (under Performance)Prometheus

Click Save & test at the bottom. You should see a green box saying Successfully queried the Prometheus API. Setting the scrape interval to the same 15 seconds as prometheus.yml matters, because Grafana uses it to work out $__rate_interval; if it’s wrong, rate() panels can come out empty when you zoom in.

Grafana Prometheus dashboard setup: Prometheus data source at http://localhost:9090 after Save & test succeeds
The Prometheus data source after Save & test: URL http://localhost:9090, scrape interval 15s and the green success message.

At work you’d usually create the data source from a file instead, so it’s the same on every Grafana: put a YAML file with apiVersion: 1 and a datasources list (name Prometheus, type prometheus, access proxy, url http://localhost:9090) in /etc/grafana/provisioning/datasources/ and restart Grafana.

✅ Checkpoint: Save & test shows “Successfully queried the Prometheus API.”

5Import Node Exporter Full (ID 1860)

Go to Dashboards > New > Import dashboard. Type 1860 in the box and click Load. On the next screen choose your Prometheus data source in the drop-down at the bottom and click Import.

The dashboard opens with four drop-downs at the top: Datasource, Job (filled from label_values(node_uname_info, job)), Nodename and Instance. Pick Job node and Nodename node01, and you’ll see node01’s CPU, memory, disk and network panels. Switch Nodename to prom01 to see the monitoring server itself.
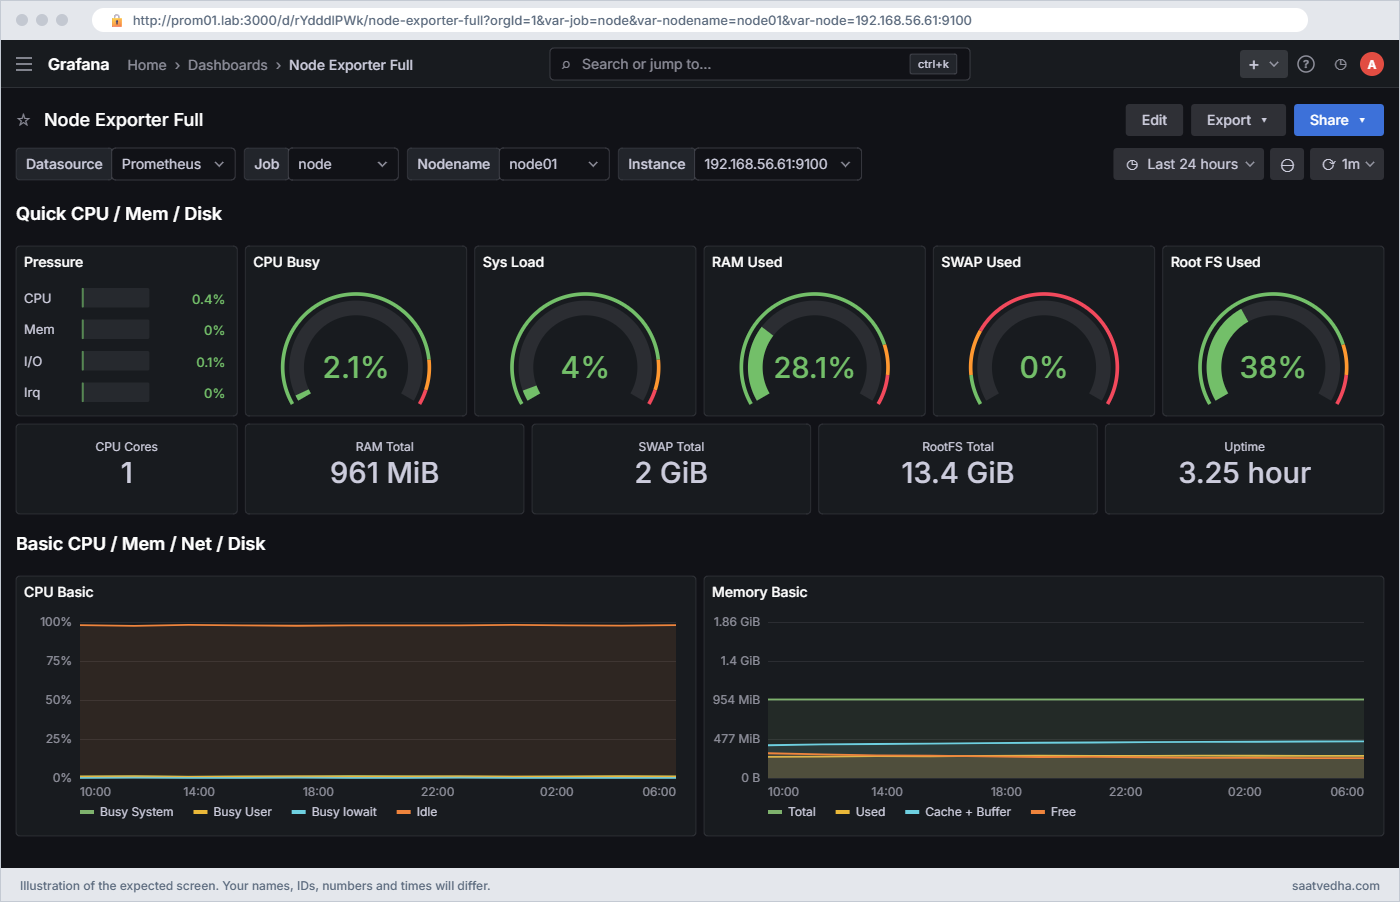
Grafana Prometheus dashboard: Node Exporter Full (ID 1860) showing node01 at 192.168.56.61:9100 with the Quick CPU / Mem / Disk row
Node Exporter Full with Job node, Nodename node01 and Instance 192.168.56.61:9100 selected. The top row gives you CPU, memory, swap and root disk at a glance.

✅ Checkpoint: Node Exporter Full shows live CPU, memory and disk numbers for node01 and prom01.

6Create your own dashboard with an instance variable

Go to Dashboards > New > New dashboard. Before adding panels, add the variable: click Edit if needed, then the Add new element (plus) icon and choose Variable. Choose type Query and fill it in like this:

FieldValue
Nameinstance
LabelInstance
Data sourcePrometheus
Query typeLabel values
Labelinstance
Metricnode_uname_info (add the filter job = node)
RefreshOn dashboard load
Multi-value and Include All valueOn

Click Preview, and the preview should list 192.168.56.60:9100 and 192.168.56.61:9100. Apply, then Save the dashboard with the title prom01 lab overview. The same thing written as a classic query is label_values(node_uname_info{job="node"}, instance).

✅ Checkpoint: The new dashboard has an Instance drop-down listing both lab servers plus All.

7Add the four panels

For each panel, use Add new element > Panel (or + Add visualization on an empty dashboard), pick the Prometheus data source, switch the query editor from Builder to Code, paste the query, click Refresh and choose the visualisation on the right.

Panel queries (paste one per panel):

# 1. Time series, title "CPU busy %", unit Percent (0-100), legend {{instance}}
100 * (1 - avg by (instance) (rate(node_cpu_seconds_total{job="node", mode="idle", instance=~"$instance"}[$__rate_interval])))

# 2. Stat, title "Memory available", unit Percent (0.0-1.0)
instance:node_memory_available:ratio{instance=~"$instance"}

# 3. Gauge, title "Root disk used", unit Percent (0-100), thresholds 70 orange, 85 red
100 * (1 - instance:node_filesystem_avail:ratio{instance=~"$instance"})

# 4. Table, title "Scrape targets", Format: Table, Type: Instant
up

Panels 2 and 3 use the recording rules you made in Lesson 7, so Grafana asks Prometheus for one cheap pre-computed series instead of doing the division on every refresh. For the table, add the Organize fields by name transformation to hide the Time column and rename Value to “Up”. Save the dashboard when all four look right.

Grafana Prometheus dashboard built in the lab: prom01 lab overview with CPU, memory, root disk and scrape target panels for node01
Your prom01 lab overview with Instance set to node01: CPU busy %, memory available, root disk used and the scrape targets table.

To check what Grafana will ask for, run the CPU query against Prometheus yourself:

curl -s http://localhost:9090/api/v1/query --data-urlencode 'query=100 * (1 - avg by (instance) (rate(node_cpu_seconds_total{job="node",mode="idle"}[1m])))' | jq -c '.data.result[] | [.metric.instance, .value[1]]'

You should see this (your numbers will differ):

["192.168.56.60:9100","6.533333333332442"]
["192.168.56.61:9100","1.8666666666666742"]

If curl gives numbers but the panel says No data, the problem is in Grafana (variable, data source or time range), not in Prometheus. That one check saves a lot of guessing.

✅ Checkpoint: All four panels show data for All, and choosing one instance changes the CPU, memory and disk panels.

8Let Prometheus scrape Grafana

Grafana exposes its own metrics at /metrics on port 3000, switched on by default ([metrics] enabled = true in the defaults). Add a job at the end of scrape_configs in /etc/prometheus/prometheus.yml:

Add this job:

  - job_name: grafana
    static_configs:
      - targets: ['localhost:3000']

Then run this:

curl -s http://localhost:3000/metrics | grep '^grafana_build_info'
promtool check config /etc/prometheus/prometheus.yml && curl -s -X POST http://localhost:9090/-/reload
sleep 20; curl -s http://localhost:9090/api/v1/query --data-urlencode 'query=up{job="grafana"}' | jq -c '.data.result[] | [.metric.instance, .value[1]]'

You should see this (build details and the promtool lines are cut here as “…”):

grafana_build_info{branch="...",edition="oss",goversion="...",revision="...",version="13.3.0"} 1
...
 SUCCESS: /etc/prometheus/prometheus.yml is valid prometheus config file syntax
...
["localhost:3000","1"]

Now your monitoring watches its own dashboards server too, and you could add an InstanceDown-style alert for up{job="grafana"} == 0. With this, prom01 runs every job from the course: prometheus, node, alertmanager and grafana.

✅ Checkpoint: up{job=”grafana”} returns 1 for localhost:3000.

Break It, Then Fix It

Two problems you’ll meet in your first week with Grafana. Neither can hurt anything, but take a snapshot of prom01 if you’d like a clean point to come back to.

1The data source can’t reach Prometheus

Many guides tell you to use the server’s IP address. Open Connections > Data sources > Prometheus, change the URL to http://192.168.56.60:9090 and click Save & test.

You’ll get this error:

There was an error returned querying the Prometheus API.

Run this on prom01 to see why:

curl -sS http://192.168.56.60:9090/-/healthy
sudo ss -ltnp | grep 9090

You should see this:

curl: (7) Failed to connect to 192.168.56.60 port 9090 after 0 ms: Couldn't connect to server
LISTEN 0      4096       127.0.0.1:9090       0.0.0.0:*    users:(("prometheus",pid=1010,fd=8))

Since Lesson 3, Prometheus listens only on 127.0.0.1, so nothing (not even prom01 itself) can reach it on 192.168.56.60. The Grafana server makes the connection, not your browser, so localhost is correct as long as Grafana and Prometheus are on the same machine. A typo like localhost:9091 or a stopped Prometheus gives the same red box, and a URL without http:// gives “Failed to parse data source URL”.

Fix:

Prometheus server URL: http://localhost:9090   then Save & test

✅ Checkpoint: Save & test shows “Successfully queried the Prometheus API.” again.

2“No data” because of a variable and a matcher

Edit the CPU panel of your own dashboard and change instance=~"$instance" to instance="$instance". With Instance set to All, click Refresh.

You’ll get this:

No data

With All or several values selected, Grafana turns $instance into a regex such as 192\.168\.56\.60:9100|192\.168\.56\.61:9100. The equals matcher looks for an instance literally called that whole string, and there is none. Click the panel menu, Inspect > Query, to see the exact query Grafana sent; it’s the quickest way to debug any No data panel.

The same symptom appears in imported dashboards when the job label doesn’t match: if your scrape job were called node_exporter and a panel had job="node" hard-coded, or the Job drop-down in Node Exporter Full showed a job that has no node_uname_info, every panel would be empty. Check with count by (job) (node_uname_info) on the Prometheus Query page.

Fix:

instance=~"$instance"   (regex matcher), then Refresh and Save

✅ Checkpoint: The CPU panel draws one line per instance again with Instance set to All.

This happened at work

The dashboard that showed yesterday

An on-call engineer I trained shared this from a government e-services portal in Delhi, the kind of site citizens use for certificates and bill payments. On the last day for a property tax deadline, the wall screen in the operations room showed every server green and CPU around 30%, while the helpdesk phones were ringing about slow pages. The team spent twenty minutes checking the load balancers because “the dashboard says the servers are fine”.

Someone finally clicked the time picker. The wall screen’s browser had been left on a saved link with a fixed time range from the previous afternoon, so it was faithfully showing yesterday. The live view showed the two application servers at 95% CPU and the database connection pool full since 10 am.

They added servers for the day, and the next week they fixed the screen: every dashboard on the wall now uses a relative range (last 6 hours, auto-refresh 30 seconds), the dashboard JSON is kept in Git and provisioned so nobody can save over it by accident, and there’s a stat panel at the top showing time() - max(timestamp(up)) in seconds, so a frozen screen is obvious at a glance. The CPU alerts from Lesson 8 had fired correctly, by the way, but went to an email list nobody in that room was on.

Common mistakes and troubleshooting

MistakeWhat happensWhat to do instead
Keeping admin/admin or opening 3000 to everyoneAnyone on the network can log in and read or change dashboards and data sourcesChange the password at first login, limit 3000 with ufw, and put Grafana behind HTTPS at work
Using the server IP in the data source while Prometheus listens on 127.0.0.1Save & test fails with “error returned querying the Prometheus API”Use http://localhost:9090 when Grafana runs on the same host
instance=”$instance” with a multi-value variableNo data as soon as All or two values are selectedUse instance=~”$instance” for every variable
A fixed [5m] or [1m] in rate() on dashboardsJagged or empty graphs when zooming in or outUse $__rate_interval and set the data source scrape interval to 15s
Editing an imported dashboard and later re-importing itYour changes are overwrittenSave a copy under a new name, or keep the JSON in Git and provision it
Forgetting the admin passwordLocked out of your own GrafanaOn the server run sudo grafana cli admin reset-admin-password with a new password

Interview questions

Click a question to open it. Each one is written the way an interviewer would ask it. Under it you will see why they ask it and one way you could answer, in your own words.

Fresher level

1. What is the difference between Prometheus and Grafana?

Why they ask this: They want to see you know that Grafana stores no metrics.

How you might answer: Prometheus scrapes and stores the metrics and answers PromQL queries. Grafana stores no metric data at all; it keeps dashboards and data source settings in its own database and sends PromQL to Prometheus every time a panel refreshes.

In my lab Grafana talks to Prometheus at http://localhost:9090 on the same VM, and Prometheus also scrapes Grafana’s /metrics on port 3000.

2. How would you get a full Linux host dashboard quickly?

Why they ask this: A practical question about community dashboards.

How you might answer: I’d import Node Exporter Full, dashboard ID 1860 from grafana.com, through Dashboards, New, Import dashboard, and pick the Prometheus data source. It uses node_uname_info for its Job, Nodename and Instance drop-downs, so it works as soon as node_exporter is scraped.

2–5 years experience

3. A Grafana panel shows “No data” but the metric exists. How do you troubleshoot?

Why they ask this: They are checking a systematic debugging path.

How you might answer: I open Inspect, Query on the panel to see the exact PromQL Grafana sent, then paste it into the Prometheus Query page. If Prometheus returns data, the issue is in Grafana: usually a multi-value variable used with = instead of =~, a wrong job label, or a time range or $__rate_interval problem.

If Prometheus also returns nothing, I go back to the target: is it up, is the label called job=”node”, and is the metric name right.

4. Why use $__rate_interval instead of [5m] in dashboard queries?

Why they ask this: They want to hear about step, resolution and scrape interval.

How you might answer: Grafana changes the query step with the zoom level. A fixed short range can be smaller than the step and skip data, and a fixed long one smooths away spikes. $__rate_interval is calculated as the larger of interval plus scrape interval and four times the scrape interval, so rate() always has at least four samples.

For that to work, the data source’s scrape interval must match Prometheus, 15 seconds in my setup.

Senior level

5. How would you manage dashboards for 20 teams so they stay consistent and don’t get broken by accident?

Why they ask this: They are looking for dashboards as code and access control thinking.

How you might answer: I’d keep dashboard JSON and data source definitions in Git and provision them through Grafana’s provisioning folders or the Grafana Terraform provider, with folders per team and permissions so only owners can edit. Shared dashboards like the host view are provisioned read-only, and teams make copies to experiment.

Changes go through pull requests, and we use recording rules for expensive panels so a wall of dashboards doesn’t overload Prometheus.

6. Your company is moving to Kubernetes and wants to keep a year of metrics. What would you change from a single Prometheus and Grafana setup?

Why they ask this: They want to see you know the wider ecosystem and when to use it.

How you might answer: In Kubernetes I’d deploy with the kube-prometheus-stack Helm chart, which brings the Prometheus Operator, Alertmanager, Grafana and ready-made dashboards and alerts. For a year of data I’d add long-term storage such as Thanos or Grafana Mimir with object storage, using remote write or a sidecar, and query it through one Grafana data source.

Federation or a global view would cover several clusters, and I’d add Loki for logs so Grafana can show metrics and logs side by side.

Quick quiz

Q1. Which port does Grafana listen on by default, and what is the first login?

  1. 9090, admin/prometheus
  2. 3000, admin/admin
  3. 9093, admin/admin
  4. 8025, no login
Show answer

B — Grafana listens on 3000 and the first login is admin/admin, after which it asks you to set a new password.

Q2. Grafana runs on prom01 and Prometheus listens on 127.0.0.1:9090. Which data source URL works?

  1. http://192.168.56.60:9090
  2. http://localhost:9090
  3. http://prom01.lab:3000
  4. http://localhost:9093
Show answer

B — The Grafana server makes the connection, and Prometheus only listens on localhost, so http://localhost:9090 is right.

Q3. What is the ID of the Node Exporter Full dashboard on grafana.com?

  1. 1860
  2. 3000
  3. 9100
  4. 12345
Show answer

A — Node Exporter Full is dashboard 1860.

Q4. A multi-value $instance variable is set to All. Which matcher should the panel use?

  1. instance=”$instance”
  2. instance!=”$instance”
  3. instance=~”$instance”
  4. instance!~”$instance”
Show answer

C — Multiple values are joined with | into a regex, so you need the regex matcher =~.

Q5. Where does Grafana keep the actual metric samples it draws?

  1. In /var/lib/grafana/grafana.db
  2. In its own time series database
  3. It doesn’t; it queries Prometheus each time
  4. In the browser cache
Show answer

C — Grafana stores dashboards and settings, but every number comes from a live query to the data source.

Quick recap

  • Grafana draws dashboards from PromQL queries it sends to Prometheus; it stores dashboards and settings, never the metrics themselves.
  • Install Grafana OSS from apt.grafana.com with a signed-by keyring, change the admin password at first login, and add Prometheus at http://localhost:9090.
  • Node Exporter Full (ID 1860) gives a complete host view in a minute; your own small dashboard teaches you how panels, variables and $__rate_interval work.
  • Multi-value variables need =~, and Inspect > Query plus the Prometheus Query page solve most No data problems.
  • Your lab now runs Prometheus, node_exporter, Alertmanager, Mailpit and Grafana, with every component scraped and the key alerts and dashboards in place.

What’s next

You have finished the course. Go back to the Prometheus Monitoring course page to review any lesson, and strengthen the Linux side with Linux performance monitoring and the Linux Administration course. After that, the natural next steps are kube-prometheus-stack on Kubernetes, Loki for logs and Thanos or Mimir for long-term storage.

Further reading: Grafana Prometheus dashboard

Want to go deeper into Grafana Prometheus dashboard? Grafana’s own guides cover installing on Debian and Ubuntu, configuring the Prometheus data source, Prometheus template variables and troubleshooting, and the Node Exporter Full page shows the dashboard’s revisions. For the next steps, read about the kube-prometheus-stack Helm chart and Prometheus federation.

To strengthen the Linux side, see Linux performance monitoring and the Linux Administration course. You can also see the full plan for this course on the Prometheus Monitoring course page.

Scroll to Top

This website uses cookies

We use a few cookies to keep this site working. If you allow it, we also use Google Analytics to count visits so we can improve our lessons. You can accept all, deny the optional ones, or choose what to allow.