Grafana dashboard variables and repeating panels

Grafana dashboard variables turn one dashboard into many. Instead of building “CPU for app01” and “CPU for graf01” as two dashboards, you add a drop-down called $instance at the top, write the query once, and Grafana fills in whatever the viewer picks. In this lesson you add every variable type you’ll meet at work to the Server Overview dashboard from Lesson 4, chain two of them together and make panels and rows repeat for each server.

You also see what Grafana sends to Prometheus after it replaces the variables, which is the fastest way to debug the three mistakes everyone makes with them.

Where this lesson fits

Lesson 5 of 14 in Grafana Dashboards and Observability · Phase 2: Data sources, logs and metrics · Before this: Lesson 4, your first Grafana dashboard · Next: Lesson 6, MySQL in Grafana

TimeYou needBy the end you can
About 80 minutesgraf01 and app01 from Lesson 4 with Prometheus, node_exporter and the Server Overview dashboardBuild chained, multi-value variables, use $__rate_interval correctly, repeat panels and rows, and fix variables that return nothing

What it is, in one line

A dashboard variable is a named placeholder, shown as a drop-down or text box at the top of the dashboard, whose current value Grafana substitutes into every query, title and link before running them.

In Simple Words

The tiffin service order form

A tiffin service in Noida doesn’t print a separate menu for every customer. It prints one form with blanks: name, flat number, number of rotis, veg or non-veg. The kitchen reads the same form all day and fills each box with what that customer ticked.

Some blanks depend on others: once you tick “non-veg”, the curry list changes to chicken or egg. A Grafana variable is a blank on that form, and a chained variable is the curry list that changes with your first tick.

Engineer's View

Variable types and where their values come from

Variables live in the dashboard JSON under templating. Grafana resolves them in order before panels run, replacing $name or ${name} in queries, panel titles, data links and even other variables’ queries. The older [[name]] form still works but is deprecated.

TypeValues come fromTypical use
QueryA data source query, for Prometheus a “Label values” lookup such as all instance values of upPick a server, job, database or mount point
CustomA comma-separated list you type inFixed choices such as CPU modes or environments
Text boxWhatever the viewer types, with a defaultOpen filters such as a regex or a URL path
ConstantOne hidden valueA prefix or cluster name shared by many queries
Data sourceAll data sources of one typeSame dashboard against prod and test Prometheus
IntervalA list of durations, optionally with autoSmoothing windows like 1m, 5m, 1h
SwitchOn/off pair of values (new in Grafana 13)Show debug series or not

Two built-in variables matter most for Prometheus. $__interval is the step Grafana picks from the time range and panel width, and $__rate_interval is max($__interval + scrape_interval, 4 * scrape_interval), which always gives rate() at least four samples to work with. The scrape interval comes from the data source setting you made in Lesson 4 (15s).

How it works, step by step

1Grafana runs variable queries first

When the dashboard loads, Grafana evaluates variables top to bottom. A query variable for Prometheus calls the label values API, for example /api/v1/label/instance/values with a match[] selector, and fills the drop-down. The diagram below shows the whole sequence for a chained job and instance pair.

2Chained variables wait for their parent

If the instance query contains $job, Grafana knows it depends on job. When the viewer changes job, Grafana re-runs only the instance query, and then the panels. This is how a 500-server dashboard stays usable: pick a team or job first, then a short list of servers.

Grafana dashboard variables: how chained job and instance variables load and are formatted for Prometheus

3Values are formatted for the data source

A single value is inserted as it is. With Multi-value or Include All, Grafana formats the selection for Prometheus as a regex alternation such as (graf01:9100|app01:9100), escaping regex characters in each value. That’s why the selector must use =~; with = Prometheus looks for an instance literally named “(graf01:9100|app01:9100)” and finds nothing.

4Panels and rows can repeat per value

A panel or row set to repeat by instance is cloned once per selected value, and in each clone $instance holds one value only. The second diagram shows how one CPU panel becomes two when two servers are selected, and how a repeated row carries several panels per server.

Grafana dashboard variables: repeating panels and rows by $instance and keeping them fast

5Formatting options and the built-in variables

You can force a format with ${var:format}. The ones you’ll use most are below, and the full list is in the Grafana docs.

SyntaxResult for graf01:9100 and app01:9100Use it when
${instance}(graf01:9100|app01:9100) for PrometheusNormal PromQL with =~
${instance:pipe}graf01:9100|app01:9100You need the bare list, for example in a title
${instance:csv}graf01:9100,app01:9100SQL IN lists, URLs that take commas
${instance:raw}Values with no escapingYou know the value is safe and want it untouched
${__dashboard.uid}, ${__url_time_range}The dashboard UID and from/to in URL formLinks that keep the current time range

Pick $__rate_interval for rate() and increase(), and $__interval for functions like avg_over_time() where you want one point per step. Never hard-code [1m] on a dashboard that people zoom out to 30 days, because the step then jumps over most samples.

Hands-on lab: job, instance and five more variables on Server Overview

Before you run any command, double-check it

Read every command twice before you press Enter. Check the target: the server name, the user, the disk or device name, the path and the sizes. These commands are for learning and were tested in our lab, not on your system. At work, run the read-only commands first, follow your change process, make sure a backup exists, and ask a second person to check anything that changes or deletes data. You run them at your own risk.

Everything happens on the Server Overview dashboard at https://graf01.lab/ unless a step says graf01. Click Edit before each step and Save with a short note after it, so the version history tells the story of this lesson.

1Add a job variable

In edit mode click Add new element > Variable (or the Add variable plus at the top). Choose type Query and fill in:

FieldValue
Namejob
LabelJob
Data sourcePrometheus
Query typeLabel values
Labeljob
Metricup
RefreshOn dashboard load
SortAlphabetical (asc)

The preview at the bottom should list node and prometheus. The same lookup in the old classic syntax is label_values(up, job), which you’ll see in many older dashboards.

Check the same values from graf01:

curl -s -G localhost:9090/api/v1/label/job/values --data-urlencode 'match[]=up'; echo

You should see:

{"status":"success","data":["node","prometheus"]}

✅ Checkpoint: A Job drop-down appears at the top of the dashboard with node and prometheus.

2Add a chained instance variable

Add another Query variable. This one reads job from the first, allows several servers and hides the port in the drop-down.

FieldValue
Name / Labelinstance / Server
Query typeLabel values
Labelinstance
Metricup
Label filtersjob =~ $job
Regex/([^:]+):.*/
Apply regex toDisplay text
Multi-valueOn
Include All optionOn
RefreshOn time range change

Set Job to node. The Server drop-down now shows graf01 and app01, while the values behind them stay graf01:9100 and app01:9100, because the regex only changes the display text. Values that don’t match a variable regex at all are dropped from the list, so the pattern must fit every value you want to keep.

Pick All.

Grafana dashboard variables: the chained instance query variable with label filter job =~ $job and a display regex
The instance variable: Label values of instance on up, filtered by job =~ $job, with a regex that changes only the display text.

Check the chained lookup from graf01:

curl -s -G localhost:9090/api/v1/label/instance/values --data-urlencode 'match[]=up{job=~"node"}'; echo

You should see:

{"status":"success","data":["app01:9100","graf01:9100"]}

✅ Checkpoint: Changing Job to prometheus shows localhost in Server, and changing it back to node shows graf01 and app01.

Grafana dashboard variables lab: label values lookup and why = fails with a multi-value regex
The chained instance lookup and the empty result an = matcher gives with a multi-value selection.

3Use the variables in the panels

Edit each panel and add the two matchers. For example the CPU and memory queries become:

100 * (1 - avg by (instance) (rate(node_cpu_seconds_total{job=~"$job", instance=~"$instance", mode="idle"}[$__rate_interval])))

100 * node_memory_MemAvailable_bytes{job=~"$job", instance=~"$instance"}
  / node_memory_MemTotal_bytes{job=~"$job", instance=~"$instance"}

Do the same for the disk gauge, load bar gauge and Targets table. Then open the CPU panel menu and choose Inspect > Query and click Refresh. The request still shows $__rate_interval, because the browser fills in your own variables and leaves the time variables to the Grafana server.

The response carries a field called executedQueryString with the query Prometheus ran.

With Job node, Server All and Last 1 hour, executedQueryString reads:

Expr: 100 * (1 - avg by (instance) (rate(node_cpu_seconds_total{job=~"node", instance=~"(app01:9100|graf01:9100)", mode="idle"}[1m0s])))
Step: 15s

All became a regex with both servers, and $__rate_interval became 1m0s, which is how the Go code inside Grafana writes 60 seconds. With a 1-hour range the step is 15s (the scrape interval you set on the data source), and max(15s + 15s, 4 x 15s) is 60s. Pick only app01 in the drop-down and every panel narrows to one server.

✅ Checkpoint: Selecting one server changes all five panels, and the query inspector shows the substituted query with =~.

4Add a custom variable for CPU modes

Add a Custom variable named cpu_mode, label “CPU mode”, values user,system,iowait,steal, Multi-value and Include All on. Add a new time series panel CPU time by mode with unit Percent (0.0-1.0), stacked (Graph styles > Stack series > Normal):

sum by (instance, mode) (
  rate(node_cpu_seconds_total{instance=~"$instance", mode=~"$cpu_mode"}[$__rate_interval])
)

Check the shape of the answer from graf01:

curl -s localhost:9090/api/v1/query --data-urlencode \
  'query=count(sum by (instance, mode) (rate(node_cpu_seconds_total{mode=~"user|system|iowait|steal"}[1m])))'; echo

You should see (your timestamp will differ):

{"status":"success","data":{"resultType":"vector","result":[{"metric":{},"value":[1794119650.021,"8"]}]}}

Eight series: four modes for each of two servers. Untick everything except iowait and the panel shows only disk wait time, a handy view when someone says “the server feels slow”.

✅ Checkpoint: The CPU time by mode panel follows both the Server and the CPU mode drop-downs.

5Add interval, text box and constant variables

Add three more variables:

NameTypeSettings
smoothIntervalValues 1m,5m,15m,1h; Auto option on, Step count 30, Min interval 1m
mountText boxDefault value /
envConstantValue lab (constants are always hidden)

Change the bar gauge query to avg_over_time(node_load1{instance=~"$instance"}[$smooth]) and its title to Load (avg over $smooth) in $env. In the disk gauge use mountpoint="$mount" instead of the fixed slash. Type /boot in the Mount box (if your VM has a separate /boot) and the gauge follows; an empty result means no such mount point on that server.

List the mount points node_exporter reports, from graf01:

curl -s -G localhost:9090/api/v1/label/mountpoint/values --data-urlencode 'match[]=node_filesystem_size_bytes{fstype!~"tmpfs|overlay"}'; echo

With Ubuntu’s default LVM layout, which puts /boot on its own partition, you should see:

{"status":"success","data":["/","/boot"]}

If you installed without LVM and without a separate /boot, the list holds only "/".

✅ Checkpoint: The bar gauge title reads “Load (avg over 5m) in lab” when Smooth is 5m, and the disk gauge follows the Mount text box.

6Make the data source a variable

Add a Data source variable named ds, type Prometheus. Then in each panel pick ${ds} at the top of the data source list instead of “Prometheus”, and set the same ${ds} as the data source of the job and instance variables. You have one Prometheus today, so nothing changes on screen, but when a second Prometheus (test or another site) is added later, one drop-down switches the whole dashboard.

✅ Checkpoint: Every panel and both query variables use ${ds}, and the dashboard looks the same as before.

7See $__interval and $__rate_interval change with the time range

Open the CPU panel’s query inspector again and note the Step and the range in brackets in executedQueryString. For Last 1 hour you saw Step: 15s and [1m0s]. Now change the time picker to Last 24 hours and then Last 7 days, refresh each time and write the two values down.

The step grows with the range, and how far depends on how wide your panel is, because Grafana aims for about one point per pixel. The rate window follows one fixed rule from Grafana’s code: it’s the step plus one scrape interval, but never less than four scrapes (1m0s here). Set the time picker back to Last 1 hour.

✅ Checkpoint: The query inspector shows a longer Step for 7 days than for 1 hour, the rate window is always 15s longer than the step or at least 1m0s, and the CPU graph has no gaps at either range.

8Repeat the CPU panel for each server

Edit the CPU busy % panel, open Repeat options in the panel options pane, set Repeat by variable to instance, direction Horizontal and Max per row 2. Change the panel title to CPU busy % on $instance and save.

With Server set to All you now get two CPU panels side by side, one per server, each with one line. Pick only graf01 and the dashboard shows a single panel. Only the first panel is editable; the clones follow it.
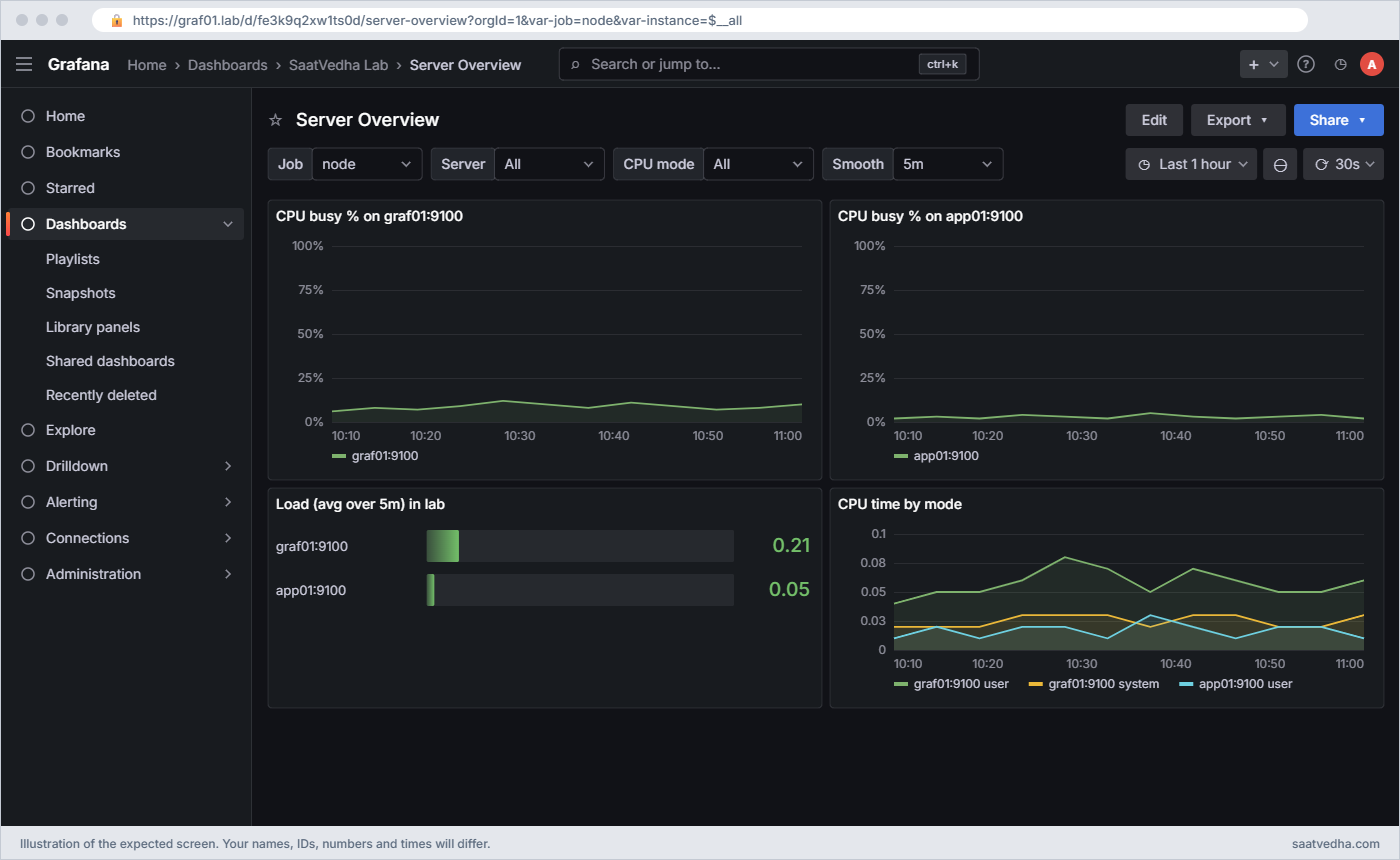
Grafana dashboard variables: Server Overview with Job and Server drop-downs and the CPU panel repeated per server
Server Overview with Job set to node and Server set to All: the CPU busy % panel repeats once per server, and the bar gauge title shows $smooth and $env filled in.

✅ Checkpoint: Two CPU panels appear when Server is All, titled with each server, and one when a single server is picked.

9Repeat a whole row per server

Add a new row with Add new element > Add row/Group into rows, title it Host: $instance, and move the memory stat and disk gauge into it. Select the row and in the edit pane set Repeat by variable to instance. With All selected you get one “Host: graf01:9100” row and one “Host: app01:9100” row, each with its own memory and disk panels.

Repeated rows are the clean way to build “one block per server” pages, and collapsing them keeps the dashboard light, because collapsed rows don’t query.

✅ Checkpoint: Two rows titled Host: graf01:9100 and Host: app01:9100 appear, each with a memory stat and a disk gauge.

10Add a dashboard link and a data link

Open Dashboard options > View all settings > Links > Add dashboard link. Type Dashboards, With tags linux, and tick Include current time range and Include current template variable values. Every dashboard with the linux tag now appears as a link at the top, and clicking it keeps your time range and server choice.

Then edit the Targets table, open Data links and actions > Add link, title it “Show only this server” and set the URL to:

/d/${__dashboard.uid}/server-overview?var-instance=${__data.fields.instance}&${__url_time_range}

Clicking any row in the table now reloads the dashboard filtered to that row’s instance with the same time range. Save with the note “variables, repeats and links”.

✅ Checkpoint: Clicking app01:9100 in the Targets table reloads Server Overview with Server set to app01 only.

Break It, Then Fix It

All three of these come from real tickets. Save first, so you can restore from Versions if you get lost.

1The variable returns nothing, or shows an error

Edit the instance variable and make two mistakes, one at a time. First change Metric from up to upp, then switch the query type to Classic query and type label_values(up{job=~"$job", instance) with the closing brace missing.

You’ll get this:

Metric "upp":   Server drop-down is empty, every panel says No data, no error shown
Missing brace:  a red warning triangle next to "Server"; hovering it shows Prometheus'
                parse error, which ends in "unexpected end of input inside braces"

A misspelled metric is a valid query with no results, so Grafana stays quiet and you only notice the empty list. A syntax error is a real failure from Prometheus, and Grafana 13 shows it as a warning icon on the variable label instead of the old “Templating [instance] Error updating options” pop-up. Either way, copy the variable’s query into Explore and run it there; the error or the empty result appears straight away.

Run the broken lookup from graf01 to see Prometheus’ own answer:

curl -s -G localhost:9090/api/v1/label/instance/values --data-urlencode 'match[]=up{job=~"node"'; echo
{"status":"error","errorType":"bad_data","error":"invalid parameter \"match[]\": 1:15: parse error: unexpected end of input inside braces"}

Fix:

Query type: Label values    Label: instance    Metric: up    Label filters: job =~ $job

✅ Checkpoint: The Server drop-down lists graf01 and app01 again and the warning icon is gone.

2Multi-value breaks a query that uses =

Edit the memory stat and change its matcher from instance=~"$instance" to instance="$instance". Pick one server: it works. Now pick both.

You’ll get this:

One server selected:   memory stat shows 63.8%
Two servers selected:  No data
Query inspector:       ...{instance="(app01:9100|graf01:9100)"}

With two values Grafana sends the regex alternation, and = compares it as a plain string, so Prometheus looks for a server literally named “(app01:9100|graf01:9100)”. Check it at Prometheus:

Run this on graf01:

curl -s localhost:9090/api/v1/query --data-urlencode 'query=node_load1{instance="(app01:9100|graf01:9100)"}'; echo
curl -s localhost:9090/api/v1/query --data-urlencode 'query=count(node_load1{instance=~"(app01:9100|graf01:9100)"})'; echo
{"status":"success","data":{"resultType":"vector","result":[]}}
{"status":"success","data":{"resultType":"vector","result":[{"metric":{},"value":[1794119650.026,"2"]}]}}

Fix: always use the regex matcher with multi-value or All variables:

instance=~"$instance"

✅ Checkpoint: The memory stat shows both servers when two are selected.

3Repeat shows only one panel

Edit the instance variable, turn Multi-value and Include All option off, and save. Look at the repeated CPU panels.

You’ll get this:

Only one "CPU busy % on graf01:9100" panel; no way to pick both servers

A repeat makes one clone per selected value. A single-value variable can only ever hold one value, so the repeat has nothing to clone; nothing is broken, the setting is wrong. The same thing happens when Multi-value is on but the viewer picks one server, which is often fine.

Fix:

instance variable: Multi-value On, Include All option On, select All, Save

✅ Checkpoint: With Server set to All, the CPU panel and the Host rows repeat once per server again.

This happened at work

The dashboard that took Prometheus down

A friend who runs the NOC at a cloud hosting provider in Noida told me about the Monday morning their hypervisor dashboard stopped loading for everyone. It had worked for months, but over the weekend a new engineer had “improved” it by repeating the CPU, memory and disk panels per host, with the host variable defaulting to All.

They had about 340 hypervisors. Every person who opened the dashboard caused more than a thousand panel queries, each with an instance regex listing all 340 hosts. The Prometheus server’s CPU went to 100%, queries timed out after 30 seconds, and the alerting rules on that same Prometheus started missing evaluations, which nobody noticed until a customer called.

The on-call engineer first restarted Grafana, then Prometheus, and both came back only to fall over again as soon as the NOC wall screen refreshed. What finally showed the cause was the Prometheus query log and the number of identical long regex queries from one dashboard UID.

The fix was in the dashboard, not the servers. They set the default host to a single value, put the repeated panels into a collapsed row so they only query when opened, and set a Custom all value of .* so “All” sends one short regex instead of a list of 340 names. The team also added a review rule: no repeat by a variable that can return more than about 20 values.

Common mistakes and troubleshooting

MistakeWhat happensWhat to do instead
Using = with a multi-value or All variableNo data as soon as two values are selectedUse =~ for every matcher that takes a variable
Hard-coding [1m] in rate() on dashboardsGaps when zoomed in, misleading spikes when zoomed outUse [$__rate_interval] and set the data source scrape interval
Repeating panels by a variable with hundreds of values and All as defaultThousands of queries, slow browser, overloaded PrometheusDefault to one value, use collapsed rows, set a custom all value like .*
Variables in the wrong orderA chained variable is empty on first loadPut parents (job) above children (instance) in the variables list
Regex that changes the value instead of the display textQueries look for a value without the port and match nothingSet Apply regex to Display text when you only want a nicer label
Classic label_values() with $__rangeThe range variable isn’t supported thereUse the Query result type with query_result() for time-based lookups
Refresh “On dashboard load” for fast-changing listsNew servers don’t appear until someone reloadsUse On time range change for lists that change during the day

Interview questions

Click a question to open it. Each one is written the way an interviewer would ask it. Under it you will see why they ask it and one way you could answer, in your own words.

Fresher level

1. What is a dashboard variable in Grafana, and why would you use one?

Why they ask this: They want the basic idea and one practical reason.

How you might answer: A variable is a drop-down or text box at the top of a dashboard whose value Grafana substitutes into queries, like $instance in node_load1{instance=~”$instance”}. It lets one dashboard serve every server or service instead of copying the dashboard for each one.

The values usually come from the data source, for example all instance label values of up in Prometheus.

2. Why do you write instance=~”$instance” instead of instance=”$instance”?

Why they ask this: They are checking you know how multi-value variables are formatted.

How you might answer: With Multi-value or All, Grafana sends the selection as a regex like (graf01:9100|app01:9100). The =~ matcher treats it as a regex and matches both, while = compares it as a literal string and returns nothing.

So I use =~ for every matcher that takes a variable, even if it is single-value today.

2–5 years experience

3. Walk me through building a chained job and instance selector for Prometheus.

Why they ask this: They want to hear the real settings and the dependency mechanism.

How you might answer: I add a Query variable job with Query type Label values, label job, metric up. Then an instance variable with label instance, metric up and a label filter job =~ $job, with Multi-value and Include All on and refresh on time range change.

Grafana sees $job in the instance query, so it reloads instance whenever job changes. In panels I filter with job=~”$job”, instance=~”$instance” and check the result in the query inspector.

4. Explain $__interval and $__rate_interval, and when you use each.

Why they ask this: A classic mid-level PromQL-in-Grafana question.

How you might answer: $__interval is the step Grafana picks from the time range and panel width, never below the minimum interval. $__rate_interval is max($__interval + scrape interval, 4 times scrape interval), so rate() and increase() always have at least four samples.

I use $__rate_interval inside rate and increase, and $__interval for things like avg_over_time where I want one value per step. Both depend on the scrape interval being set correctly on the data source.

Senior level

5. A shared dashboard with a host variable is slowing down Prometheus. How do you find and fix the cause?

Why they ask this: They want a method and design changes, not “add hardware”.

How you might answer: I’d look at the Prometheus query log or its query duration metrics to find the heavy queries and the dashboard they come from, then open that dashboard’s query inspector. Typical causes are repeats by a variable with hundreds of values, All as the default, and long regex alternations.

Fixes are a single-value default, a custom all value like .*, collapsed rows for repeated sections, recording rules for expensive expressions and a sensible default time range. I’d also add the rule to our dashboard review checklist.

6. How would you let one dashboard work against several Prometheus servers, for example prod and DR?

Why they ask this: They are checking you know data source variables and the pitfalls.

How you might answer: I add a Data source variable of type Prometheus and set every panel and every query variable to ${ds}. Then the viewer picks prod or DR at the top, and the label lists reload from the chosen server.

The labels must be consistent across servers, so I agree job and instance naming with the teams, and I keep the variable regex or name filter tight so test data sources don’t appear on the production list.

Quick quiz

Q1. Which matcher should you use with a multi-value instance variable?

  1. instance=”$instance”
  2. instance=~”$instance”
  3. instance!=”$instance”
  4. instance:”$instance”
Show answer

B — Multi-value selections become a regex alternation, which only =~ understands.

Q2. With a 15s scrape interval and a 1-hour range where $__interval is 15s, what is $__rate_interval?

  1. 15s
  2. 30s
  3. 1m
  4. 5m
Show answer

C — max(15s + 15s, 4 x 15s) = 60s.

Q3. A variable query has a typo in the metric name. What do you usually see?

  1. A red error pop-up
  2. An empty drop-down and No data in panels
  3. Grafana restarts
  4. The variable is deleted
Show answer

B — A wrong metric name is a valid query with no results, so Grafana shows nothing.

Q4. Why does a panel repeat show only one copy?

  1. The panel is too wide
  2. The repeat variable is single-value or only one value is selected
  3. Prometheus is down
  4. The dashboard is not saved
Show answer

B — Repeats clone one panel per selected value.

Q5. Which variable type lets the same dashboard switch between two Prometheus servers?

  1. Constant
  2. Text box
  3. Data source
  4. Interval
Show answer

C — A Data source variable lists data sources of one type for the viewer to pick.

Quick recap

  • Variables are placeholders substituted into queries, titles and links; query, custom, text box, constant, data source, interval and switch cover most needs.
  • Chain variables by referencing the parent, like job =~ $job in the instance lookup, and keep parents above children.
  • Multi-value and All become a regex alternation, so always filter with =~.
  • Use $__rate_interval for rate() and increase(); it is max($__interval + scrape interval, 4 x scrape interval).
  • Repeat panels and rows by a multi-value variable, keep the value count small and the default narrow, and add dashboard and data links that carry variables and time range.

Next lesson

Lesson 6: MySQL in Grafana: time series and table queries → You install MySQL 8 on app01 with a shop database, give Grafana a read-only user and build time series, table, bar and pie panels with $__timeFilter and $__timeGroupAlias.

Further reading: Grafana dashboard variables

Want to go deeper into Grafana dashboard variables? The Grafana docs on adding variables, variable syntax and formats and Prometheus template variables cover every option, including $__rate_interval. On SaatVedha, PromQL examples explains label matchers and rate(), and Lesson 4 builds the dashboard used here.

You can also see the full plan for this course on the Grafana Dashboards and Observability course page.

Scroll to Top

This website uses cookies

We use a few cookies to keep this site working. If you allow it, we also use Google Analytics to count visits so we can improve our lessons. You can accept all, deny the optional ones, or choose what to allow.