Users, teams, organisations and permissions in Grafana

Once more than two people use Grafana, someone asks “who can see this?” and “who changed that?”. Grafana users and teams, together with folder permissions, are how you answer. In this lesson you create a NOC viewer and an editor, group people into a team, lock folders so each group sees only what it should, and give a backup script its own service account token instead of the admin password.

You’ll also see when a separate organisation makes sense, why anonymous access is risky, and fix three permission tickets every Grafana admin gets: a viewer who can’t see a dashboard, an editor who deleted one, and a script failing with 401.

Where this lesson fits

Lesson 12 of 14 in Grafana Dashboards and Observability · Phase 3: Alerting, teams and running Grafana · Before this: Lesson 11, Grafana alerting · Next: Lesson 13, provisioning as code

TimeYou needBy the end you can
About 80 minutesgraf01 from Lesson 11 with the SaatVedha Lab dashboards, a private browser window for testing other usersCreate users, teams and folder permissions, use service account tokens for automation, and restore deleted dashboards

What it is, in one line

Every Grafana user has a role in an organisation (Viewer, Editor or Admin), teams group users so you can grant folder and dashboard permissions once, and service accounts give scripts their own tokens with their own role.

In Simple Words

The office building in Whitefield

An IT services company in Bengaluru rents three floors of one building. Everyone gets an ID card at the gate: visitors can walk the lobby, staff can enter their own floor, and facility managers can open any door. On each floor, the client project rooms have their own card readers, and access is given to a project team, not to each person, so when someone joins the team they get every room at once.

The night courier who collects backup tapes doesn’t get a staff card. He gets a courier pass that opens one store room and stops working the day his contract ends.

The ID card level is the role, the project team is a Grafana team, the room’s card reader is a folder permission, and the courier pass is a service account token.

Engineer's View

Roles, permissions and where they apply

Grafana checks two layers. The basic role a user has in an organisation sets what they can do in general. Folder and dashboard permissions (View, Edit, Admin) then decide which folders and dashboards that applies to; dashboards inherit from their folder.

Permissions can be given to a role, a team or a single user, and Grafana takes the highest one that applies.

WhoCan doNotes
Viewer (org role)Open dashboards they have View on, use Explore only if allowedDefault for new users (auto_assign_org_role = Viewer)
Editor (org role)Create and edit dashboards and alert rules in folders where they have EditCannot manage users or data sources
Admin (org role)Everything inside the organisation: users, teams, data sources, foldersAn organisation admin, not a server admin
Grafana server adminManage all organisations, all users, server settings and statsA flag on the user; admin has it by default
TeamA group of users inside one organisationGrant folder permissions to the team, not each person
Service accountA non-human identity with a role and one or more tokensTokens start with glsa_, can expire, revocable one by one

A new folder created in the UI gives the Viewer role View, the Editor role Edit and the Admin role Admin, which means every Viewer in the organisation can see every new folder. Locking a folder means removing those role entries and adding teams instead. Organisations are a harder wall: each has its own users, data sources, dashboards and alerting, and nothing is shared between them, which suits separate customers but makes shared dashboards harder.

Login settings sit in grafana.ini. [auth.basic] password_policy = true forces at least 12 characters with upper case, lower case, a digit and a symbol. [auth.anonymous] enabled = true lets anyone who can reach Grafana in without logging in, with the role in org_role, which is only acceptable for a TV screen on a closed network. Single sign-on through LDAP, Google, Microsoft Entra ID or any OAuth provider lives in the [auth.ldap] and [auth.generic_oauth] style sections, and can map groups to roles.

How it works, step by step

1A request arrives and Grafana finds the identity

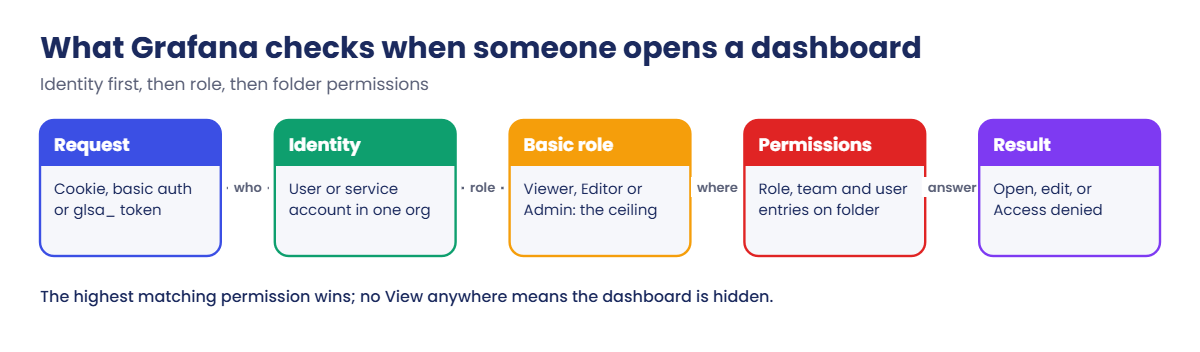
Each request carries a session cookie (a person who logged in), basic auth, or an Authorization: Bearer glsa_... header (a service account). Grafana resolves it to an identity in one organisation, with a basic role and its team memberships. The diagram follows a viewer opening a dashboard.

Grafana users and teams: identity, role and folder permission checks for a dashboard

2The role sets the ceiling

The basic role says what kind of action is possible at all: a Viewer can never save a dashboard, even with an Edit permission on a folder, unless the instance allows it. So the role is the ceiling and folder permissions decide where, below that ceiling, the user can work.

3Folder permissions decide which dashboards

Grafana then collects every permission on the dashboard and its folder that applies to this identity: entries for its role, for each of its teams and for the user directly. The highest wins. If nothing grants at least View, the dashboard doesn’t appear in search, and opening its URL shows an access error.

The diagram below shows the folder layout you build here.

Grafana users and teams: NOC Wall and SaatVedha Lab folder permissions

4Folders or organisations?

NeedUseWhy
Different teams in one company see different dashboardsFolders with team permissionsData sources and alerting stay shared; one place to manage
Customers must never see each other’s data or data source namesSeparate organisationsUsers, data sources and dashboards are fully separate
A script needs to read dashboards nightlyService account with Viewer roleIts own token, revoked without touching people
A TV in the NOC shows one dashboardA kiosk login or a Viewer service account behind a proxyAvoid anonymous access on a shared network

Hands-on lab: NOC team, locked folders and a backup service account

Before you run any command, double-check it

Read every command twice before you press Enter. Check the target: the server name, the user, the disk or device name, the path and the sizes. These commands are for learning and were tested in our lab, not on your system. At work, run the read-only commands first, follow your change process, make sure a backup exists, and ask a second person to check anything that changes or deletes data. You run them at your own risk.

All commands run on graf01 (192.168.56.70) against Grafana on 127.0.0.1:3000 with the admin password from Lesson 2. Keep a private (incognito) browser window ready, so you can log in as the other users without logging admin out.

1Name the organisation and turn on the password policy

Paste this whole block on graf01:

curl -s -u admin:Lab@Grafana2026 -X PUT -H 'Content-Type: application/json' \
  localhost:3000/api/org -d '{"name":"SaatVedha Lab"}'; echo
sudo sed -i '/^\[auth.basic\]/,/^\[/ s/^;password_policy = false/password_policy = true/' /etc/grafana/grafana.ini
sudo grep -A3 '^\[auth.basic\]' /etc/grafana/grafana.ini | grep -v '^#'
sudo systemctl restart grafana-server

You should see:

{"message":"Organization updated"}
[auth.basic]
;enabled = true
password_policy = true

The ;enabled = true line is the commented default that sits in the same section.

The default organisation (ID 1, “Main Org.”) is now called SaatVedha Lab, which is what users see in the profile menu. With the policy on, new and changed passwords must be at least 12 characters with upper case, lower case, a digit and a symbol; existing passwords keep working until they’re changed.

✅ Checkpoint: The API answers Organization updated and grafana.ini shows password_policy = true under [auth.basic].

2Create noc.viewer and ravi.editor

Paste this whole block on graf01:

for u in noc.viewer ravi.editor; do
  curl -s -u admin:Lab@Grafana2026 -H 'Content-Type: application/json' \
    -X POST localhost:3000/api/admin/users \
    -d "{\"name\":\"$u\",\"login\":\"$u\",\"email\":\"$u@lab.local\",\"password\":\"Lab@User2026\",\"OrgId\":1}"
  echo
done
RID=$(curl -s -u admin:Lab@Grafana2026 'localhost:3000/api/users/lookup?loginOrEmail=ravi.editor' | jq .id)
curl -s -u admin:Lab@Grafana2026 -H 'Content-Type: application/json' \
  -X PATCH localhost:3000/api/orgs/1/users/$RID -d '{"role":"Editor"}'; echo
curl -s -u admin:Lab@Grafana2026 localhost:3000/api/org/users | jq -r '.[] | "\(.login)  \(.role)"'

You should see this (your UIDs will differ, and the last three lines can come in another order):

{"id":2,"uid":"df3k2n0q8xla8c","message":"User created"}
{"id":3,"uid":"ef3k2n1b7r4e8d","message":"User created"}
{"message":"Organization user updated"}
admin  Admin
noc.viewer  Viewer
ravi.editor  Editor

New users land in organisation 1 as Viewer, because auto_assign_org_role = Viewer by default, so only ravi.editor needed a change. In a real company you’d set a temporary password and ask users to change it at first login, or let LDAP or single sign-on create them.

✅ Checkpoint: The org user list shows admin Admin, noc.viewer Viewer and ravi.editor Editor.

3Create the NOC team

Paste this whole block on graf01:

TID=$(curl -s -u admin:Lab@Grafana2026 -H 'Content-Type: application/json' \
  -X POST localhost:3000/api/teams -d '{"name":"NOC","email":"noc@lab.local"}' | jq .teamId)
NID=$(curl -s -u admin:Lab@Grafana2026 'localhost:3000/api/users/lookup?loginOrEmail=noc.viewer' | jq .id)
curl -s -u admin:Lab@Grafana2026 -H 'Content-Type: application/json' \
  -X POST localhost:3000/api/teams/$TID/members -d "{\"userId\":$NID}"; echo
curl -s -u admin:Lab@Grafana2026 "localhost:3000/api/teams/$TID/members" | jq -r '.[].login'

You should see:

{"message":"Member added to Team"}
noc.viewer

The same thing in the UI is Administration > Users and access > Teams > New team, then Add member. Teams belong to one organisation, and a user can be in many teams.

✅ Checkpoint: Team NOC exists and lists noc.viewer as a member.

4Build a NOC Wall folder that only the NOC can see

In Grafana create a folder NOC Wall (Dashboards > New > New folder). Move Nginx app01 and Tower routers (SNMP) into it (select them in the dashboard list and click Move). Then open the folder, click Folder actions > Manage permissions and change the list to this:

EntryPermissionAction
Role: AdminAdminkeep
Role: EditorEditremove
Role: ViewerViewremove
Team: NOCViewadd
User: ravi.editorEditadd
Grafana users and teams: NOC Wall folder permissions with Admin role, team NOC View and ravi.editor Edit
Manage permissions for the NOC Wall folder after the change: Role Admin keeps Admin, team NOC has View and ravi.editor has Edit, and the Editor and Viewer role entries are gone.

Now lock the main SaatVedha Lab folder the same way but more loosely: remove Role: Viewer and leave Role: Editor as Edit. From now on, plain viewers see SaatVedha Lab dashboards only if a team grants it.

Run this on graf01 to check what noc.viewer can see:

curl -s -u 'noc.viewer:Lab@User2026' 'localhost:3000/api/search?type=dash-db' \
  | jq -r '.[] | "\(.folderTitle // "General")  /  \(.title)"'

You should see:

NOC Wall  /  Nginx app01
NOC Wall  /  Tower routers (SNMP)

Search only returns what the identity can view, so this is the quickest way to test permissions without clicking through the UI. Log in as noc.viewer in your private window and the dashboard list shows the same two.

✅ Checkpoint: noc.viewer sees only the two NOC Wall dashboards, and ravi.editor (same check with his login) sees NOC Wall plus SaatVedha Lab.

Grafana users and teams: search results seen by noc.viewer
Lab output: noc.viewer only finds the two NOC Wall dashboards

5Create a service account and token for automation

A nightly script will back up dashboards in Lesson 13. It gets its own identity with the Viewer role, never the admin password.

Paste this whole block on graf01:

SAID=$(curl -s -u admin:Lab@Grafana2026 -H 'Content-Type: application/json' \
  -X POST localhost:3000/api/serviceaccounts -d '{"name":"backup-bot","role":"Viewer"}' | jq .id)
curl -s -u admin:Lab@Grafana2026 -H 'Content-Type: application/json' \
  -X POST localhost:3000/api/serviceaccounts/$SAID/tokens \
  -d '{"name":"backup-bot-2026","secondsToLive":7776000}' | jq -r .key > ~/.grafana-backup-token
chmod 600 ~/.grafana-backup-token; cut -c1-10 ~/.grafana-backup-token
curl -s -H "Authorization: Bearer $(cat ~/.grafana-backup-token)" \
  'localhost:3000/api/search?type=dash-db' | jq length

You should see this (your token differs after glsa_):

glsa_x7Kp2
0

The token works (no 401) but finds zero dashboards, because backup-bot is a Viewer and step 4 removed the Viewer role from both folders. Give the service account View on both folders (Manage permissions > Add a permission > Service account: backup-bot, View) and run the last command again: it now counts every dashboard. The token expires in 90 days (7,776,000 seconds), which forces a rotation habit.

Grafana users and teams: backup-bot service account with Viewer role and a 90-day token
The backup-bot service account under Administration > Users and access > Service accounts: role Viewer and one token, backup-bot-2026, that expires 90 days after it was created.

✅ Checkpoint: ~/.grafana-backup-token holds a glsa_ token with mode 600, and the search count is above 0 after granting backup-bot View on both folders.

6See what an organisation does

Paste this whole block on graf01:

curl -s -u admin:Lab@Grafana2026 -H 'Content-Type: application/json' \
  -X POST localhost:3000/api/orgs -d '{"name":"Customer Demo"}'; echo
curl -s -u admin:Lab@Grafana2026 -H 'X-Grafana-Org-Id: 2' localhost:3000/api/datasources | jq length
curl -s -u admin:Lab@Grafana2026 -H 'X-Grafana-Org-Id: 1' localhost:3000/api/datasources | jq -r '.[].name'

You should see:

{"message":"Organization created","orgId":2}
0
InfluxDB
Loki
MySQL app01
Prometheus
TestData

The new organisation starts empty: no data sources, no dashboards, no users except the server admin who created it. That isolation is the reason to use one per customer, and also the cost, because every data source and dashboard has to be set up again. Delete it when you’re done with curl -s -u admin:Lab@Grafana2026 -X DELETE localhost:3000/api/orgs/2.

✅ Checkpoint: Customer Demo had 0 data sources while SaatVedha Lab lists five, and the demo organisation is deleted afterwards.

7Snapshot graf01

Run this on your laptop:

VBoxManage snapshot graf01 take users-teams

You should see this (your UUID will differ):

0%...10%...20%...30%...40%...50%...60%...70%...80%...90%...100%
Snapshot taken. UUID: 9c3e7a10-4d6b-4f28-b17e-5a0c8d2f6e93

✅ Checkpoint: graf01 has a snapshot called users-teams.

Break It, Then Fix It

Three tickets from a real Grafana service desk. Use the private window for the user views.

1“I can’t see the Grafana health dashboard”

The NOC asks for Grafana health. You send noc.viewer the link from the SaatVedha Lab folder. In the private window, logged in as noc.viewer, open it:

You’ll get this:

Access denied
(the dashboard is also missing from search for this user)

Check what Grafana thinks, on graf01:

curl -s -o /dev/null -w "%{http_code}\n" -u 'noc.viewer:Lab@User2026' \
  localhost:3000/api/dashboards/uid/grafana-health-copy
403

You removed Role: Viewer from SaatVedha Lab in step 4, and team NOC only has View on NOC Wall, so nothing grants noc.viewer View on this dashboard. The role is fine; the folder permission is missing.

Fix (pick one):

Move Grafana health into NOC Wall, which is the clean answer if the NOC should always have it, or add Team: NOC, View on SaatVedha Lab. Avoid giving the permission to the single user; the next NOC hire would raise the same ticket.

✅ Checkpoint: The same curl returns 200 and noc.viewer can open Grafana health.

2“Ravi deleted the Nginx dashboard”

In the private window log in as ravi.editor, open Nginx app01, then Edit > Settings > Delete dashboard and confirm. The NOC wall is now empty on that panel.

Check as noc.viewer on graf01:

curl -s -u 'noc.viewer:Lab@User2026' 'localhost:3000/api/search?query=Nginx' | jq length
0

Ravi had Edit on NOC Wall, and Edit includes delete. Version history won’t help here, because it belongs to a dashboard that no longer appears.

Fix: restore from Recently deleted

As admin go to Dashboards > Recently deleted, tick Nginx app01, click Restore, keep the preselected folder NOC Wall and confirm. Grafana keeps deleted dashboards for up to 12 months; people can restore what they deleted and admins can restore anything. Dashboard-level permissions are not restored, only the folder’s apply, which is one more reason to set permissions on folders.

If editors shouldn’t delete at all on a wall folder, give them a separate working folder and keep the wall folder View-only for everyone except admins.

✅ Checkpoint: Nginx app01 is back in NOC Wall and the noc.viewer search returns 1.

3The backup script gets 401

Someone cleans up old tokens and deletes backup-bot-2026 (Administration > Users and access > Service accounts > backup-bot, delete the token). The script then runs:

Run this on graf01:

curl -s -w "\nHTTP %{http_code}\n" -H "Authorization: Bearer $(cat ~/.grafana-backup-token)" \
  'localhost:3000/api/search?type=dash-db'

You’ll get this error:

{"message":"Invalid API key","messageId":"api-key.invalid","statusCode":401,"traceID":""}
HTTP 401

Service account tokens are still reported as “API key” errors for historical reasons. A 401 means Grafana doesn’t accept the token at all: deleted, expired, mistyped, or from another Grafana. A 403 would mean the token is valid but its role or permissions don’t allow the action, which is a different fix.

Fix: issue a new token and store it the same way:

SAID=$(curl -s -u admin:Lab@Grafana2026 'localhost:3000/api/serviceaccounts/search?query=backup-bot' | jq '.serviceAccounts[0].id')
curl -s -u admin:Lab@Grafana2026 -H 'Content-Type: application/json' \
  -X POST localhost:3000/api/serviceaccounts/$SAID/tokens \
  -d '{"name":"backup-bot-2026b","secondsToLive":7776000}' | jq -r .key > ~/.grafana-backup-token
curl -s -o /dev/null -w "HTTP %{http_code}\n" -H "Authorization: Bearer $(cat ~/.grafana-backup-token)" \
  'localhost:3000/api/search?type=dash-db'
HTTP 200

✅ Checkpoint: The script gets HTTP 200 with the new token.

This happened at work

The client who saw a competitor’s name

My team lead tells this one from an IT services company in Bengaluru that ran one Grafana for its managed-services customers. Every customer had a folder, every customer user was a Viewer, and folders kept the default permissions. One Monday a customer’s IT head emailed a screenshot: his Grafana search showed folders named after two other customers, one of them his direct competitor.

The first reaction was to rename the folders to customer codes, which hid the names but not the dashboards. Then an engineer listed folder permissions through the API and found what was going on: every folder still had Role: Viewer with View, so every customer user could open every customer’s dashboards, and some of those dashboards showed hostnames and traffic figures.

They removed Role: Viewer from all customer folders that day and added one team per customer instead. Over the next month they moved the two largest customers into their own organisations, with separate data sources, and added a weekly script that lists any folder with a role-level Viewer permission and fails the check if it finds one.

Common mistakes and troubleshooting

MistakeWhat happensWhat to do instead
Leaving default folder permissions on customer or team foldersEvery Viewer in the organisation sees every folderRemove Role: Viewer and Role: Editor and grant teams instead
Granting permissions to individual usersEach new joiner raises a ticket and leavers keep accessGrant to teams and manage membership
Using the admin password in scriptsA leaked script exposes full control and you can’t rotate without breaking peopleUse a service account with the lowest role and an expiring token
Enabling anonymous access on a shared networkAnyone who reaches Grafana can browse dashboards and data source namesUse a kiosk login or a Viewer service account behind a proxy for TV screens
Giving Edit on wall dashboards to everyone who asksAccidental deletes and edits on screens the NOC depends onKeep wall folders View-only and give editors a working folder
Using organisations for every teamData sources and dashboards are duplicated and drift apartUse folders and teams inside one organisation unless data must be fully separate
Treating 401 and 403 the sameTime wasted changing permissions when the token itself is dead401 means the token is rejected; 403 means it is valid but not allowed

Interview questions

Click a question to open it. Each one is written the way an interviewer would ask it. Under it you will see why they ask it and one way you could answer, in your own words.

Fresher level

1. What are the three basic roles in a Grafana organisation and what can each do?

Why they ask this: A basic check of the permission model.

How you might answer: Viewer can open dashboards they have View permission on. Editor can also create and change dashboards and alert rules where they have Edit. Admin manages everything in the organisation, including users, teams, data sources and folder permissions.

Separately, a Grafana server admin manages all organisations and users on the whole instance.

2. A new joiner in the NOC needs the same dashboards as the rest of the NOC. How do you give access?

Why they ask this: They check whether you think in teams rather than single users.

How you might answer: I add the user to the NOC team. The team already has View on the NOC folders, so the new person sees the same dashboards as the others, and when they leave I remove them from the team.

I don’t add per-user permissions because those are easy to forget during offboarding.

2–5 years experience

3. A script that exports dashboards fails with 401 after working for months. How do you troubleshoot?

Why they ask this: They want you to separate authentication from authorisation.

How you might answer: 401 means Grafana rejected the token itself, so I check whether the service account token was deleted, expired or replaced, and whether the script is pointing at the right Grafana. The service account page shows tokens and their expiry.

If it were 403 instead, the token is fine and I’d look at the service account’s role and folder permissions. I fix it by issuing a new token with an expiry and storing it in the script’s secret store.

4. An editor deleted an important dashboard. What are your options?

Why they ask this: They check practical recovery knowledge in current Grafana versions.

How you might answer: In current Grafana the dashboard goes to Dashboards > Recently deleted for up to 12 months, and an admin can restore it into its folder. Dashboard-level permissions don’t come back, so I re-check them.

If that weren’t available I’d restore from a JSON backup in Git or from a grafana.db backup, which is why we back dashboards up nightly with a service account.

Senior level

5. You run one Grafana for several customers. Folders or organisations?

Why they ask this: They are checking judgement about isolation versus maintenance cost.

How you might answer: If customers must never see each other’s data or even data source names, I’d use one organisation per customer, accepting that data sources and dashboards are set up per organisation, preferably through provisioning. For internal teams in one company, folders with team permissions are simpler and keep shared data sources.

Either way, I’d remove role-level Viewer permissions from customer folders and run a regular check that fails if any appear.

6. How would you connect Grafana to the company directory and keep roles under control?

Why they ask this: They want design for identity at scale.

How you might answer: I’d enable LDAP or the company’s OAuth or OIDC provider, map directory groups to Grafana roles and teams, and turn off basic login for normal users, keeping one local break-glass admin. Team sync or group mapping means joining or leaving a directory group changes Grafana access automatically.

Automation uses service accounts with the lowest role and expiring tokens, and anonymous access stays off.

Quick quiz

Q1. What role does a new user get by default in organisation 1?

  1. Admin
  2. Editor
  3. Viewer
  4. No role
Show answer

C — auto_assign_org_role defaults to Viewer.

Q2. Which permissions does a new UI-created folder give to the Viewer role?

  1. None
  2. View
  3. Edit
  4. Admin
Show answer

B — New folders give Viewer View, Editor Edit and Admin Admin, so locking a folder means removing those entries.

Q3. What do service account tokens start with?

  1. eyJ
  2. glsa_
  3. apiv3_
  4. sk-
Show answer

B — Grafana service account tokens use the glsa_ prefix.

Q4. A token returns 401 Invalid API key. What does that mean?

  1. The token is valid but lacks permission
  2. Grafana rejected the token: deleted, expired or wrong
  3. The dashboard doesn’t exist
  4. The server is down
Show answer

B — 401 is an authentication failure; 403 would be a permission problem with a valid token.

Q5. Where can an admin restore a dashboard someone deleted in Grafana 13?

  1. Settings > Versions
  2. Dashboards > Recently deleted
  3. Administration > Stats
  4. Explore
Show answer

B — Deleted dashboards are kept for up to 12 months under Recently deleted.

Quick recap

  • The organisation is now SaatVedha Lab, with password_policy on and users noc.viewer (Viewer) and ravi.editor (Editor).
  • Team NOC has View on the NOC Wall folder; folder role entries were removed so only teams and named users get in.
  • backup-bot is a Viewer service account with an expiring glsa_ token stored in a 600 file for Lesson 13.
  • Organisations fully separate users, data sources and dashboards; folders and teams are the lighter choice inside one company.
  • Access denied is a folder permission problem, Recently deleted brings back deleted dashboards, and 401 means the token itself is rejected.

Next lesson

Lesson 13: Provisioning Grafana as code, and Elasticsearch logs → You provision data sources and dashboards from files kept in Git, export dashboards with the backup-bot token, and add Elasticsearch logs from app01.

Further reading: Grafana users and teams

Want to go deeper into Grafana users and teams? Grafana’s guides to roles and permissions, folder access control, team management and service accounts cover every option here, and managing dashboards explains Recently deleted. For Linux user and group basics behind all of this, see the Linux administration course.

You can also see the full plan for this course on the Grafana Dashboards and Observability course page.

Scroll to Top

This website uses cookies

We use a few cookies to keep this site working. If you allow it, we also use Google Analytics to count visits so we can improve our lessons. You can accept all, deny the optional ones, or choose what to allow.