Troubleshooting Grafana and where to go next

Sooner or later someone messages you “Grafana is broken”. Good Grafana troubleshooting is mostly about asking the right question in the right order: is Grafana up, can it reach the data source, does the query return data, and is the panel set up to show it. This last lesson gives you that order, the log files and log levels behind it, the query inspector, and the fixes for slow dashboards.

You’ll also back up and restore grafana.db, see what moving to MySQL or PostgreSQL involves, install the Zabbix plugin the right way, and finish with a Service Health dashboard that pulls together metrics, logs and alerts from the whole course. The break labs are three classics: database is locked, an unsigned plugin, and a dashboard so heavy that Prometheus refuses the query.

Where this lesson fits

Lesson 14 of 14 in Grafana Dashboards and Observability · Phase 3: Alerting, teams and running Grafana · Before this: Lesson 13, provisioning as code

TimeYou needBy the end you can
About 100 minutesgraf01 and app01 from Lesson 13, with Prometheus, Loki, alerting and the grafana-as-code repositoryTroubleshoot Grafana in a fixed order, speed up dashboards with the query inspector, back up grafana.db safely, and build a final Service Health dashboard

What it is, in one line

Troubleshooting Grafana means checking, in order, that the Grafana service is healthy, that it can reach the data source, that the query returns data for the time range, and that the panel is configured to show it, using logs and the query inspector instead of guesses.

In Simple Words

The tap with no water

When the kitchen tap in a Lucknow flat gives no water, an experienced plumber doesn’t start by changing the tap. He checks whether the building has water at all, then whether the tank on the roof is full, then whether the valve to this flat is open, and only then looks at the tap itself. Each check takes a minute and rules out half the possibilities.

Grafana is the tap, the data source is the tank, the query is the valve, and the panel settings are the washer inside the tap.

Engineer's View

The four layers and the tools for each

LayerQuestionToolTypical failures
1. Grafana serviceIs grafana-server running and healthy?systemctl, /api/health, /var/log/grafana/grafana.logPort in use, bad grafana.ini, provisioning error, database locked
2. Data sourceCan Grafana reach it and log in?Save & test, or the data source health APIFirewall, wrong URL, expired token, TLS
3. QueryDoes it return data for this time range?Explore, query inspectorWrong label, wrong time range, typo in metric
4. PanelIs the panel set up to show what came back?Panel editor, Table view, transformationsWrong unit, field overrides, hidden series, thresholds

Grafana writes logs to /var/log/grafana/grafana.log and to the systemd journal (the deb package sets mode = console file), in logfmt lines such as logger=provisioning t=... level=error msg="...". [log] level sets the default (info), and [log] filters raises one logger only, for example filters = plugins.signature:debug, which is far less noisy than turning the whole server to debug.

Grafana stores users, dashboards, folders, alert rules and settings in one SQLite file, /var/lib/grafana/grafana.db, unless [database] type points at MySQL or PostgreSQL. SQLite is fine for one server and a team of tens, but it allows one writer at a time, so heavy alerting, many editors or two Grafana servers behind a load balancer call for an external database.

How it works, step by step

1Start at the service, not the panel

A blank panel can be caused by any of the four layers, and checking from the bottom up wastes time. curl localhost:3000/api/health answers in milliseconds and tells you whether Grafana and its database are fine. The diagram shows the order you’ll follow in every incident.

Grafana troubleshooting order from service health to panel settings

2Then the data source

Every data source has a health endpoint, the same check as the Save & test button. If it fails, the problem is network, credentials or the data source itself, and nothing in the dashboard will fix it. If it passes, move on to the query.

3Then the query, with the query inspector

The query inspector (Inspect > Query on any panel) shows the exact request Grafana sent after variables were filled in, the raw response, and stats such as total request time and number of rows. Most “No data” tickets end here: a variable that expanded to something unexpected, a time range with nothing in it, or an error message the panel only showed as a small red triangle. The diagram below shows what makes a dashboard slow.

Grafana troubleshooting slow dashboards: panels, refresh, step and raw counters

4Finally the panel

If the inspector shows data but the panel looks wrong, switch the panel to Table view to see the raw fields, then check units, overrides, transformations and thresholds. A series hidden by a legend click or an override that renames a field explains more “missing” lines than any bug.

Slow dashboard causeHow you spot itFix
Too many panels or queriesInspector: Number of queries, total load timeSplit into overview and drill-down dashboards, use rows that stay collapsed
Tiny step on long rangesInspector: huge row counts, Prometheus resolution errorsLeave Max data points on auto, set Min interval to the scrape interval
Short auto-refresh on many screensGrafana and data source CPU climbs with viewersRefresh 1m or more on walls; use recording rules
Same query repeated in several panelsIdentical queries in the inspectorUse the special Dashboard data source to reuse one panel’s results

Hands-on lab: health checks, logs, backups and a final Service Health dashboard

Before you run any command, double-check it

Read every command twice before you press Enter. Check the target: the server name, the user, the disk or device name, the path and the sizes. These commands are for learning and were tested in our lab, not on your system. At work, run the read-only commands first, follow your change process, make sure a backup exists, and ask a second person to check anything that changes or deletes data. You run them at your own risk.

Everything runs on graf01 (192.168.56.70) unless a step says app01. Save the health-check script from step 1; it’s worth keeping on every Grafana server you look after.

1Write a four-layer health check

Paste this whole block on graf01:

cat > ~/grafana-check.sh <<'EOF'
#!/bin/bash
# Layer 1: service and database
systemctl is-active grafana-server
curl -s localhost:3000/api/health | jq -c '{database, version}'
# Layer 2: every data source
for uid in $(curl -s -u admin:Lab@Grafana2026 localhost:3000/api/datasources | jq -r '.[].uid'); do
  printf '%-22s ' "$uid"
  curl -s -u admin:Lab@Grafana2026 "localhost:3000/api/datasources/uid/$uid/health" | jq -r .status
done
# Recent errors
sudo grep 'level=error' /var/log/grafana/grafana.log | tail -n 3
EOF
chmod +x ~/grafana-check.sh && ~/grafana-check.sh

You should see this (your UIDs will differ):

active
{"database":"ok","version":"13.3.0"}
es-app01-logs          OK
ae7h2kq0l9mpsd         OK
be2h4c8xn1qpse         OK
ce5d1m3bw7tfya         OK
de9k0p2rz4hxlb         OK
fa3m8t1qx6vzke         OK

The six lines are your six data sources in name order (Elasticsearch app01 logs, InfluxDB, Loki, MySQL app01, Prometheus, TestData), and every healthy one says OK; the health message behind each status differs by data source type. If the last part prints old error lines, such as the provisioning error from Lesson 13’s break lab, check their times before you worry. When someone reports a problem, run this first: if layer 1 or 2 fails, you already know where to look and nobody has to open a dashboard.

✅ Checkpoint: The script prints active, database ok, and OK for every data source.

Grafana troubleshooting health check script output for every data source
Lab output: the four-layer check script with every data source healthy

2Read the logs and raise one logger only

Paste this whole block on graf01:

sudo tail -n 3 /var/log/grafana/grafana.log
sudo sed -i '/^\[log\]/,/^\[/ s/^;filters =.*/filters = plugins.signature:debug/' /etc/grafana/grafana.ini
sudo grep -A9 '^\[log\]' /etc/grafana/grafana.ini | grep -v -e '^[#;]' -e '^$'
sudo systemctl restart grafana-server && sleep 8
sudo grep 'logger=plugins.signature' /var/log/grafana/grafana.log | tail -n 2

The first three lines are whatever Grafana logged last, so yours will differ. After them you should see this (your times and plugin IDs can differ):

[log]
filters = plugins.signature:debug
logger=plugins.signature t=2026-11-08T14:03:02.441527806Z level=debug msg="Plugin signature valid" id=grafana-lokiexplore-app
logger=plugins.signature t=2026-11-08T14:03:02.447190214Z level=debug msg="Plugin signature valid" id=grafana-pyroscope-app

Grafana 13 installs a few app plugins on first start, such as Logs Drilldown (grafana-lokiexplore-app), and these are the signed plugins the debug logger reports on.

Each line starts with the logger name, which is what filters matches, so you can raise provisioning, ngalert or tsdb.prometheus to debug while everything else stays at info. Put the line back to ;filters = when you’re done; debug logs fill disks quickly.

✅ Checkpoint: grafana.ini has filters = plugins.signature:debug under [log] and the log shows debug lines from that logger only.

3Use the query inspector on a real panel

Open Server Overview, set the time range to the last 24 hours, and on the CPU panel open the menu and choose Inspect > Query, then click Refresh. Look at the request, then the Stats tab.

The Stats tab shows these rows (your numbers will differ):

Total request time      182 ms
Data processing time    1.2 ms
Number of queries       2
Total number rows       578

The Query tab shows the POST to /api/ds/query with the PromQL after $instance and $__rate_interval were filled in, and the intervalMs Grafana chose for this range. If a panel is slow, these numbers tell you whether it’s the data source (request time) or the browser (data processing time).
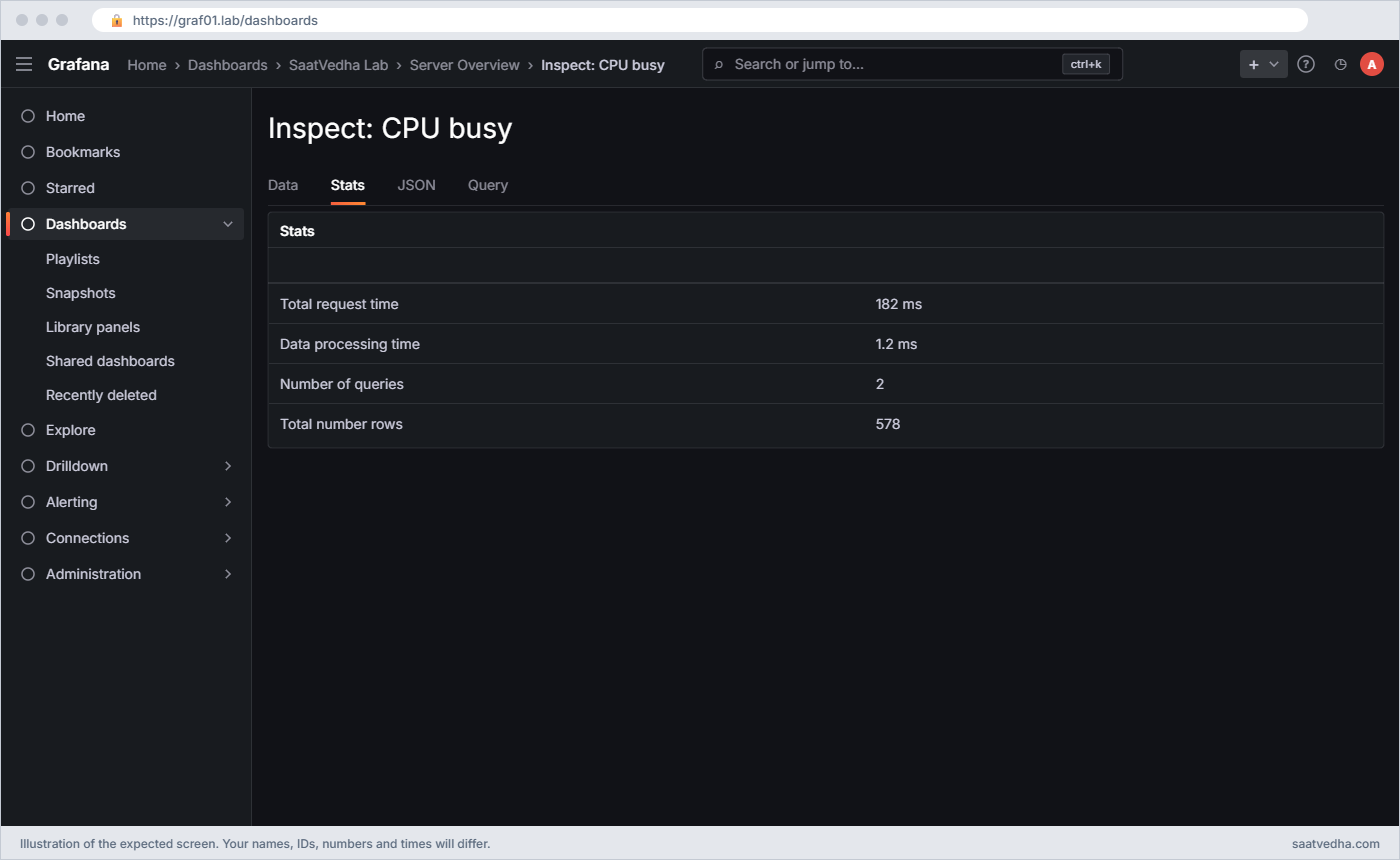
Grafana troubleshooting: query inspector Stats tab for the CPU busy panel with request time, queries and rows
The Stats tab of the query inspector on the CPU busy panel: total request time, data processing time, number of queries and total number of rows.

✅ Checkpoint: You can read the total request time, number of queries and rows for the CPU panel in the inspector.

4Back up grafana.db safely and test the copy

Paste this whole block on graf01:

sudo apt-get install -y sqlite3
sudo mkdir -p /var/backups/grafana
sudo sqlite3 /var/lib/grafana/grafana.db ".backup '/var/backups/grafana/grafana-$(date +%F).db'"
sudo sqlite3 /var/backups/grafana/grafana-$(date +%F).db 'PRAGMA integrity_check;'
sudo sqlite3 /var/backups/grafana/grafana-$(date +%F).db 'SELECT count(*) FROM dashboard;'
echo '30 1 * * * root sqlite3 /var/lib/grafana/grafana.db ".backup /var/backups/grafana/grafana-$(date +\%F).db"' \
  | sudo tee /etc/cron.d/grafana-backup

You should see this (your dashboard count will differ):

ok
17
30 1 * * * root sqlite3 /var/lib/grafana/grafana.db ".backup /var/backups/grafana/grafana-$(date +\%F).db"

.backup uses SQLite’s online backup, so it takes a consistent copy while Grafana keeps running; a plain cp of a database being written can give you a corrupt file. The integrity check proves the copy opens and is whole. To restore: stop grafana-server, copy the backup over /var/lib/grafana/grafana.db, chown grafana:grafana it, and start Grafana.

Add a line to delete backups older than 14 days, and copy them off the VM.

✅ Checkpoint: The backup file passes integrity_check, its dashboard count matches your Grafana, and /etc/cron.d/grafana-backup exists.

5Know what moving to MySQL or PostgreSQL involves

You won’t do this in the lab, but you should know the shape of it. Grafana’s database is chosen in [database]:

A grafana.ini section for PostgreSQL looks like this:

[database]
type = postgres
host = db01.lab:5432
name = grafana
user = grafana
password = """$__file{/etc/grafana/db.pass}"""
ssl_mode = require

On start-up Grafana creates its tables in the empty database. It does not copy anything from grafana.db, so teams usually move by recreating the content: data sources, dashboards and alerting from provisioning files (Lesson 13), users from LDAP or SSO, and anything else through the HTTP API. That’s one more reason to keep Grafana as code.

With an external database you can also run two Grafana servers behind a load balancer for high availability.

✅ Checkpoint: You can name the [database] keys for an external database and explain why grafana.db content isn’t copied automatically.

6Install the Zabbix plugin and plan upgrades

Paste this whole block on graf01:

sudo grafana cli plugins install alexanderzobnin-zabbix-app
sudo systemctl restart grafana-server
sudo grafana cli plugins ls | grep zabbix
apt-cache policy grafana | head -n 3

You should see this (the plugin version may be newer than 6.10.2):

✔ Downloaded and extracted alexanderzobnin-zabbix-app v6.10.2 zip successfully to /var/lib/grafana/plugins/alexanderzobnin-zabbix-app

Please restart Grafana after installing or removing plugins. Refer to Grafana documentation for instructions if necessary.

alexanderzobnin-zabbix-app @ 6.10.2
grafana:
  Installed: 13.3.0
  Candidate: 13.3.0

The Zabbix plugin is an app: enable it under Administration > Plugins and data > Plugins, then add a Zabbix data source pointing at a Zabbix API. The Zabbix monitoring course builds that Zabbix server. Plugins update separately from Grafana with grafana cli plugins update-all, and both should be tested before production.

For Grafana itself, keep the routine from Lesson 2: the package is held with apt-mark hold grafana, and an upgrade means a VM snapshot, a .backup of grafana.db, reading the release notes for breaking changes, apt-mark unhold grafana, installing the chosen version, checking the logs and plugin list, and holding the package again.

✅ Checkpoint: grafana cli plugins ls lists alexanderzobnin-zabbix-app and apt-cache policy shows the installed Grafana version.

7Final project: the Service Health dashboard

Build one dashboard, Service Health, in the NOC Wall folder, that answers “is the exam portal on app01 healthy?” in ten seconds. Use what you built in this course:

PanelData sourceQuery or setting
Targets upPrometheuscount(up{job=”node”} == 1), stat, red below 2
CPU busyPrometheusinstance:node_cpu_utilisation:rate5m{instance=~”$instance”}
Requests by statusLokisum by (status) (rate({job=”nginx”, host=”app01″}[$__auto]))
5xx per secondLokisum(rate({job=”nginx”, status=~”5..”}[5m])), stat with red threshold 0.5
Firing alertsAlert list panelFolder SaatVedha Lab, state Firing and Pending
Failed requestsLoki logs panel{job=”nginx”, host=”app01″, status=~”5..”}
DeploysAnnotation (Loki){job=”deploy”} |= “deployed” | logfmt, from Lesson 8

Then add one more Grafana-managed rule, Nginx 5xx high, on the Loki query sum(rate({job="nginx", status=~"5.."}[5m])) above 0.5 for 5 minutes with labels team=linux and severity=critical, so it follows the policy from Lesson 11. Finally run ~/grafana-as-code/export.sh and commit, so the dashboard is in Git.

Run this on graf01 to prove the whole chain:

~/exam-traffic.sh 600 &
sleep 420
curl -s localhost:8025/api/v1/messages | jq -r '.messages[0] | "\(.To[0].Address)  |  \(.Subject)"'
cd ~/grafana-as-code && ./export.sh >/dev/null; grep -l '"title": "Service Health"' dashboards/*.json; git add . && git commit -qm "Service Health" && echo committed

You should see this (the file name is your dashboard’s UID):

oncall@lab.local  |  [FIRING] Nginx 5xx high on  (critical)
dashboards/eg4pdt0c2v6mfb.json
committed

The exam traffic always includes failing /api/submit calls, so the rule fires; that’s intended here. The subject has no instance because the query sums across all lines; add host to the sum if you want it. Pause the rule or raise its threshold when you finish.
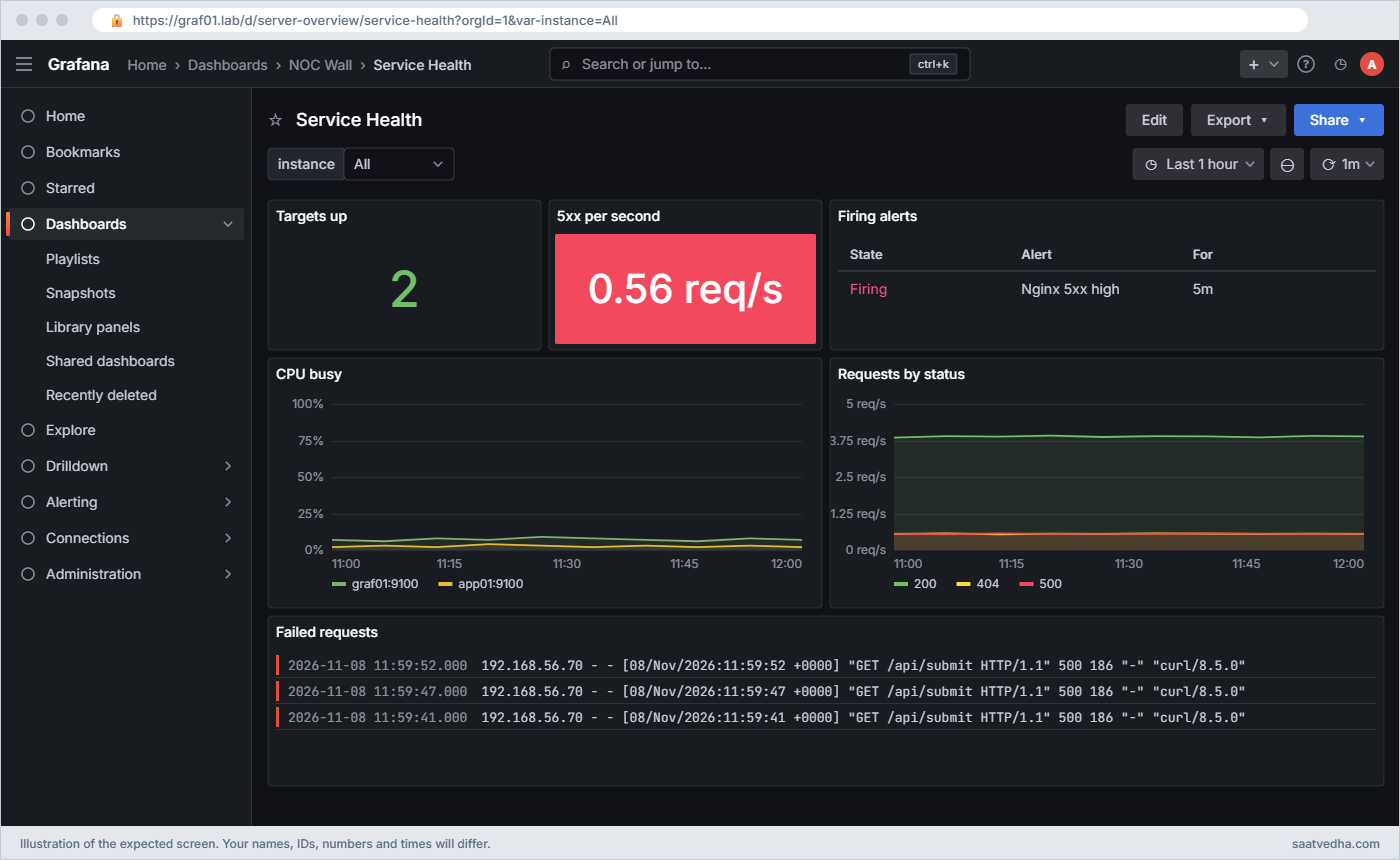
Grafana troubleshooting: final Service Health dashboard with targets up, 5xx rate, firing alert, CPU, status rates and failed requests
The finished Service Health dashboard in NOC Wall: two targets up, the 5xx rate above its 0.5 threshold, Nginx 5xx high firing, CPU busy, requests by status and the failing /api/submit lines.

✅ Checkpoint: Service Health shows all seven parts, the Nginx 5xx high alert reached oncall@lab.local, and the dashboard is committed in ~/grafana-as-code.

8Snapshot the finished lab

Run this on your laptop:

VBoxManage snapshot graf01 take course-complete
VBoxManage snapshot app01 take course-complete

You should see this (your UUIDs will differ):

0%...10%...20%...30%...40%...50%...60%...70%...80%...90%...100%
Snapshot taken. UUID: 0b7d5e29-3c81-4f46-a9d0-8e2f6c1a5b74
0%...10%...20%...30%...40%...50%...60%...70%...80%...90%...100%
Snapshot taken. UUID: 6e1c9a83-5f27-4d0b-b3e6-4a8d7f2c0e15

✅ Checkpoint: Both VMs have a snapshot called course-complete.

Break It, Then Fix It

Snapshot graf01 before starting. Each of these has stopped a real Grafana at a bad moment.

1database is locked

An admin opens grafana.db with the sqlite3 shell to “clean up old dashboards”, starts a transaction and goes for tea. Play that part in one SSH session on graf01:

Session 1 on graf01 (leave it open):

sudo sqlite3 /var/lib/grafana/grafana.db
sqlite> BEGIN EXCLUSIVE;
sqlite> SELECT count(*) FROM dashboard;

In the browser edit any dashboard and click Save. In a second SSH session, try a write yourself:

Session 2 on graf01:

sudo sqlite3 /var/lib/grafana/grafana.db "UPDATE dashboard SET title = title WHERE id = 1;"
sudo grep 'database is locked' /var/log/grafana/grafana.log | tail -n 1

You’ll get this error:

Error: in prepare, database is locked (5)
... level=error msg="..." error="database is locked"

SQLite lets only one connection write at a time. An exclusive transaction blocks every writer, so Grafana’s save waits, retries and fails, and alert state updates fail the same way. The same error appears with very busy alerting on SQLite, or when someone copies grafana.db to a network share and points two Grafana servers at it.

Fix:

In session 1 type ROLLBACK; and .quit, then save again in the browser. Never hold a shell open on the live grafana.db: work on a .backup copy instead, and use the HTTP API to change content. If locks happen under normal load, move to MySQL or PostgreSQL.

✅ Checkpoint: After the rollback the dashboard saves normally and no new database is locked lines appear.

2An unsigned plugin is skipped

A developer drops a home-made panel plugin into the plugins folder:

Paste this whole block on graf01:

sudo mkdir -p /var/lib/grafana/plugins/saatvedha-hello-panel
echo '{"type":"panel","name":"Hello SaatVedha","id":"saatvedha-hello-panel","info":{"version":"1.0.0","author":{"name":"SaatVedha Lab"}}}' \
  | sudo tee /var/lib/grafana/plugins/saatvedha-hello-panel/plugin.json >/dev/null
echo 'define([], function(){ return {}; });' | sudo tee /var/lib/grafana/plugins/saatvedha-hello-panel/module.js >/dev/null
sudo chown -R grafana:grafana /var/lib/grafana/plugins/saatvedha-hello-panel
sudo systemctl restart grafana-server && sleep 8
sudo grep 'saatvedha-hello-panel' /var/log/grafana/grafana.log | tail -n 2

You’ll get this error:

logger=plugins.signature t=... level=warn msg="Plugin is unsigned" id=saatvedha-hello-panel err="plugin is unsigned"
logger=plugins.validation t=... level=error msg="Plugin validation failed" pluginId=saatvedha-hello-panel error="plugin 'saatvedha-hello-panel' has no signature"

Grafana only loads plugins with a valid signature from Grafana Labs, so a plugin that has no MANIFEST.txt is skipped, and the Plugins page lists it as unsigned. That protects you from tampered plugins, and it’s also why internal plugins seem to “vanish” after deployment.

Fix: allow this one plugin by ID, nothing more:

sudo sed -i '/^\[plugins\]/,/^\[/ s/^;allow_loading_unsigned_plugins =.*/allow_loading_unsigned_plugins = saatvedha-hello-panel/' /etc/grafana/grafana.ini
sudo systemctl restart grafana-server && sleep 8
sudo grep 'saatvedha-hello-panel' /var/log/grafana/grafana.log | tail -n 1
logger=plugin.signature.validator t=... level=warn msg="Permitting unsigned plugin. This is not recommended" pluginId=saatvedha-hello-panel

The setting takes a comma-separated list of plugin IDs. For company plugins in production, sign them as private plugins for your Grafana URL instead of allowing unsigned ones. Remove the test plugin folder and the setting when you finish.

✅ Checkpoint: Grafana logs Permitting unsigned plugin for saatvedha-hello-panel, and after cleanup no line mentions it.

3A dashboard so heavy Prometheus refuses it

Someone wants “more detail” on the CPU panel of Server Overview. Edit the panel, open Query options, set Max data points to 100000, and set the dashboard time range to the last 30 days.

You’ll get this error on the panel:

exceeded maximum resolution of 11,000 points per timeseries. Try decreasing the query resolution (?step=XX)

Grafana divides the time range by Max data points to choose the step: 30 days over 100,000 points is a step of about 26 seconds, which asks Prometheus for roughly 100,000 points per series. Prometheus refuses anything over 11,000 points per series. With a smaller number like 20,000 it would answer, slowly, and send the browser far more points than the screen has pixels.

Fix: let Grafana size the step, and set a sensible floor

Clear Max data points (back to auto, which follows the panel width), set Min interval to 15s (the scrape interval), and keep $__rate_interval in the query. Open the inspector again: the request time and row count drop sharply. For a wall that shows 30 days all day, query a recording rule instead of raw counters.

✅ Checkpoint: The CPU panel loads the 30 day range without an error, and the inspector shows a few hundred rows instead of tens of thousands.

This happened at work

Application deadline day

A colleague who supports a state government e-services portal in Lucknow told me about the last day for a scholarship application. At 11 am the operations room said Grafana was “hanging”: dashboards took a minute to open, and the Prometheus server behind it was at 90% CPU, so people assumed the portal itself was in trouble.

The first move was to add CPU to the Prometheus VM, which helped for twenty minutes. Then my colleague ran the inspector on the main “Portal status” dashboard: 46 panels, 61 queries, a 5 second auto-refresh, Max data points raised to 5,000 on most panels, and the dashboard open on 25 screens across three rooms. Grafana was sending Prometheus about 300 heavy queries a second on its own.

They set refresh to 1 minute, put Max data points back to auto, collapsed the detail rows, and the load fell within minutes; the portal had been fine all along. Over the next sprint they split the dashboard into an overview wall built on recording rules and a drill-down dashboard for engineers, and added Grafana’s own request rate (from Lesson 9) to the overview so the next time Grafana was the problem, it would show.

Common mistakes and troubleshooting

MistakeWhat happensWhat to do instead
Starting at the panel when a dashboard is blankTime lost changing queries when Grafana or the data source is downCheck service, data source, query, then panel, in that order
Turning the whole server to debug loggingHuge logs, a full disk, and the useful line is buriedUse [log] filters for one logger and turn it off afterwards
Copying grafana.db with cp while Grafana runsA backup that may not open when you need itUse sqlite3 .backup and run integrity_check on the copy
Holding an sqlite3 session open on the live databasedatabase is locked errors and failed saves and alert updatesWork on a backup copy and use the HTTP API for changes
Allowing all unsigned pluginsAny plugin dropped on disk runs inside GrafanaAllow specific IDs only, or sign private plugins
Raising Max data points and refresh rates on wallsSlow dashboards and overloaded data sourcesLeave Max data points on auto, Min interval at the scrape interval, refresh 1m or more
Expecting a database change to copy grafana.db contentAn empty Grafana on MySQL or PostgreSQLRecreate content from provisioning and the API, which is why Grafana as code matters

Interview questions

Click a question to open it. Each one is written the way an interviewer would ask it. Under it you will see why they ask it and one way you could answer, in your own words.

Fresher level

1. A user says a Grafana panel shows No data. What do you check first?

Why they ask this: They want a methodical order rather than random clicking.

How you might answer: I go through four layers. First is Grafana healthy, with /api/health or the service status. Then can it reach the data source, with Save & test or the health API. Then does the query return data, which I check in Explore or the query inspector with the same time range and variables.

Only if data comes back do I look at the panel itself: units, overrides, transformations and hidden series.

2. Where does Grafana write its logs on Ubuntu and how do you get more detail?

Why they ask this: A basic operations question.

How you might answer: With the deb package, logs go to /var/log/grafana/grafana.log and to the journal, so journalctl -u grafana-server works too. For more detail I don’t switch everything to debug; I set [log] filters for the one logger I care about, like provisioning:debug, restart, and turn it back afterwards.

2–5 years experience

3. A dashboard takes 40 seconds to load. Walk me through finding out why.

Why they ask this: They check practical performance tuning with real tools.

How you might answer: I open the query inspector on the slowest panels and look at total request time, number of queries and rows. If the data source is slow, I look at the queries themselves: long ranges with a tiny step, raised Max data points, or heavy regexes on high-cardinality labels.

Then the dashboard shape: how many panels and queries, the refresh rate and how many screens have it open. Fixes are usually auto Max data points, a Min interval at the scrape interval, recording rules, collapsed rows and splitting overview from drill-down.

4. How do you back up Grafana, and how do you know the backup works?

Why they ask this: They want both the method and the verification habit.

How you might answer: For SQLite I use sqlite3 with .backup, which is safe while Grafana runs, nightly from cron, then copy the file off the server. I run PRAGMA integrity_check on the copy and every few months restore it into a test VM and log in.

On top of that, dashboards, data sources and alerting live in Git through provisioning and API exports, so I can rebuild even without the database.

Senior level

5. When would you move Grafana from SQLite to PostgreSQL, and how would you do it?

Why they ask this: They are checking architecture and migration judgement.

How you might answer: I’d move when we need two Grafana servers for high availability, when alerting or many editors cause lock contention, or when the DBA team wants it under their backups and monitoring. The [database] section switches the type, but Grafana starts with empty tables, so content doesn’t move by itself.

I’d recreate data sources, dashboards and alerting from provisioning files and API exports, map users through SSO, test on a staging Grafana against the new database, and cut over in a quiet window with the old server kept for rollback.

6. How would you run Grafana for a large organisation so that it stays reliable?

Why they ask this: They want the whole operating model, not one setting.

How you might answer: Two or more Grafana servers behind a load balancer on PostgreSQL or MySQL, with SSO and team sync, and everything important provisioned from Git. Grafana itself is monitored through its /metrics with alerts on errors and latency, plugins are pinned and signed, and upgrades go through staging with a database backup first.

I’d also put limits on dashboard design, like recording rules for walls and sensible refresh rates, because most Grafana outages I’ve seen were caused by dashboards overloading data sources.

Quick quiz

Q1. What is the first check when a dashboard shows nothing?

  1. Change the panel unit
  2. Check whether Grafana and its data source are healthy
  3. Reinstall Grafana
  4. Delete the dashboard
Show answer

B — Start at the service and data source; panel settings come last.

Q2. How do you get debug logs from one part of Grafana only?

  1. Set [log] level = debug
  2. Set [log] filters = logger:debug
  3. Restart with a verbose flag
  4. Use the query inspector
Show answer

B — [log] filters raises chosen loggers without making the whole server noisy.

Q3. What is the safe way to back up grafana.db while Grafana runs?

  1. cp the file
  2. sqlite3 with .backup
  3. tar the /var/lib/grafana folder
  4. Export one dashboard
Show answer

B — The SQLite online backup takes a consistent copy while the database is in use.

Q4. Grafana logs “plugin … has no signature”. What does that mean?

  1. The plugin is corrupt
  2. The plugin has no valid Grafana signature and is skipped
  3. The plugin needs a restart
  4. The plugin is a data source
Show answer

B — Unsigned plugins are not loaded unless allowed by ID in allow_loading_unsigned_plugins.

Q5. Prometheus says exceeded maximum resolution of 11,000 points per timeseries. What changed?

  1. The scrape interval
  2. The step got too small for the range, for example a huge Max data points
  3. The data source URL
  4. The dashboard UID
Show answer

B — Too many points per series for the time range; let Grafana size the step and set a Min interval.

Quick recap

  • Troubleshoot in order: Grafana service, data source, query, panel; ~/grafana-check.sh does the first two in seconds.
  • Logs live in /var/log/grafana/grafana.log; use [log] filters for one logger instead of global debug.
  • The query inspector shows the real request, request time, query count and rows, which is where slow dashboards are explained.
  • Back up grafana.db with sqlite3 .backup and test it; moving to MySQL or PostgreSQL starts empty, so keep Grafana as code.
  • Plugins must be signed or allowed by ID, and the Service Health dashboard ties together metrics, logs, annotations and alerts from the whole course.

What’s next

You have finished the course. Go back to the Grafana Dashboards and Observability course page to review any lesson, then go deeper on the metrics side with the Prometheus monitoring course or on agents and SNMP with the Zabbix monitoring course.

Further reading: Grafana troubleshooting

Want to go deeper into Grafana troubleshooting? Grafana’s own troubleshooting guide, the configuration reference for [log], [database] and [plugins], the backup guide and the plugin management page are the places to start. If you want a hosted Grafana to practise on, Grafana Labs runs Grafana Cloud with a free tier.

From here, continue with the Prometheus monitoring course and the Zabbix monitoring course, or revisit Node Exporter dashboards and Grafana alerting. You can also see the full plan for this course on the Grafana Dashboards and Observability course page.

Scroll to Top

This website uses cookies

We use a few cookies to keep this site working. If you allow it, we also use Google Analytics to count visits so we can improve our lessons. You can accept all, deny the optional ones, or choose what to allow.