What is Grafana? Dashboards explained and your lab

What is Grafana, and why do so many NOC wall screens and DevOps job adverts show its dark dashboards? In plain terms it’s a web application that connects to the places where your numbers and logs already live (Prometheus, Loki, MySQL, InfluxDB and many more), asks them questions and turns the answers into graphs, tables and alerts. This first lesson explains what Grafana does and what it leaves to other tools, and then you build the two small VMs you’ll use for the whole course.

Nothing gets installed for good today. At the end you’ll download the Grafana OSS tarball on graf01, run it in the foreground for a few minutes and draw your first graph from the built-in TestData source, so you see the thing working before Lesson 2 installs it properly from the APT repository.

Where this lesson fits

Lesson 1 of 14 in Grafana Dashboards and Observability · Phase 1: Grafana setup and your first dashboards · Next: Lesson 2, install Grafana on Ubuntu

TimeYou needBy the end you can
About 80 minutesA laptop with 8 GB RAM, VirtualBox 7, the Ubuntu Server 26.04 LTS ISO (24.04 LTS works the same)Explain what Grafana is and is not in an interview, and have graf01 and app01 running, talking to each other and saved in a snapshot

What it is, in one line

Grafana is a web application that connects to your existing data sources, runs queries against them and shows the results as dashboards, panels and alerts, without storing the data itself.

In Simple Words

The cricket scoreboard that keeps no scores

Picture the big electronic scoreboard at Chinnaswamy stadium. It doesn’t bowl, bat or count anything on its own. The scorers in the box keep the real record, and the board reads from them and shows runs, wickets and the run rate in a way 40,000 people can understand from far away.

If the scorers’ laptop dies, the board goes blank, and if a scorer types a wrong number, the board shows the wrong number in big bright letters. The board is only as good as the data behind it, but without it most people in the stands would have no idea what’s happening.

Grafana is that scoreboard, and Prometheus, Loki or MySQL are the scorers who keep the record.

Engineer's View

What Grafana does, and what it leaves to others

Grafana is a Go backend plus a React frontend, served on port 3000 by default. It keeps its own small database (SQLite file grafana.db unless you point it at MySQL or PostgreSQL), but that database only holds Grafana’s own things: users, teams, dashboards as JSON, data source settings, alert rules and preferences. Your metrics and logs stay in the systems that collected them.

When a panel loads, the browser asks the Grafana server for data, the server sends a query to the data source in that source’s own language (PromQL, LogQL, SQL, InfluxQL), receives the result and converts it into a common table format called a data frame. The panel then draws that frame as a line chart, a gauge or a table.

WordWhat it means in Grafana
Data sourceA saved connection to one backend: its type (Prometheus, Loki, MySQL…), URL, credentials and options
DashboardA page of panels saved as one JSON document, with a time range, a refresh rate and optional variables
PanelOne box on a dashboard: one or more queries plus a visualisation (time series, stat, gauge, table, logs…)
QueryThe question a panel sends to its data source, written in that source’s language
ExploreA scratch page for ad hoc queries and log searching, without building a dashboard
Alert ruleA query that Grafana runs on a schedule and compares with a threshold, then notifies a contact point
PluginAn add-on that brings a new data source, panel type or app. Many ship built in, others you install

Observability usually means three kinds of signals. Metrics are numbers over time (CPU 72%, 340 requests per second), logs are timestamped text lines (an Nginx access line, a Java stack trace) and traces follow one request through many services. Grafana Labs ships a backend for each (Mimir or Prometheus for metrics, Loki for logs, Tempo for traces), and Grafana is the screen where you look at all three side by side.

How it works, step by step

1Data lives in the backends

Before Grafana can show anything, something must collect and store data. In this course Prometheus scrapes node_exporter on both VMs, Alloy ships Nginx logs into Loki, MySQL holds an orders table and Telegraf writes into InfluxDB. Each of these keeps its own history and answers queries on its own port.

2Grafana holds connections, not data

You add each backend once as a data source. Grafana stores the URL and any password in grafana.db (the password encrypted with the secret_key), and every panel picks one of these data sources. The diagram below shows the path a single panel takes, from your browser click to the picture on screen.

What is Grafana: how a panel query goes from the browser through the Grafana server to the data source

3The server does the querying

With the default server access mode, your browser never talks to Prometheus or MySQL directly. It calls Grafana’s API, and the Grafana backend makes the request on your behalf. That’s why a data source URL like http://localhost:9090 is correct even though your laptop has no Prometheus: “localhost” here means the Grafana machine.

4Results become data frames, then pictures

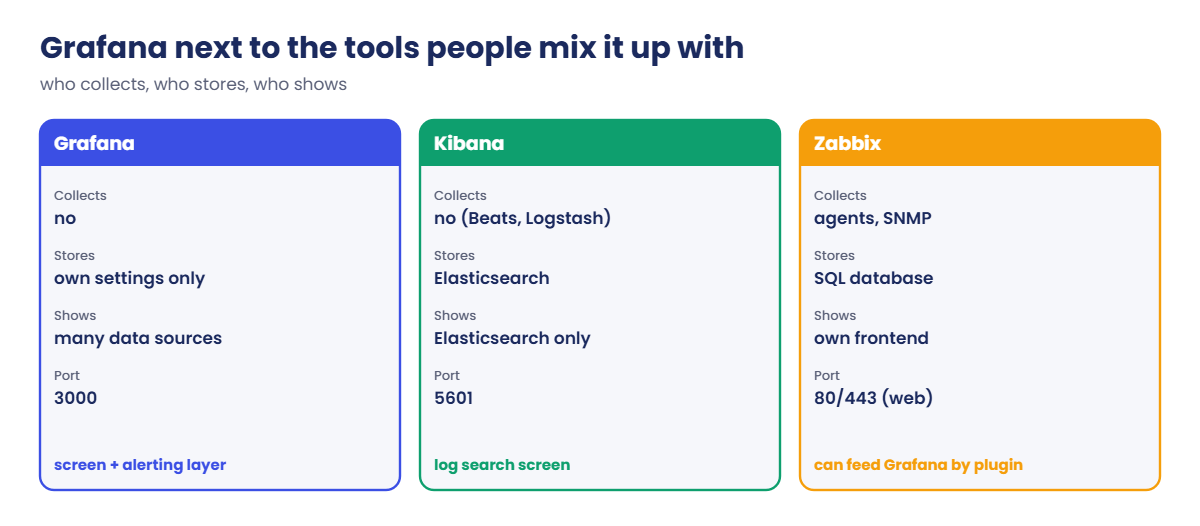
Each data source plugin turns its answer into data frames: columns with a name, a type (time, number, string) and labels. Transformations can join or reshape frames, field options set units and thresholds, and the visualisation draws the result. The second diagram puts Grafana next to the tools people often confuse it with.

What is Grafana compared with Kibana and the Zabbix frontend: who collects, stores and shows data

5Where Grafana fits next to other tools

People often ask whether Grafana replaces Zabbix or Kibana. It doesn’t replace the part that collects and stores data, it replaces or adds a screen on top. Zabbix has its own frontend and can also feed Grafana through a plugin, and Kibana is the screen built specifically for Elasticsearch.

QuestionGrafanaKibanaZabbix frontend
Stores your data?No, only its own settings and dashboardsNo, Elasticsearch stores itYes, through the Zabbix server and its SQL database
Data sourcesDozens built in or as plugins (Prometheus, Loki, SQL, InfluxDB, Elasticsearch, cloud services)Elasticsearch onlyZabbix only
Best atMixing metrics, logs and SQL on one dashboardSearching and analysing logs in ElasticsearchHost and network monitoring managed from one GUI
AlertingGrafana-managed rules on almost any data sourceKibana alerting on Elasticsearch dataTriggers and actions inside Zabbix
EditionWhat you getWhen people pick it
Grafana OSSOpen-source build under the AGPLv3 licence. Everything in this course works on itSelf-hosted labs, small and medium teams, anyone who wants to own the stack
Grafana EnterpriseSame core plus licensed features (enterprise data source plugins, reporting, extra auth and audit options). Without a licence key it runs like OSSCompanies that need vendor support or those specific features
Grafana CloudGrafana Labs hosts Grafana, Mimir, Loki and Tempo for you, with a free tier and paid plansTeams that don’t want to run the servers themselves

The grafana.com download page now pre-selects Enterprise. For this course pick OSS whenever you download, and Lesson 2 installs the OSS package called grafana, not grafana-enterprise.

Hands-on lab: build graf01 and app01, then test-drive Grafana 13.3

Before you run any command, double-check it

Read every command twice before you press Enter. Check the target: the server name, the user, the disk or device name, the path and the sizes. These commands are for learning and were tested in our lab, not on your system. At work, run the read-only commands first, follow your change process, make sure a backup exists, and ask a second person to check anything that changes or deletes data. You run them at your own risk.

You’ll build two Ubuntu Server VMs. graf01 (192.168.56.70) will run Grafana, Nginx, Prometheus, Loki, InfluxDB and Mailpit as the course goes on, and app01 (192.168.56.71) plays the application server with a web site, MySQL and the agents that feed graf01. Each VM gets a NAT adapter for the internet and a Host-only adapter so the VMs and your laptop reach each other on fixed addresses.

Already did the SaatVedha Prometheus course? Your prom01 and node01 VMs can do the same job, but every command in this course uses graf01 and app01 and their addresses, so building fresh VMs keeps things simpler.

1Check the VirtualBox host-only network

In VirtualBox Manager open File > Tools > Network Manager and pick the Host-only Networks tab. You should see one adapter with IPv4 address 192.168.56.1 and mask 255.255.255.0. Untick its DHCP server, because both VMs get static addresses.

Run this on your laptop (Linux or macOS terminal, or PowerShell on Windows):

VBoxManage list hostonlyifs

You should see:

Name:            vboxnet0
GUID:            786f6276-656e-4074-8000-0a0027000000
DHCP:            Disabled
IPAddress:       192.168.56.1
NetworkMask:     255.255.255.0
IPV6Address:
IPV6NetworkMaskPrefixLength: 0
HardwareAddress: 0a:00:27:00:00:00
MediumType:      Ethernet
Wireless:        No
Status:          Up
VBoxNetworkName: HostInterfaceNetworking-vboxnet0

Your GUID and hardware address will differ. On Windows the name looks like “VirtualBox Host-Only Ethernet Adapter” instead of vboxnet0, and that’s fine. What matters is the 192.168.56.1 address and DHCP Disabled.

✅ Checkpoint: A host-only network with 192.168.56.1/24 exists and its DHCP server is off.

2Create graf01

Click New, name it graf01, pick the Ubuntu Server ISO and tick Skip Unattended Installation so you see the installer. Before the first start, open Settings > Network: Adapter 1 attached to NAT, Adapter 2 enabled and attached to Host-only Adapter on the 192.168.56.1 network.

VMRAMCPUDiskAdapter 1Adapter 2
graf013072 MB230 GBNATHost-only (192.168.56.1 network)
app011536 MB120 GBNATHost-only (192.168.56.1 network)

graf01 gets the bigger share because Grafana, Prometheus and Loki all run there later. Lesson 13 asks you to raise it to 4 GB for a short while, and on an 8 GB laptop that still leaves room for your browser.

✅ Checkpoint: graf01 exists with 3 GB RAM, 2 CPUs and two adapters, NAT and Host-only.

3Install Ubuntu Server on graf01

Start the VM and accept the installer defaults. Use hostname graf01, user student, and tick Install OpenSSH server. Leave the second card (enp0s8) unconfigured, because netplan sets it in the next step, then remove the ISO, reboot and log in.

Run this on graf01:

hostnamectl --static
ip -br addr

You should see:

graf01
lo               UNKNOWN        127.0.0.1/8 ::1/128
enp0s3           UP             10.0.2.15/24 metric 100 fe80::a00:27ff:fe52:8d1e/64
enp0s8           DOWN

enp0s3 is the NAT card with VirtualBox’s usual 10.0.2.15 address and a route to the internet. enp0s8 is the host-only card with no address yet.

✅ Checkpoint: You are logged in as student on graf01 and enp0s8 is listed.

4Give enp0s8 a static address with netplan

Paste this whole block on graf01:

sudo tee /etc/netplan/60-hostonly.yaml >/dev/null <<'EOF'
network:
  version: 2
  ethernets:
    enp0s8:
      dhcp4: false
      addresses: [192.168.56.70/24]
EOF
sudo chmod 600 /etc/netplan/60-hostonly.yaml
sudo netplan apply
ip -br addr show enp0s8

You should see:

enp0s8           UP             192.168.56.70/24 fe80::a00:27ff:fe9b:3c10/64

There’s no gateway on this card on purpose, because internet traffic keeps using the NAT card. The chmod 600 matters too: netplan warns “Permissions for /etc/netplan/60-hostonly.yaml are too open” when other users can read the file.

✅ Checkpoint: enp0s8 on graf01 shows 192.168.56.70/24 and state UP.

5Clone app01 and give it its own identity

Shut graf01 down with sudo poweroff, right-click it and choose Clone. Name the clone app01, select Generate new MAC addresses for all network adapters and a Full clone, then set its RAM to 1536 MB and 1 CPU. Start app01 alone and run:

Run this on app01:

sudo hostnamectl set-hostname app01
sudo sed -i 's/192.168.56.70/192.168.56.71/' /etc/netplan/60-hostonly.yaml
sudo netplan apply
sudo rm -f /etc/machine-id && sudo systemd-machine-id-setup
sudo rm -f /etc/ssh/ssh_host_* && sudo dpkg-reconfigure openssh-server
hostnamectl --static; ip -br addr show enp0s8

First you’ll see “Initializing machine ID from random generator.” and then a “Creating SSH2 RSA key; this may take some time …” line followed by its fingerprint, and the same for the ECDSA and ED25519 keys. The last two lines are the ones to check:

app01
enp0s8           UP             192.168.56.71/24 fe80::a00:27ff:fe1d:72e4/64

A clone carries the same machine ID and SSH host keys as the original. Making new ones stops duplicate DHCP leases on the NAT side and the “host key changed” warning when you SSH in later. Disk size stays 30 GB on the clone, which is more than app01 needs and harmless.

✅ Checkpoint: app01 has hostname app01, address 192.168.56.71 and a fresh machine ID.

6Add both names to /etc/hosts and test

Start graf01 again. On both VMs add the two lines below, then ping across by name.

Run this on graf01 and on app01:

printf '192.168.56.70 graf01 graf01.lab\n192.168.56.71 app01 app01.lab\n' | sudo tee -a /etc/hosts
ping -c 2 app01

On graf01 the output looks like this (your ping times will differ):

192.168.56.70 graf01 graf01.lab
192.168.56.71 app01 app01.lab
PING app01 (192.168.56.71) 56(84) bytes of data.
64 bytes from app01 (192.168.56.71): icmp_seq=1 ttl=64 time=0.587 ms
64 bytes from app01 (192.168.56.71): icmp_seq=2 ttl=64 time=0.463 ms

--- app01 ping statistics ---
2 packets transmitted, 2 received, 0% packet loss, time 1001ms
rtt min/avg/max/mdev = 0.463/0.525/0.587/0.062 ms

From your laptop, ssh student@192.168.56.70 and ssh student@192.168.56.71 should both work now. Copy and paste is much easier in an SSH window than in the VirtualBox console, so use SSH from here on.

✅ Checkpoint: graf01 and app01 ping each other by name and you can SSH into both from your laptop.

7Take the base snapshot

Shut both VMs down (sudo poweroff), select each one in VirtualBox Manager and use Snapshots > Take. Name both snapshots base, so any later lesson can roll back to a clean, networked Ubuntu in a few seconds.

Or run this on your laptop:

VBoxManage snapshot graf01 take base --description "Ubuntu + netplan + hosts"
VBoxManage snapshot app01 take base --description "Ubuntu + netplan + hosts"
VBoxManage snapshot graf01 list

You should see (your UUIDs will differ):

0%...10%...20%...30%...40%...50%...60%...70%...80%...90%...100%
Snapshot taken. UUID: 3f0c2a51-7d2e-4b8e-9a6e-2c1f5d7b9e40
0%...10%...20%...30%...40%...50%...60%...70%...80%...90%...100%
Snapshot taken. UUID: 8b1d6e93-2a4c-4f07-b5d8-61e0c9a7f312
   Name: base (UUID: 3f0c2a51-7d2e-4b8e-9a6e-2c1f5d7b9e40) *
   Description: Ubuntu + netplan + hosts

The star marks the current snapshot. Start both VMs again before the next step.

✅ Checkpoint: Both VMs have a snapshot called base and are running again.

8A first look at Grafana from the tarball (temporary)

On graf01, download the Grafana OSS 13.3.0 standalone build, unpack it in your home folder and start it in the foreground. Lesson 2 installs Grafana properly from the APT repository with a service user and systemd, so this copy is only a test drive and you delete it afterwards.

Run this on graf01:

cd ~
wget -q https://dl.grafana.com/grafana/release/13.3.0/grafana_13.3.0_40412481033_linux_amd64.tar.gz
tar -zxf grafana_13.3.0_40412481033_linux_amd64.tar.gz
cd grafana*/ && ls -d bin conf public

You should see:

bin  conf  public

The tarball unpacks into one folder named after Grafana and its version, and bin, conf and public are the three parts Grafana needs to start. The long number in the file name is a build ID that changes with each release, so copy the current link from grafana.com/grafana/download with OSS selected if this one has moved on. The commands use grafana*/ so you don’t have to type the folder name.

Now start it (still on graf01, inside that folder):

./bin/grafana server

The output is long. These are the lines to look for (your times, commit and build date will differ):

logger=settings t=2026-11-08T06:10:42.512734918Z level=info msg="Starting Grafana" version=13.3.0 commit=... branch=HEAD compiled=...
logger=sqlstore t=2026-11-08T06:10:42.530118274Z level=info msg="Created default admin" user=admin
logger=http.server t=2026-11-08T06:10:45.981402117Z level=info msg="HTTP Server Listen" address=[::]:3000 protocol=http subUrl= socket=

Between them you’ll also see “Config loaded from”, “Path Home” and “Path Data” lines that point into the folder you unpacked.

Grafana logs in logfmt: logger= names the part of Grafana that wrote the line, then the time, level and message. The line you wait for is “HTTP Server Listen” address=[::]:3000, which means it accepts connections on port 3000 on all addresses. Without a grafana.ini it uses conf/defaults.ini and keeps its SQLite database under data/ in that folder.

✅ Checkpoint: The log shows “HTTP Server Listen” with address [::]:3000 and Grafana keeps running.

9Log in and draw a graph from TestData

On your laptop browse to http://192.168.56.70:3000. Log in as admin with password admin; Grafana then asks for a new password, and for this throwaway copy you can set one or click Skip. Ubuntu’s firewall (ufw) is off on a fresh install, which is why the port is reachable at all.

Open Connections > Data sources > Add new data source, search for TestData, select it and click Save & test. TestData is a built-in source that makes up fake series, so you can learn panels before any real backend exists.
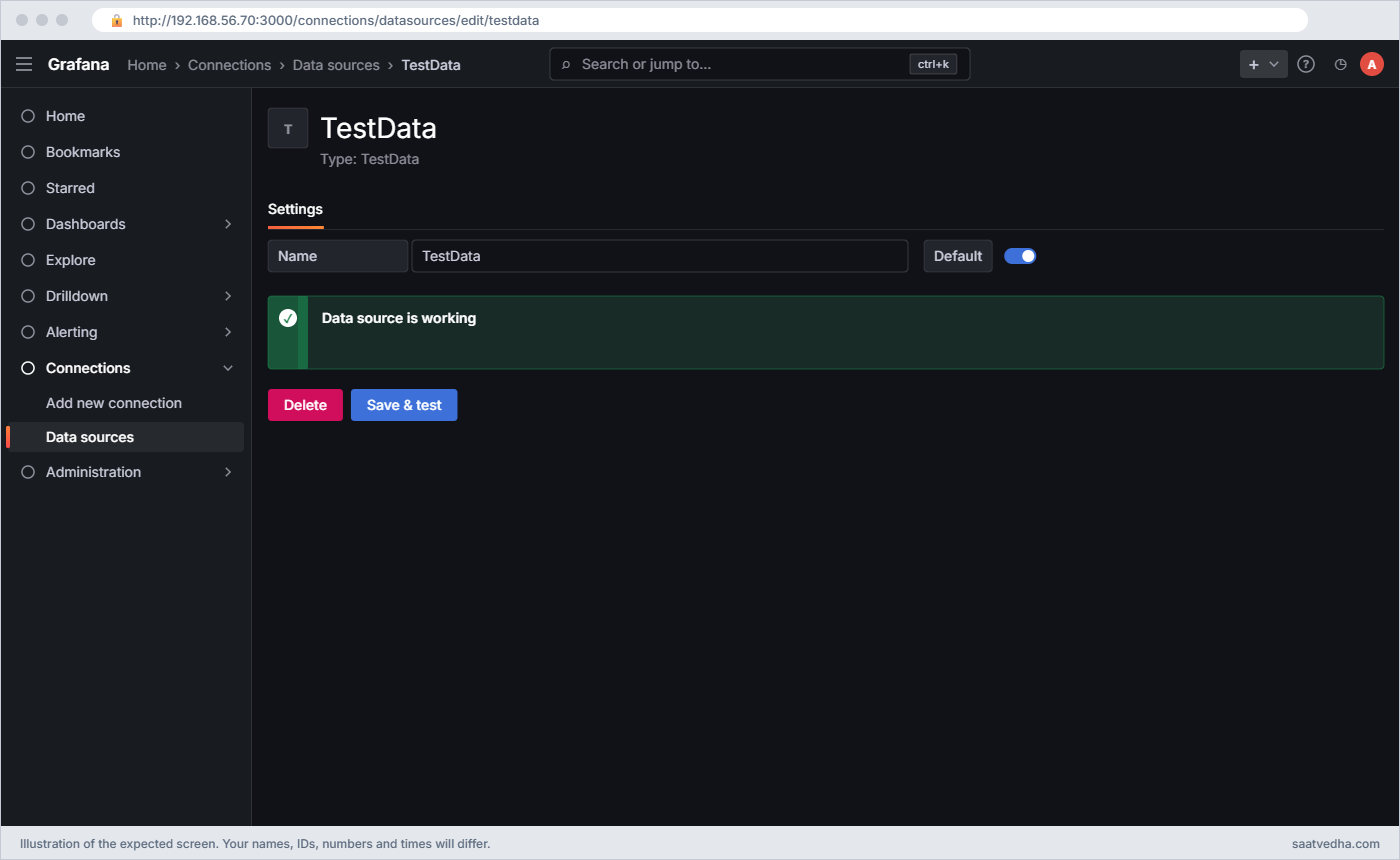
What is Grafana: TestData data source saved and tested with Data source is working
The TestData data source after Save & test: the green box reads “Data source is working”.

Now open Explore from the left menu, choose TestData at the top, leave the scenario on Random Walk and click Run query. A wobbly line appears for the last hour, and changing the time picker to “Last 6 hours” redraws it.

What is Grafana: Explore on graf01 with the TestData data source and a Random Walk series
Explore on graf01 with TestData: the Random Walk scenario draws one series, A-series, for the last hour.

Back on graf01, in a second SSH session, run this:

curl -s http://localhost:3000/api/health; echo
ls ~/grafana*/data | grep grafana.db

You should see:

{
  "database": "ok",
  "version": "13.3.0",
  "commit": "..."
}
grafana.db

The “commit” value is the Git hash of the build, so yours shows a real hash there. The health endpoint needs no login and is what load balancers and scripts check. The grafana.db file now holds your admin user and the TestData data source, and nothing else, because the random walk numbers are made up on each query and never stored.

✅ Checkpoint: Explore shows a Random Walk line from TestData, and /api/health returns “database”: “ok”.
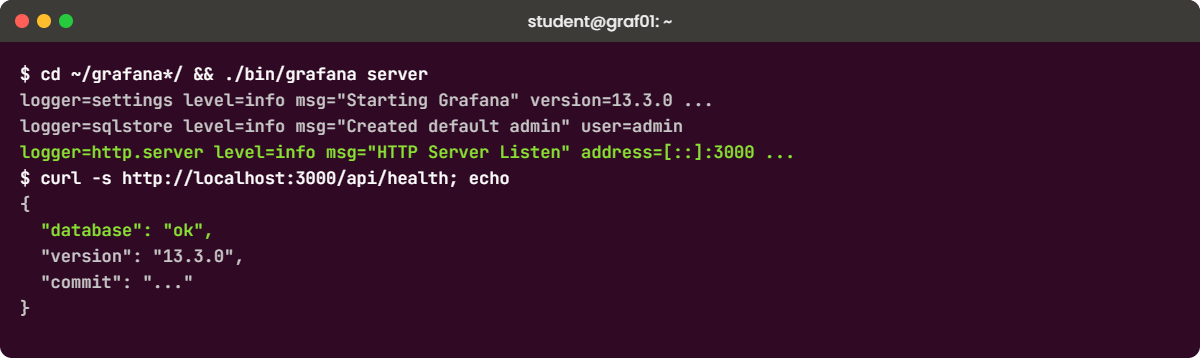
What is Grafana lab: Grafana 13.3 tarball started on graf01 and the /api/health check
The Grafana OSS tarball starting on graf01 and the /api/health check.

10Stop and clean up the test copy

Go back to the first SSH session and press Ctrl+C. Grafana logs a “Shutdown started” line and exits. Then remove the test copy so it doesn’t get in the way of the real install in Lesson 2.

Run this on graf01:

cd ~
rm -rf ~/grafana*/ ~/grafana_13.3.0_*_linux_amd64.tar.gz
sudo ss -ltnp | grep ':3000' || echo "port 3000 is free"

You should see:

port 3000 is free

✅ Checkpoint: Nothing listens on port 3000 and the tarball folder is gone from your home directory.

Break It, Then Fix It

Three problems that catch almost everyone on day one. All of them are safe on these VMs, and you still have the base snapshot if something goes sideways.

1A netplan file with one space wrong

Netplan is YAML, and YAML cares about indentation. On app01, push the addresses line one space to the left and apply:

Run this on app01:

sudo sed -i 's/^      addresses/     addresses/' /etc/netplan/60-hostonly.yaml
sudo netplan apply

You’ll get this error:

/etc/netplan/60-hostonly.yaml:6:6: Invalid YAML: inconsistent indentation:
     addresses: [192.168.56.71/24]
     ^

Netplan tells you the file, line 6 and column 6, and points at the bad spot with a caret. It refuses the whole file, so the card keeps its old settings until you fix it, and at work that’s good news because a typo doesn’t drop the server off the network.

Fix:

sudo sed -i 's/^     addresses/      addresses/' /etc/netplan/60-hostonly.yaml
sudo netplan apply && ip -br addr show enp0s8

✅ Checkpoint: netplan apply runs without errors and enp0s8 on app01 still shows 192.168.56.71/24.

2The VMs can’t reach each other

On app01, take the host-only card down and ping it from graf01:

Run the first line on app01, the ping on graf01:

sudo ip link set enp0s8 down
ping -c 2 app01

You’ll get this error:

PING app01 (192.168.56.71) 56(84) bytes of data.
From graf01 (192.168.56.70) icmp_seq=1 Destination Host Unreachable
From graf01 (192.168.56.70) icmp_seq=2 Destination Host Unreachable

--- app01 ping statistics ---
2 packets transmitted, 0 received, +2 errors, 100% packet loss, time 1027ms

“Destination Host Unreachable” coming from your own address means ARP got no answer, so nothing on that network owns 192.168.56.71. You see the same thing when Adapter 2 is disabled in VirtualBox, attached to NAT by mistake or attached to a different host-only network, so check those settings next.

Fix (on app01):

sudo ip link set enp0s8 up
ip -br addr show enp0s8

✅ Checkpoint: ping app01 from graf01 works again.

3Grafana says port 3000 is already in use

Start the tarball Grafana again (download it once more if you already cleaned up), then start a second copy in another SSH session:

Run this in a second SSH session on graf01:

cd ~/grafana*/ && ./bin/grafana server

The second copy stops, and the error near the end of its output contains this text:

failed to open listener on address :3000: listen tcp :3000: bind: address already in use

Only one program can listen on a TCP port at a time. At work this usually means an old Grafana is still running, someone started a test copy and forgot it, or a different tool (some Node.js apps also like 3000) got there first. Grafana wraps that text in its own log fields and an “Error: ✗” line, so search the output for “address already in use”.

Fix: find who owns the port, then stop that one:

sudo ss -ltnp | grep ':3000'
LISTEN 0      4096               *:3000            *:*    users:(("grafana",pid=2214,fd=12))

Stop the first copy with Ctrl+C in its session (or kill 2214), and clean up again as in lab step 10. If you ever need two copies for a test, give the second its own folder and set GF_SERVER_HTTP_PORT=3001 in front of the start command.

✅ Checkpoint: Only one Grafana ran at a time, and after cleanup ss shows nothing on port 3000.

This happened at work

The dashboard that was green for an hour

A friend of mine runs the platform team at a food delivery app in Bengaluru, and she told me this one over filter coffee. One Friday around 8:30 pm, peak dinner time, the support team said customers couldn’t place orders, yet the big Grafana screen in the office showed every panel green and the orders-per-minute graph was flat and healthy.

The on-call engineer first restarted Grafana, thinking the screen was stuck, which changed nothing. Then someone opened the orders panel in Explore and saw that the last data point was from 7:24 pm. The graph wasn’t flat because orders were steady; the “Connect null values” option was drawing a straight line across the gap, and the stat panel showed “last non-null” value, which was an hour old.

The real cause was the metrics backend. A disk on the Prometheus server had filled up at 7:24, so it stopped writing samples, and Grafana kept showing the last thing it knew because Grafana stores nothing of its own. The team cleared space, and Prometheus caught up in a few minutes.

The change they made the next week was small. Every important dashboard got a “data age” stat panel showing how many seconds since the last sample, turning red after two minutes, and an alert rule for the same check. Since then nobody trusts a green screen without glancing at that panel first.

Common mistakes and troubleshooting

MistakeWhat happensWhat to do instead
Thinking Grafana stores your metricsYou back up only Grafana and lose months of history when the metrics server diesBack up the backends (Prometheus, Loki, MySQL) as well; Grafana’s own backup is grafana.db and its config
Downloading the Enterprise build by accidentIt works, but packages, repos and docs differ from what the course usesSelect OSS on the download page and install the package named grafana
Cloning a VM without new MACs or machine-idBoth VMs fight over the same NAT lease or SSH warns that the host key changedPick “Generate new MAC addresses” and reset machine-id and SSH host keys as in lab step 5
Using tabs in a netplan or YAML filenetplan apply refuses the file with an Invalid YAML errorUse spaces only and let your editor show tabs so you can spot them
Leaving Grafana on port 3000 open to everyoneAnyone on the network sees a login page, and admin/admin may still work on a forgotten test copyChange the password at first login and put Grafana behind Nginx with HTTPS, as Lesson 3 does
Trusting a green dashboard without checking data ageA dead backend looks like a quiet, healthy systemShow the time of the last sample or a data-age panel on every important dashboard

Interview questions

Click a question to open it. Each one is written the way an interviewer would ask it. Under it you will see why they ask it and one way you could answer, in your own words.

Fresher level

1. In your own words, what is Grafana and what does it store?

Why they ask this: They want to hear that Grafana is a visualisation and alerting layer, not a database.

How you might answer: Grafana is a web application that connects to data sources like Prometheus, Loki or MySQL, runs queries on them and shows the results as dashboards and alerts. It doesn’t store the metrics or logs themselves.

Its own database, grafana.db in SQLite by default, only holds users, dashboards as JSON, data source settings and alert rules.

2. What is a data source, a dashboard and a panel?

Why they ask this: A basic vocabulary check, because every later question builds on these three words.

How you might answer: A data source is a saved connection to one backend, like Prometheus at http://localhost:9090. A dashboard is a page saved as JSON with a time range and panels on it.

A panel is one box on the dashboard: it has one or more queries against a data source and a visualisation such as a time series, stat or table.

2–5 years experience

3. A user says a Grafana panel shows “No data”. Walk me through how you find the cause.

Why they ask this: They want a methodical order, from Grafana outward to the data, not random clicking.

How you might answer: First I check the panel’s time range and whether Grafana can reach the data source, using Save & test on the data source page. Then I open the panel in Explore or the query inspector to see the exact query and what came back.

If the backend returns nothing, I run the same query directly on it, for example in the Prometheus UI, and check whether the target is up. Only when the data is there do I look at panel settings like units, transformations or hidden series.

4. Your team uses Zabbix today. Why might they still add Grafana, and what wouldn’t change?

Why they ask this: They’re checking that you see Grafana as a screen on top, not a replacement for collection.

How you might answer: Zabbix would still collect and store the data and run its triggers. Grafana, with the Zabbix data source plugin, lets the team build dashboards that mix Zabbix data with Prometheus metrics, Loki logs or business numbers from SQL, which the Zabbix frontend can’t do.

So the change is on the viewing and sometimes alerting side, while agents, templates and the Zabbix database stay as they are.

Senior level

5. Your company asks whether to run Grafana OSS, Enterprise or Grafana Cloud. How do you decide?

Why they ask this: They want judgement about cost, skills, compliance and features, not a sales pitch.

How you might answer: I’d look at three things: whether data may leave our network, whether we have people to run and upgrade the stack, and whether we need specific Enterprise features like enterprise data source plugins, reporting or extra auth and audit options.

If data must stay in-house and the team can run it, OSS is the default. If we need vendor support or those features, Enterprise on our own servers, and if we’d rather not run Grafana, Mimir and Loki ourselves, Grafana Cloud.

6. How would you explain observability to a manager, and where does Grafana sit in it?

Why they ask this: They are checking whether you can explain the metrics, logs and traces idea in plain words and place each tool correctly.

How you might answer: I’d say metrics tell us something is wrong, like error rate jumping to 5%, logs tell us what went wrong in the words of the application, and traces show which service in the chain was slow. Each is stored in its own backend, for example Prometheus or Mimir, Loki and Tempo.

Grafana is the common screen and alerting layer on top, so an engineer can go from a spike on a graph to the matching log lines and traces without changing tools.

Quick quiz

Q1. Which port does Grafana listen on by default?

  1. 9090
  2. 3000
  3. 3100
  4. 8086
Show answer

B — 3000 is Grafana. 9090 is Prometheus, 3100 Loki and 8086 InfluxDB.

Q2. What does Grafana keep in grafana.db?

  1. All metric samples it has shown
  2. Users, dashboards, data source settings and alert rules
  3. A copy of every log line
  4. Nothing at all
Show answer

B — Grafana stores its own configuration objects. Metrics and logs stay in the backends.

Q3. With the default server access mode, who sends the query to Prometheus?

  1. Your browser
  2. The Grafana backend
  3. Prometheus pulls it from Grafana
  4. Nginx
Show answer

B — The browser calls Grafana’s API and the Grafana server queries the data source, so localhost means the Grafana machine.

Q4. Which built-in data source creates fake data for learning panels?

  1. Loki
  2. Mixed
  3. TestData
  4. Dashboard
Show answer

C — TestData generates scenarios such as Random Walk without any real backend.

Q5. A dashboard shows a flat line, but the backend stopped an hour ago. What helps you spot this quickly?

  1. A darker theme
  2. A panel showing the time or age of the last sample
  3. More panels on the dashboard
  4. Restarting Grafana
Show answer

B — A data-age panel or alert makes stale data visible, because Grafana itself only shows what the backend returns.

Quick recap

  • Grafana is a screen and alerting layer: it connects to data sources, runs queries and draws the results, but stores no metrics or logs itself.
  • Data sources, dashboards, panels and queries are the four words everything else builds on, and dashboards are saved as JSON in grafana.db.
  • Metrics, logs and traces each live in their own backend, and Grafana lets you look at them side by side.
  • OSS, Enterprise and Cloud share the same core; this course uses Grafana OSS 13.3 on your own VMs.
  • Your lab is ready: graf01 at 192.168.56.70 and app01 at 192.168.56.71, both with a snapshot called base.

Next lesson

Lesson 2: Install Grafana on Ubuntu and keep it updated → You install Grafana OSS from the official APT repository as a systemd service, learn grafana.ini, reset a lost admin password and practise a safe upgrade and downgrade.

Further reading: what is Grafana

Want to go deeper into what is Grafana? The official Grafana introduction and fundamentals pages explain data sources, dashboards and observability in more detail, and the TestData docs list every scenario you can play with. If you want the metrics side first, the SaatVedha Prometheus monitoring course starts with what is Prometheus, and Linux performance monitoring covers the numbers your dashboards will show.

You can also see the full plan for this course on the Grafana Dashboards and Observability course page.

Scroll to Top

This website uses cookies

We use a few cookies to keep this site working. If you allow it, we also use Google Analytics to count visits so we can improve our lessons. You can accept all, deny the optional ones, or choose what to allow.