Grafana dashboards are what most operations teams look at all day: one screen that shows CPU, errors, log lines and alerts from many systems side by side. Grafana doesn’t store data itself. It connects to the places your data already lives (Prometheus, Loki, MySQL, InfluxDB, Elasticsearch, Zabbix) and turns it into graphs, tables and alerts.

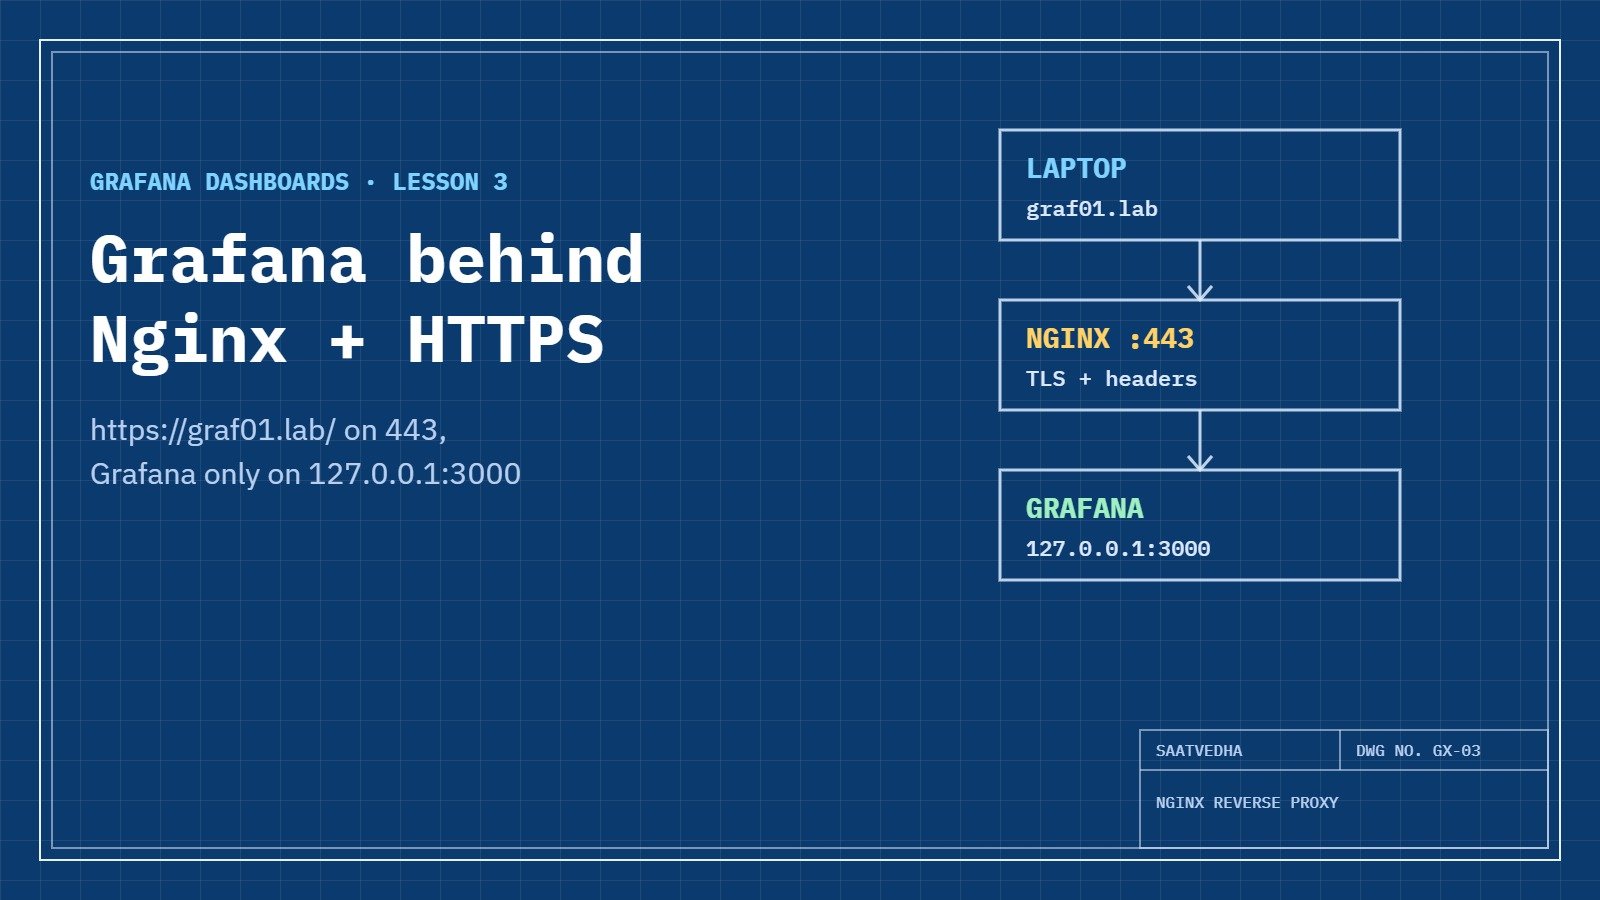
This course starts with installing Grafana on Ubuntu and putting it behind HTTPS. Then you build dashboards panel by panel: time series, stat, gauge, bar gauge and table, with rows, variables and repeating panels so one dashboard works for every server.

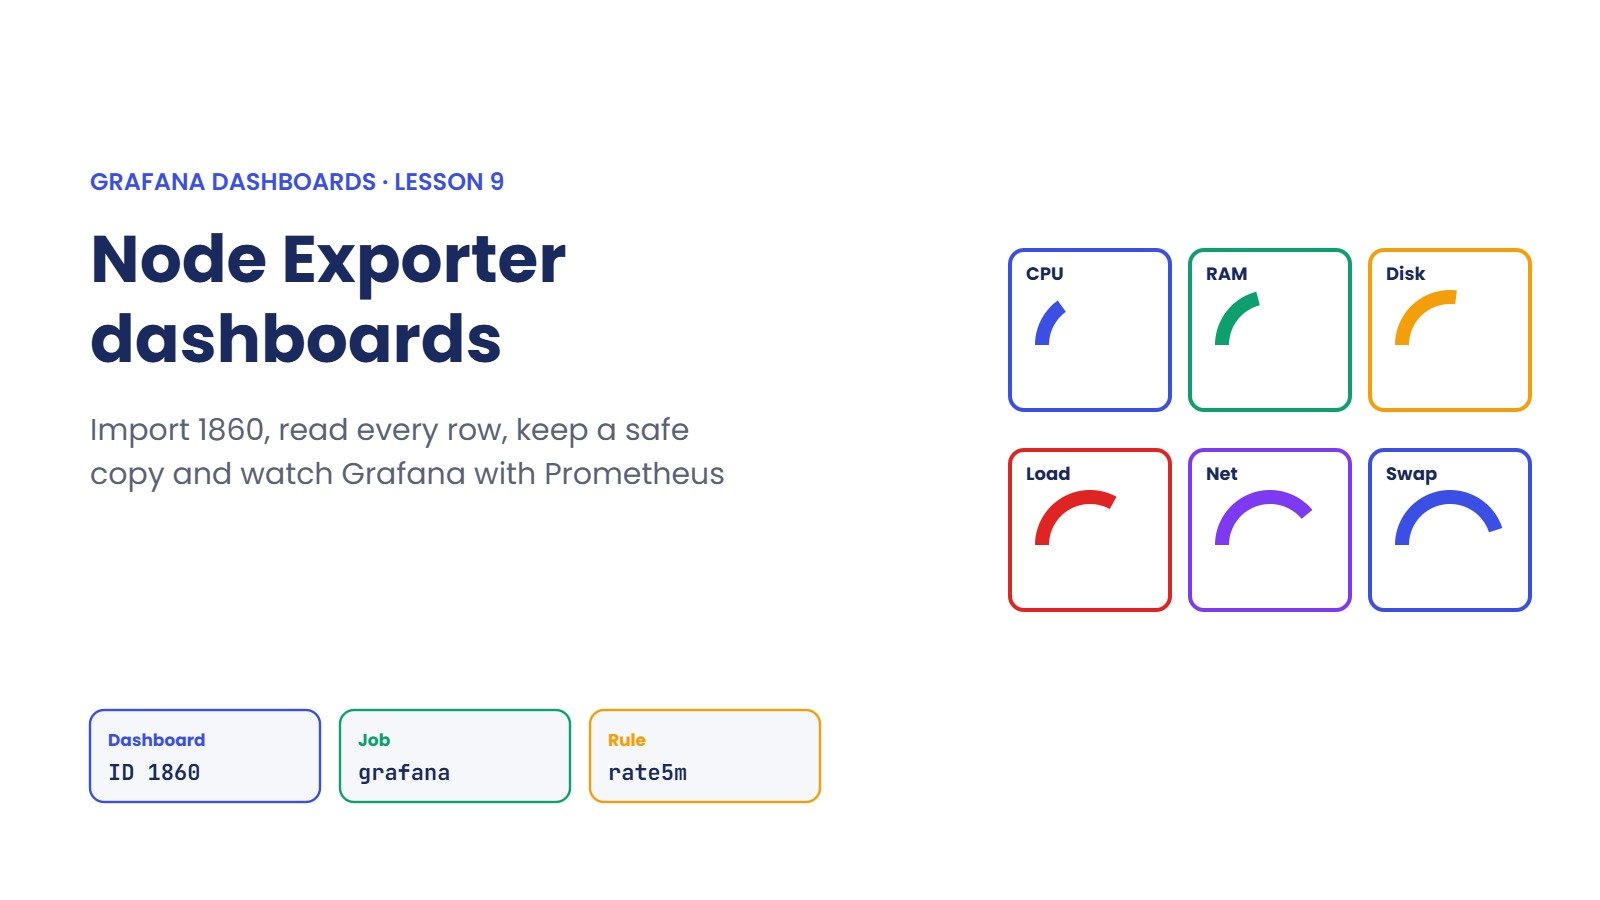
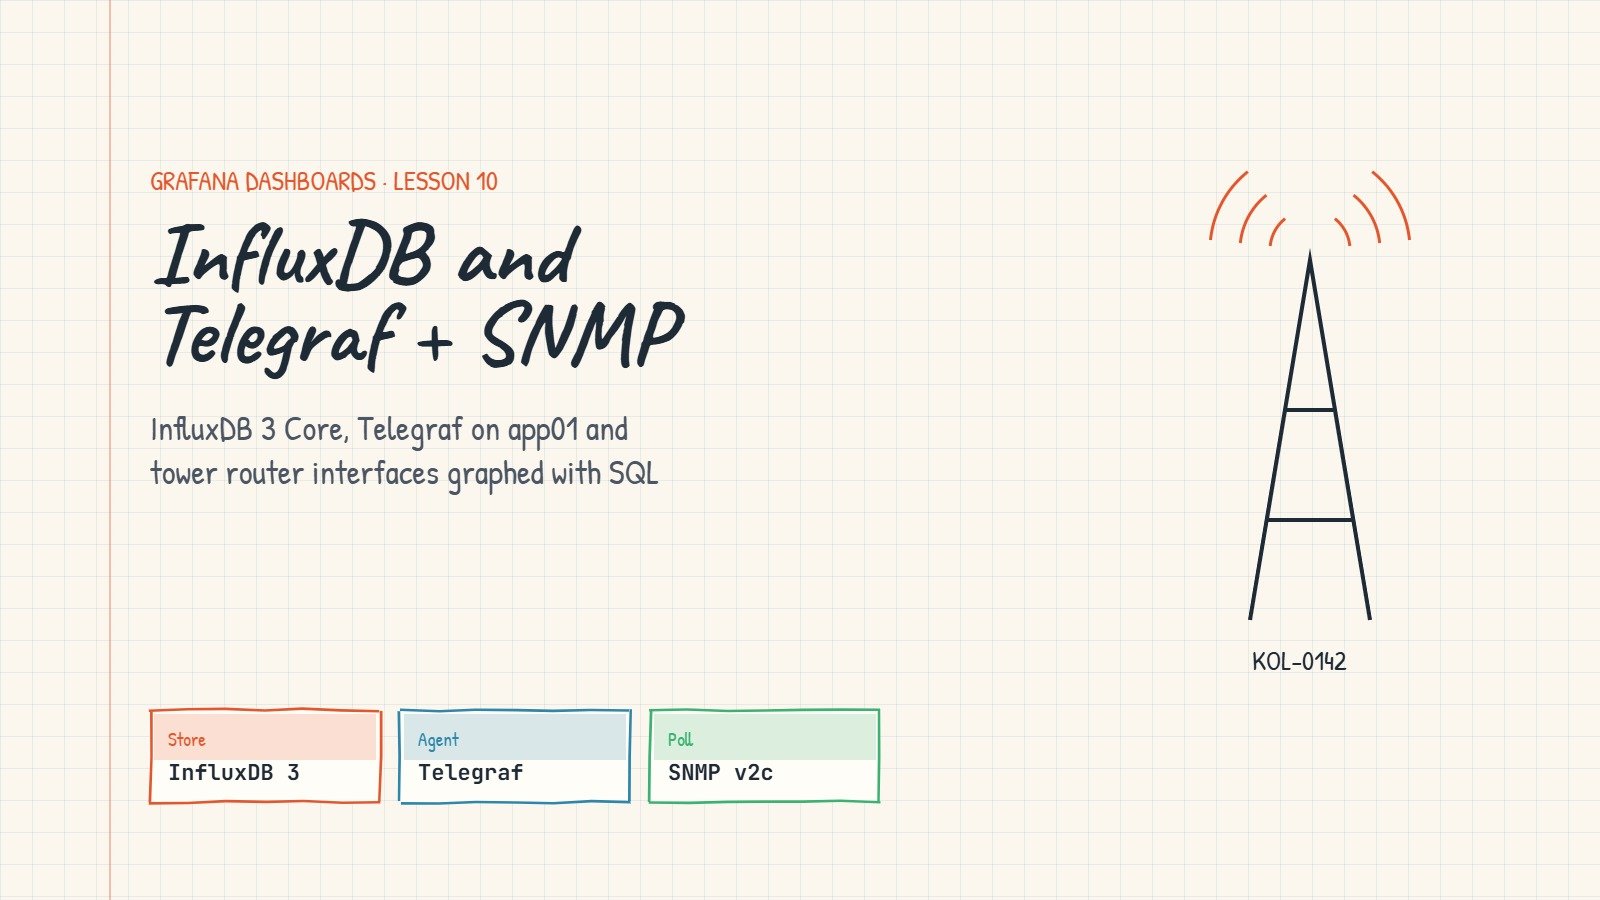
After that you connect real data: Prometheus with Node Exporter, MySQL with time series and non-time series queries, logs from Nginx through Grafana Alloy into Loki, and InfluxDB with Telegraf collecting Linux and SNMP data. The last phase covers Grafana alerting with email and Telegram, users, teams and organisations, provisioning dashboards as code, and fixing the problems that come up when Grafana runs for a whole team.

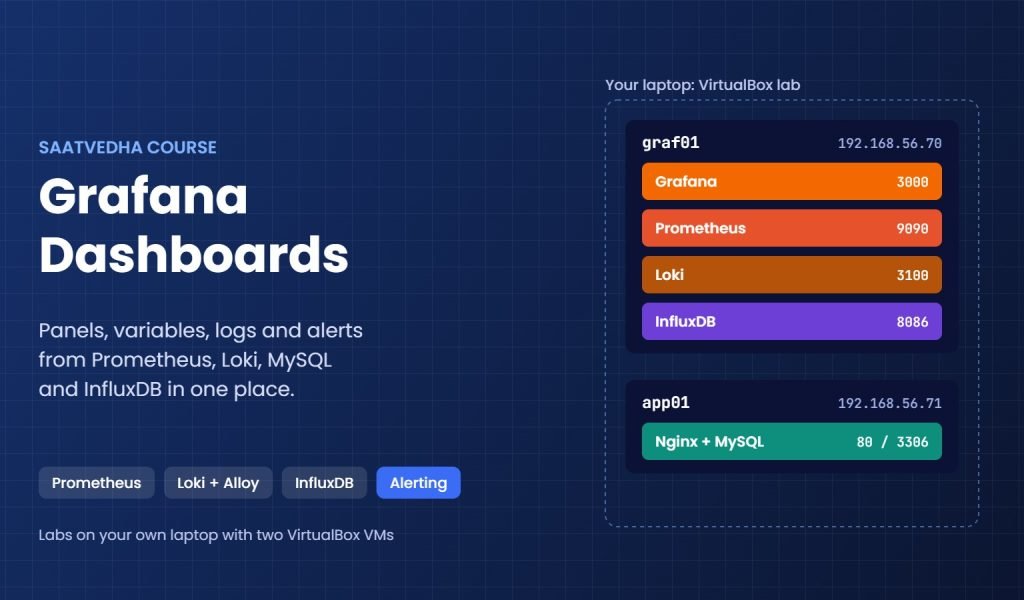
What you need: a laptop with 8 GB of RAM and VirtualBox. Lesson 1 builds the two Ubuntu Server VMs used in every lab. Every lesson has a “Break It, Then Fix It” lab and interview questions at three levels.
Who This Course Is For
What You Will Learn
By the end of this course, you will be able to:
Why Learn Grafana?

Grafana is open source and used by small startups and very large companies alike to watch servers, networks, applications and business numbers in one place. Job adverts for NOC, Linux, DevOps and SRE roles often list it next to Prometheus, Loki and Zabbix.

Teams need people who can build a dashboard that answers a question quickly, connect a new data source without breaking the old ones, and set alerts that reach the right person. This course builds those skills one lab at a time.

Course Meta Information

Estimated Time: 14 lessons, about 14 hours

Difficulty: Beginner

Tracks:

Categories:

Further reading: Grafana dashboards

Official documentation: Grafana documentation, Loki and Grafana Alloy.

Related courses: Prometheus Monitoring, Zabbix Monitoring and Linux Administration.

Phase 1: Grafana setup and your first dashboards

Phase 2: Data sources, logs and metrics

Phase 3: Alerting, teams and running Grafana

Scroll to Top

This website uses cookies

We use a few cookies to keep this site working. If you allow it, we also use Google Analytics to count visits so we can improve our lessons. You can accept all, deny the optional ones, or choose what to allow.