Install Grafana on Ubuntu and keep it updated
-
Phase 1: Grafana setup and your first dashboards
-
Phase 2: Data sources, logs and metrics
-
Phase 3: Alerting, teams and running Grafana
In this lesson you install Grafana on Ubuntu the way it runs at work: from the official Grafana APT repository, as a systemd service with its own user, with a known place for config, data, logs and plugins. Then you learn the few parts of grafana.ini you’ll touch most, how to get back in when someone forgets the admin password, and how to upgrade, hold and roll back a version without losing dashboards.
You install one release behind the newest on purpose, take a backup and then upgrade, so the first upgrade you ever do is in a lab and not on a Friday night at work. Everything happens on graf01; app01 rests today.
Where this lesson fits
Lesson 2 of 14 in Grafana Dashboards and Observability · Phase 1: Grafana setup and your first dashboards · Before this: Lesson 1, what is Grafana · Next: Lesson 3, Grafana behind Nginx with HTTPS
| Time | You need | By the end you can |
|---|---|---|
| About 75 minutes | graf01 and app01 from Lesson 1 (snapshot base), internet on graf01 through the NAT adapter | Install, configure, back up, upgrade and downgrade Grafana OSS on Ubuntu, and recover a lost admin password |
What it is, in one line
Installing Grafana on Ubuntu means adding the signed Grafana APT repository, installing the grafana package, enabling the grafana-server systemd unit and setting the few options in /etc/grafana/grafana.ini that your setup needs.
In Simple Words
Ordering from the company canteen, not a roadside stall
You could buy lunch from any stall outside the office, but the company canteen has a fixed menu card, a hygiene certificate on the wall and a counter where you complain if the dal is cold. Next month, when the menu changes, the canteen tells you and your token still works.
The official Grafana APT repository is that canteen. The signing key is the certificate, apt checks it every time, and apt upgrade brings the new menu without you hunting for download links.
Engineer's View
What the grafana package puts on your server
The deb package creates a system user and group called grafana, installs the program under /usr/share/grafana, and ships a systemd unit called grafana-server.service that runs /usr/share/grafana/bin/grafana server as that user. The unit reads its paths from /etc/default/grafana-server, and the package does not start the service on first install: you enable and start it yourself.
| Path | What lives there | Owner |
|---|---|---|
| /etc/grafana/grafana.ini | Your settings. Copied from sample.ini on first install, every line commented out with ; | root:grafana, mode 640 |
| /usr/share/grafana/conf/defaults.ini | Built-in defaults. Never edit it, upgrades overwrite it | root |
| /var/lib/grafana/grafana.db | SQLite database: users, dashboards, data sources, alert rules | grafana |
| /var/lib/grafana/plugins | Plugins you install with grafana cli | grafana |
| /var/log/grafana/grafana.log | Log file (Grafana also logs to the journal) | grafana |
| /etc/grafana/provisioning/ | YAML files that create data sources, dashboards and alerts at start-up (Lesson 13) | root:grafana |
| /etc/default/grafana-server | Environment file the systemd unit reads: CONF_FILE, DATA_DIR, LOG_DIR, PLUGINS_DIR | root |
Settings are layered. Grafana reads defaults.ini first, then grafana.ini on top, then any environment variable named GF_<SECTION>_<KEY>, for example GF_SERVER_HTTP_PORT=3001. The last one wins, which is handy in containers and confusing when someone left a variable in the unit file.
How it works, step by step
1APT trusts the repository through a key
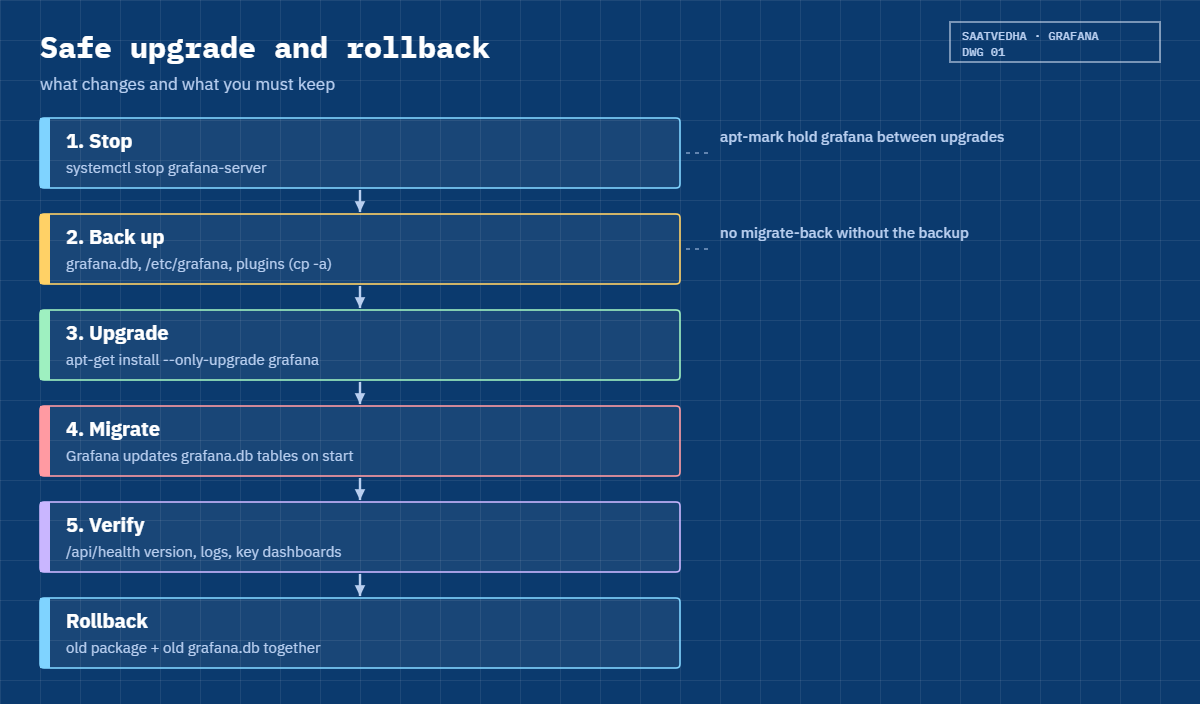
You download Grafana’s public key into /etc/apt/keyrings/grafana.asc and add a source line with signed-by pointing at that file. The key only vouches for this one repository, unlike the old apt-key way that trusted a key for everything. The drawing below shows the path from the repository to a running service.
2The package installs files and a user, then waits
The post-install script creates the grafana user, sets ownership on /var/lib/grafana and /var/log/grafana, copies sample.ini to /etc/grafana/grafana.ini and prints a reminder to enable the service. On an upgrade it restarts Grafana for you instead, because RESTART_ON_UPGRADE=true is set in /etc/default/grafana-server.
3First start creates the database
When the service starts the first time, Grafana finds no grafana.db, creates it with mode 640, runs its database migrations and creates the admin user with password admin. On every later start it runs any new migrations, which is why a big version jump can take a minute and why you back up the file before upgrading.
4Upgrade, hold and roll back
An upgrade replaces the program files and keeps your grafana.ini, plugins and database. Grafana then migrates the database forward on start. There is no “migrate back”, so a rollback is two steps: install the older package and restore the database copy you took before upgrading, as the second drawing shows.
5The grafana.ini sections you will touch most
The file has more than a hundred sections, but day to day you change a handful. Uncomment a line by removing the leading ;, change the value and restart the service.
| Section | Keys you’ll use | Why |
|---|---|---|
| [server] | http_addr, http_port, domain, root_url | Where Grafana listens and the URL it puts in links and emails (Lesson 3) |
| [database] | type, path, host, name, user, password | SQLite by default; MySQL or PostgreSQL for bigger setups (Lesson 14) |
| [security] | admin_user, admin_password, secret_key, cookie_secure | First admin and encryption of stored data source passwords |
| [users] | allow_sign_up, default_theme, auto_assign_org_role | Who can create accounts and what role they get (Lesson 12) |
| [smtp] | enabled, host, from_address | Email for alerts and invites (Lesson 11) |
| [log] | mode, level | console, file or both; debug when troubleshooting |
admin_password in grafana.ini only applies when the database is created for the first time. Changing it later does nothing, which is why the reset command exists.
Hands-on lab: install, configure, back up and upgrade Grafana on graf01
Before you run any command, double-check it
Read every command twice before you press Enter. Check the target: the server name, the user, the disk or device name, the path and the sizes. These commands are for learning and were tested in our lab, not on your system. At work, run the read-only commands first, follow your change process, make sure a backup exists, and ask a second person to check anything that changes or deletes data. You run them at your own risk.
All steps run on graf01 as student. You install Grafana 13.2.x first, look around, back it up, then upgrade to 13.3.x. If 13.2.5 is no longer listed when you do this, pick any older line from apt-cache policy instead.
1Add the Grafana APT repository
Paste this whole block on graf01:
sudo apt-get update
sudo apt-get install -y apt-transport-https wget gnupg
sudo mkdir -p /etc/apt/keyrings
sudo wget -q -O /etc/apt/keyrings/grafana.asc https://apt.grafana.com/gpg-full.key
sudo chmod 644 /etc/apt/keyrings/grafana.asc
echo "deb [signed-by=/etc/apt/keyrings/grafana.asc] https://apt.grafana.com stable main" | sudo tee /etc/apt/sources.list.d/grafana.list
sudo apt-get updateThe tee command echoes the repository line back:
deb [signed-by=/etc/apt/keyrings/grafana.asc] https://apt.grafana.com stable mainAfter it, the second apt-get update lists the Ubuntu mirrors as usual and adds lines for https://apt.grafana.com stable InRelease and stable/main amd64 Packages, then ends with “Reading package lists… Done”. Use tee without -a so running the block twice doesn’t add a duplicate line.
On 24.04 you’ll see “noble” instead of “resolute” in the Ubuntu lines, and the Grafana lines are the same for both.
✅ Checkpoint: apt-get update fetches apt.grafana.com stable InRelease with no GPG or NO_PUBKEY error.
2See which versions are available
Run this:
apt-cache policy grafana | head -8You should see:
grafana:
Installed: (none)
Candidate: 13.3.0
Version table:
13.3.0 500
500 https://apt.grafana.com stable/main amd64 Packages
13.2.5 500
500 https://apt.grafana.com stable/main amd64 PackagesCandidate is what a plain apt install grafana would give you. The version table lists every release the repository still carries, and the exact strings in this list are what you use with grafana=<version>. Newer releases may sit above 13.3.0 by the time you read this.
Make sure you see grafana and not only grafana-enterprise.
✅ Checkpoint: apt-cache policy grafana shows a Candidate from apt.grafana.com and at least two versions.
3Install an older release on purpose
Run this:
sudo apt-get install -y grafana=13.2.5Near the end of the output you should see:
Setting up grafana (13.2.5) ...
### NOT starting on installation, please execute the following statements to configure grafana to start automatically using systemd
sudo /bin/systemctl daemon-reload
sudo /bin/systemctl enable grafana-server
### You can start grafana-server by executing
sudo /bin/systemctl start grafana-serverOn Ubuntu 24.04 a few info: lines about adding the system user grafana appear between those two, while 26.04 creates the user quietly. The package tells you plainly that it hasn’t started anything. That’s normal for Grafana and catches people who expect a web page straight after apt install.
✅ Checkpoint: dpkg shows grafana 13.2.5 installed and the “NOT starting on installation” message appeared.
4Enable and start the service
Run this:
sudo systemctl daemon-reload
sudo systemctl enable --now grafana-server
systemctl status grafana-server --no-pager | head -6
sudo ss -ltnp | grep ':3000'You should see (your times, IDs and PIDs will differ):
Created symlink '/etc/systemd/system/multi-user.target.wants/grafana-server.service' → '/usr/lib/systemd/system/grafana-server.service'.
● grafana-server.service - Grafana instance
Loaded: loaded (/usr/lib/systemd/system/grafana-server.service; enabled; preset: enabled)
Active: active (running) since Sun 2026-11-08 06:41:12 UTC; 4s ago
Invocation: 3b1f0c7e9a2d4c58b6e1f0a9d2c7b483
Docs: http://docs.grafana.org
Main PID: 2731 (grafana)
LISTEN 0 4096 *:3000 *:* users:(("grafana",pid=2731,fd=11))That’s the Ubuntu 26.04 output. On 24.04 the symlink paths have no quotes and there’s no Invocation line, so the Main PID line moves up one. enable --now does two things in one go: start at every boot, and start right now. Port 3000 on * means all addresses, so your laptop can reach it for the moment; Lesson 3 moves it to 127.0.0.1 behind Nginx.
✅ Checkpoint: grafana-server is active (running), enabled, and listening on port 3000.
5First login and the forced password change
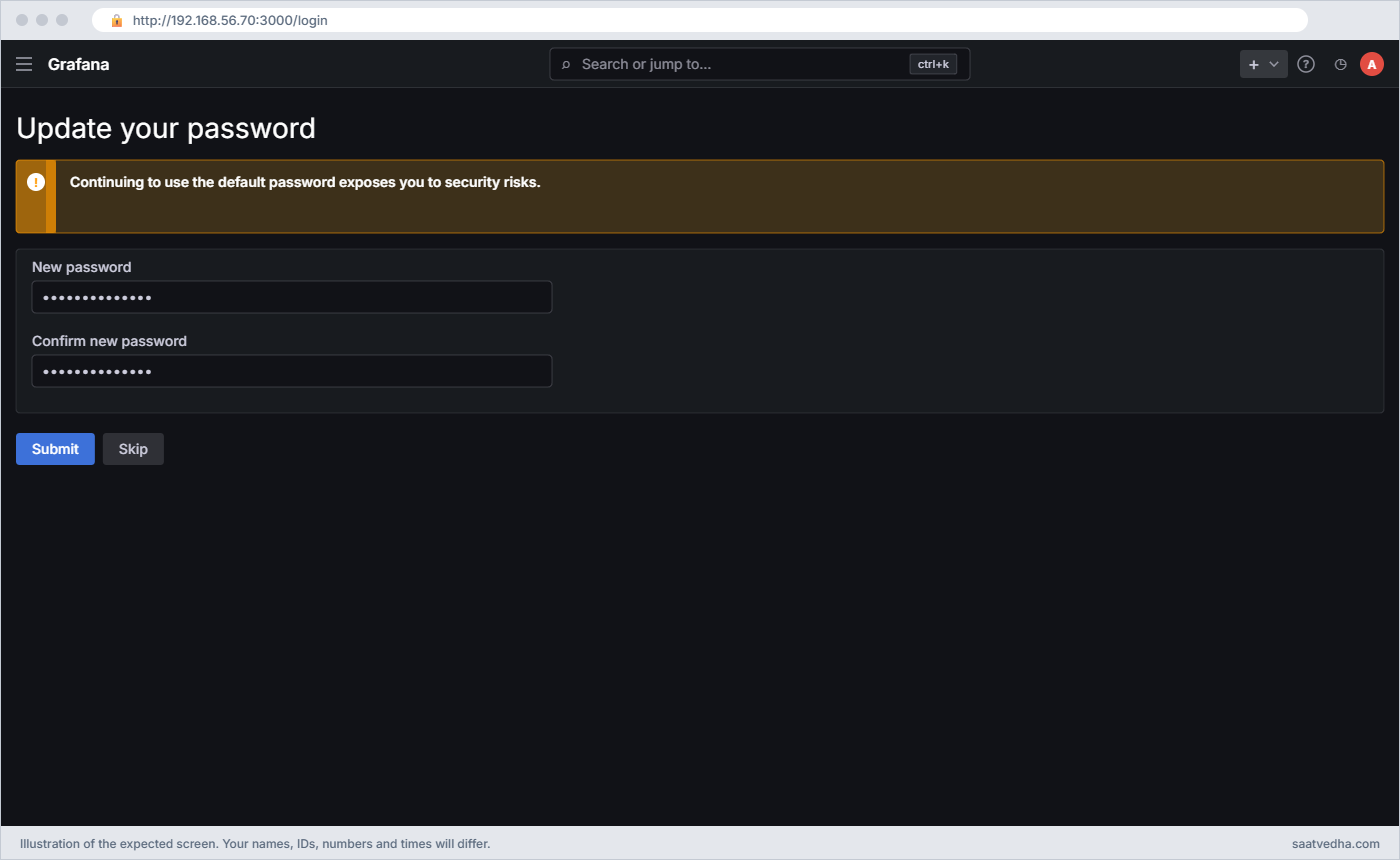
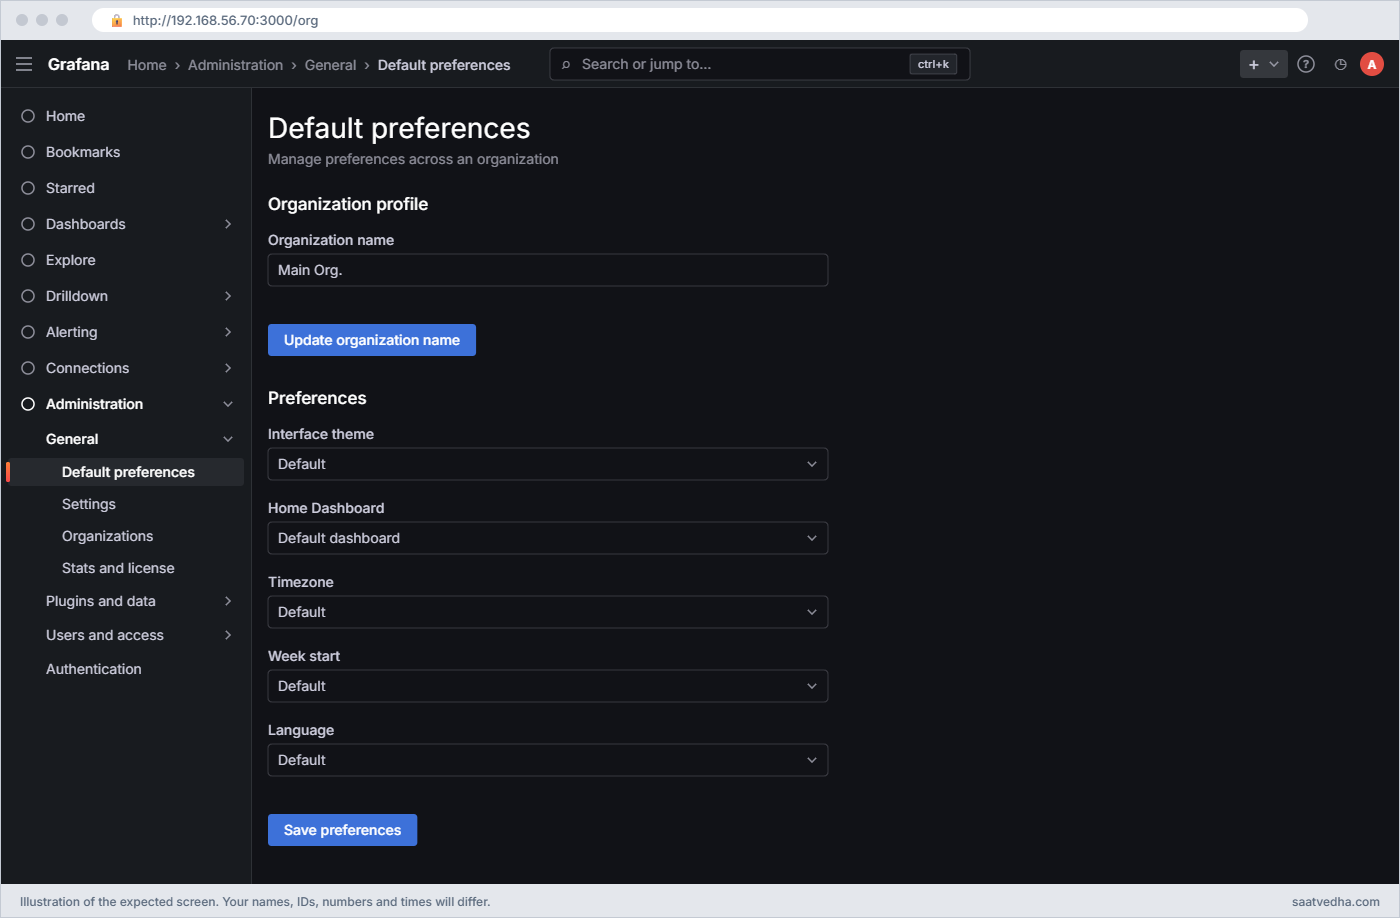
Browse to http://192.168.56.70:3000 from your laptop and log in as admin / admin. This time don’t skip the next screen: set a real password and keep it in your password manager. Then open Administration > General > Default preferences if you want to change the theme, and look at the help menu (the ? icon) to confirm the version reads 13.2.5.
Then check from graf01:
curl -s localhost:3000/api/health; echo
sudo stat -c '%U:%G %a %n' /var/lib/grafana /var/lib/grafana/grafana.db /etc/grafana/grafana.ini /etc/grafana/provisioningYou should see:
{
"database": "ok",
"version": "13.2.5",
"commit": "..."
}
grafana:grafana 755 /var/lib/grafana
grafana:grafana 640 /var/lib/grafana/grafana.db
root:grafana 640 /etc/grafana/grafana.ini
root:grafana 755 /etc/grafana/provisioningYour “commit” line shows the real Git hash of the build. Each stat line is owner:group, the mode in numbers, then the path. Notice that grafana.ini belongs to root and only the grafana group can read it.
Grafana can read its settings but can’t change them, which is what you want from a service that faces a network.
✅ Checkpoint: You logged in with a new admin password and /api/health shows version 13.2.5.
6Make your first grafana.ini changes
Give the instance a name in the browser tab and switch off the call-home features you don’t need in a lab. Open the file with sudo nano /etc/grafana/grafana.ini, find each section and uncomment or change these lines:
[server]
domain = graf01.lab
[analytics]
reporting_enabled = false
check_for_updates = false
[users]
default_theme = light
[log]
mode = console file
level = infoThen run this:
sudo grep -E '^(domain|reporting_enabled|check_for_updates|default_theme|level) ' /etc/grafana/grafana.ini
sudo systemctl restart grafana-server
sudo grep 'HTTP Server Listen' /var/log/grafana/grafana.log | tail -n 1You should see (your time will differ):
domain = graf01.lab
reporting_enabled = false
check_for_updates = false
default_theme = light
level = info
logger=http.server t=2026-11-08T06:48:20.114208341Z level=info msg="HTTP Server Listen" address=[::]:3000 protocol=http subUrl= socket=The grep proves your lines are active, because commented lines start with ; and don’t match. Each key must sit under the right section header; a domain line placed under [users] is silently ignored.
✅ Checkpoint: grep shows your five uncommented settings, Grafana restarted cleanly and the login page is light.
7Reset a forgotten admin password
Pretend you lost the admin password. On graf01, the grafana cli command can set a new one straight in the database. The grafana command the package puts on your PATH is a small wrapper script that passes the package’s home path, config file and data path, so you don’t type them yourself.
Run this:
sudo grafana cli admin reset-admin-password 'Lab@Grafana2026'The last line of the output should read:
Admin password changed successfully ✔Log in with the new password to prove it. The older spelling grafana-cli admin reset-admin-password still works but prints a deprecation warning, so get used to the new form. If you renamed the admin user, the command says “Admin user cannot be found” and lists admin users with their IDs; add --user-id <id> and run it again.
Keep the password out of your shell history in real life by using --password-from-stdin.
✅ Checkpoint: You can log in as admin with the password you set.
8Back up before upgrading
The SQLite file must be copied while Grafana is stopped, otherwise you can copy it half-written. Back up the config and plugins too.
Paste this whole block:
sudo systemctl stop grafana-server
B=/var/backups/grafana-$(dpkg-query -W -f='${Version}' grafana)-$(date +%F)
sudo mkdir -p $B
sudo cp -a /var/lib/grafana $B/data
sudo cp -a /etc/grafana $B/etc
sudo systemctl start grafana-server
sudo ls $BYou should see:
data etcThe data folder is a copy of /var/lib/grafana with grafana.db and any plugins you install later, and etc is a copy of /etc/grafana. cp -a keeps the owner and mode, so a restore puts files back as they were. The folder name carries the installed version, for example /var/backups/grafana-13.2.5-2026-11-08, so you always know which release a backup belongs to.
✅ Checkpoint: The backup folder holds data (with grafana.db inside) and etc, and Grafana is running again.
9Upgrade to the current release
Run this:
sudo apt-get update
sudo apt-get install -y --only-upgrade grafana
dpkg-query -W grafana
curl -s localhost:3000/api/health | grep versionAmong the apt lines, and from the last two commands, you should see:
Unpacking grafana (13.3.0) over (13.2.5) ...
Setting up grafana (13.3.0) ...
Restarting grafana-server service... OK
grafana 13.3.0
"version": "13.3.0",Because RESTART_ON_UPGRADE=true, the package restarted the service for you. A plain sudo apt-get upgrade would also do this along with every other package, which is fine on a lab VM but at work you usually upgrade Grafana on its own so you know what changed. Your dashboards, users and the light theme are still there, because only program files were replaced.
✅ Checkpoint: dpkg-query and /api/health both show 13.3.x and you can still log in.

10Hold the version and take a snapshot
Stop routine apt upgrade runs from moving Grafana without you deciding, then save the VM state.
Run this:
sudo apt-mark hold grafana
apt-mark showholdYou should see:
grafana set on hold.
grafanaWhen you’re ready for the next release, sudo apt-mark unhold grafana, back up as in step 8 and upgrade. Shut graf01 down and take a VirtualBox snapshot called grafana-installed; Lesson 3 starts from it.
✅ Checkpoint: apt-mark showhold lists grafana and graf01 has a snapshot called grafana-installed.
Break It, Then Fix It
Take the grafana-installed snapshot first. These three failures are the ones you’ll meet most on real servers, and each one stops Grafana from starting.
1Port 3000 is already taken
Stop Grafana, start something else on port 3000, then start Grafana again:
Run this on graf01:
sudo systemctl stop grafana-server
nohup python3 -m http.server 3000 >/dev/null 2>&1 &
sudo systemctl start grafana-server; sleep 3
systemctl is-active grafana-server
sudo journalctl -u grafana-server -n 20 --no-pager | grep -iE 'error|listen'systemctl is-active prints activating or failed, depending on how many restarts systemd has already tried. In the journal, the lines to look for contain this text:
failed to open listener on address :3000: listen tcp :3000: bind: address already in use
grafana-server.service: Main process exited, code=exited, status=1/FAILUREThe unit has Restart=on-failure, so systemd keeps trying and the state flips between activating and failed. The journal line tells you the cause in plain words.
Fix: find the owner of the port and stop it:
sudo ss -ltnp | grep ':3000'
kill %1 2>/dev/null || pkill -f 'http.server 3000'
sudo systemctl restart grafana-server && systemctl is-active grafana-serverLISTEN 0 5 0.0.0.0:3000 0.0.0.0:* users:(("python3",pid=3388,fd=3))
activeIf the other program must keep port 3000, move Grafana instead with http_port = 3001 under [server].
✅ Checkpoint: ss shows grafana as the only listener on 3000 and the service is active.
2Wrong permissions on /var/lib/grafana
Someone “tidies up” the data folder and hands it to root:
Run this on graf01:
sudo chown root:root /var/lib/grafana && sudo chmod 700 /var/lib/grafana
sudo systemctl restart grafana-server; sleep 3
sudo journalctl -u grafana-server -n 30 --no-pager | grep -i 'grafana.db'The journal shows an error that ends with this text:
can't check for existence of "/var/lib/grafana/grafana.db": stat /var/lib/grafana/grafana.db: permission deniedThe service runs as user grafana, which can no longer even look inside the folder, so it can’t open its database and exits. Grafana puts “Error: ✗” and a few words of its own in front, and “permission denied” on /var/lib/grafana is the clue. The same thing happens after restoring a backup with plain cp as root, which leaves the file owned by root.
Fix:
sudo chown -R grafana:grafana /var/lib/grafana
sudo chmod 755 /var/lib/grafana
sudo systemctl restart grafana-server && systemctl is-active grafana-server✅ Checkpoint: /var/lib/grafana is owned by grafana again and the service is active.
3One broken line in grafana.ini
Edit the file and forget the equals sign on one line:
Run this on graf01:
sudo sed -i 's/^domain = graf01.lab/domain graf01.lab/' /etc/grafana/grafana.ini
sudo systemctl restart grafana-server; sleep 3
sudo journalctl -u grafana-server -n 10 --no-pager | grep -i parseYou’ll get this error:
grafana[3577]: Error: ✗ failed to parse "/etc/grafana/grafana.ini": key-value delimiter not found: domain graf01.labGrafana refuses to start with a config it can’t read, and the message gives you the exact text of the bad line. A missing ] on a section header gives “unclosed section: [server” in the same way.
Fix:
sudo sed -i 's/^domain graf01.lab/domain = graf01.lab/' /etc/grafana/grafana.ini
sudo systemctl restart grafana-server && systemctl is-active grafana-server✅ Checkpoint: The service is active again and grep domain shows “domain = graf01.lab”.
4Roll back an upgrade (optional)
If an upgrade goes wrong at work, you go back to the old package and the old database together. Practise it once:
Paste this whole block:
sudo apt-mark unhold grafana
sudo systemctl stop grafana-server
sudo apt-get install -y --allow-downgrades grafana=13.2.5
B=/var/backups/grafana-13.2.5-$(date +%F)
sudo cp -a $B/data/grafana.db /var/lib/grafana/grafana.db
sudo systemctl start grafana-server
curl -s localhost:3000/api/health | grep versionYou should see this warning among the apt lines:
dpkg: warning: downgrading grafana from 13.3.0 to 13.2.5and the last command prints:
"version": "13.2.5",Skipping the database restore can leave an older Grafana facing tables that a newer version already changed, and that’s when you see odd migration errors. Restore the grafana-installed snapshot afterwards to come back to 13.3.
✅ Checkpoint: /api/health shows 13.2.5 with your old database, then the snapshot brings you back to 13.3.
This happened at work
The upgrade that wiped the NOC dashboards
My team lead tells this one whenever someone wants to “quickly run apt upgrade”. He was at a broadband ISP in Chennai, and the NOC there had about forty dashboards on one Grafana VM, with SQLite as the database. A junior admin patched the VM on a Tuesday evening with apt upgrade, and Grafana jumped two major versions along with the kernel updates.
Next morning half the panels showed errors because an old Angular-based panel plugin no longer loaded in the new version. The admin’s first idea was to install the old package again, and that made it worse: the older Grafana started against a database the newer one had already migrated, and the login page itself began failing.
There was no copy of grafana.db from before the upgrade, only a weekly VM backup from five days earlier. They restored that, lost five days of dashboard edits and alert changes, and then replaced the old plugin panels one by one on a test VM before upgrading again.
After that the team put apt-mark hold grafana on every Grafana server, wrote a one-page runbook (stop, copy grafana.db and /etc/grafana, upgrade, check plugins) and read the release notes for breaking changes before each upgrade. The runbook is twelve lines long and nobody has lost a dashboard since.
Common mistakes and troubleshooting
| Mistake | What happens | What to do instead |
|---|---|---|
| Using apt-key or a key without signed-by | A deprecation warning, and the key is trusted for every repository | Keep the key in /etc/apt/keyrings and reference it with signed-by in grafana.list |
| Expecting Grafana to start after apt install | Nothing on port 3000 and confusion | Run systemctl daemon-reload and systemctl enable --now grafana-server |
| Editing defaults.ini | Your change disappears at the next upgrade | Put every change in /etc/grafana/grafana.ini |
| Leaving the ; in front of a changed line | The setting is ignored and the default stays | Remove the ; and check with grep that the line is active |
| Copying grafana.db while Grafana runs | The copy may be corrupt when you need it | Stop the service first, or back up with sqlite3 .backup |
| Downgrading without restoring the database | Migration errors or a broken login page | Restore the grafana.db copy from before the upgrade together with the old package |
| Restoring files as root with plain cp | Grafana can’t open its database: permission denied | Use cp -a, or chown -R grafana:grafana /var/lib/grafana afterwards |
Interview questions
Click a question to open it. Each one is written the way an interviewer would ask it. Under it you will see why they ask it and one way you could answer, in your own words.
Fresher level
1. How do you install Grafana on Ubuntu, and how do you check it’s running?
Why they ask this: They want the standard repository method, not a random download, and a quick health check.
How you might answer: I add the Grafana key to /etc/apt/keyrings/grafana.asc, add the apt.grafana.com stable main repository with signed-by, then apt install grafana. The package doesn’t start it, so I run systemctl enable --now grafana-server.
To check, I look at systemctl status grafana-server, ss -ltnp for port 3000 and curl localhost:3000/api/health, which should say database ok and show the version.
2. Where does Grafana keep its settings and its data on a deb install?
Why they ask this: A basic map of the filesystem, needed for any troubleshooting or backup.
How you might answer: Settings are in /etc/grafana/grafana.ini, with built-in defaults in /usr/share/grafana/conf/defaults.ini that I never edit. Data is in /var/lib/grafana: grafana.db for users, dashboards and data sources, and the plugins folder.
Logs go to /var/log/grafana/grafana.log and to the journal, and provisioning files live in /etc/grafana/provisioning.
2–5 years experience
3. Nobody knows the Grafana admin password and the admin left the company. What do you do?
Why they ask this: They’re checking you know the server-side reset and its limits.
How you might answer: On the Grafana server I run sudo grafana cli admin reset-admin-password with a new password, which writes it straight into the database. If the admin login was renamed, it lists admin users and I pass --user-id.
If Grafana uses MySQL or PostgreSQL I make sure the command reads the real grafana.ini, which the package wrapper does, otherwise it would reset a local SQLite file instead. Then I create named admin accounts so we don’t depend on one shared login.
4. Walk me through how you upgrade Grafana on a production server.
Why they ask this: They want a safe, repeatable process with a rollback path.
How you might answer: I read the release notes for breaking changes and plugin compatibility, then test on a copy. On the day I stop grafana-server, copy grafana.db, /etc/grafana and the plugins folder to a dated backup, unhold the package and run apt-get install --only-upgrade grafana.
After it starts I check /api/health, the logs and the key dashboards and alerts, then hold the package again. If it fails, I install the old version with --allow-downgrades and restore the database copy together.
Senior level
5. Your Grafana settings work on one server but a colleague’s identical grafana.ini behaves differently on another. Where do you look?
Why they ask this: They want to see that you know the configuration layers, not only the file.
How you might answer: Grafana layers settings: defaults.ini, then grafana.ini, then GF_ environment variables, and the last one wins. So I check the environment of the running process, /etc/default/grafana-server and any systemd drop-ins with systemctl cat grafana-server.
I also check that keys sit under the right section and aren’t commented out, and on the Administration > Settings page I can see the values Grafana loaded.
6. Would you keep Grafana on SQLite in production? Why or why not?
Why they ask this: A design question about scale, high availability and backups.
How you might answer: For a single server with a few users SQLite is fine and simple to back up, as long as I stop Grafana or use sqlite3 .backup. I’d move to MySQL or PostgreSQL when I need two Grafana instances behind a load balancer, many concurrent editors or alert evaluation at scale, because SQLite allows one writer and can show “database is locked”.
The database also becomes part of the normal DB backup and monitoring process, which auditors tend to like.
Quick quiz
Q1. Which file should you edit to change Grafana’s settings on a deb install?
- /usr/share/grafana/conf/defaults.ini
- /etc/grafana/grafana.ini
- /var/lib/grafana/grafana.db
- /etc/default/grafana
Show answer
B — grafana.ini overrides defaults.ini, and upgrades leave it alone.
Q2. After apt install grafana, what is the state of the service?
- Running and enabled
- Installed but not started
- Started but not enabled
- Masked
Show answer
B — The package prints “NOT starting on installation”; you run systemctl enable --now grafana-server.
Q3. Which command resets the admin password from the server?
- grafana admin reset
- sudo grafana cli admin reset-admin-password NEWPASS
- systemctl reset grafana
- sqlite3 grafana.db reset
Show answer
B — grafana cli admin reset-admin-password writes the new password into the database.
Q4. What must you restore along with the old package when you roll back an upgrade?
- /etc/apt/sources.list
- The grafana.db backup taken before the upgrade
- The Grafana logs
- Nothing
Show answer
B — The newer version migrated the database forward; the older version needs the old database.
Q5. What does apt-mark hold grafana do?
- Stops the service
- Prevents apt upgrade from changing the grafana package
- Deletes old versions
- Locks the database
Show answer
B — A held package is skipped by apt upgrade until you unhold it.
Quick recap
- Install Grafana OSS from apt.grafana.com with a signed-by key in /etc/apt/keyrings, then enable and start grafana-server yourself.
- Settings go in /etc/grafana/grafana.ini, data in /var/lib/grafana, logs in /var/log/grafana, and GF_ environment variables override both files.
- grafana cli admin reset-admin-password gets you back in when the admin password is lost.
- Before every upgrade stop Grafana and copy grafana.db, /etc/grafana and the plugins folder; roll back with the old package plus that database copy.
- Hold the package so upgrades only happen when you choose, and keep the grafana-installed snapshot for Lesson 3.
Next lesson
Lesson 3: Put Grafana behind Nginx with HTTPS → You stop exposing port 3000, bind Grafana to 127.0.0.1 and serve it at https://graf01.lab/ through Nginx with a self-signed certificate and working live updates.
Further reading: install Grafana on Ubuntu
Want to go deeper into install Grafana on Ubuntu? The official Debian and Ubuntu install guide, the configuration reference for every grafana.ini key, the upgrade guide and the Grafana CLI page cover this lesson in more depth. The Linux administration course explains apt, systemd and file permissions if any of those felt new, and Lesson 1 has the VM setup if you skipped it.
You can also see the full plan for this course on the Grafana Dashboards and Observability course page.
