Logs in Grafana with Loki and Alloy

Grafana Loki is the log store that sits next to Prometheus in most Grafana setups: Prometheus keeps the numbers, Loki keeps the log lines, and Grafana shows both on one screen. In this lesson you install Loki on graf01 as a proper service with seven days of retention, install Grafana Alloy on both VMs to ship system and application logs, and learn enough LogQL to find a failed SSH login or a payment timeout in seconds.

You’ll also break the pipeline three ways (old timestamps, too many labels and a file Alloy can’t read) so you recognise those errors in a real Loki or Alloy log.

Where this lesson fits

Lesson 7 of 14 in Grafana Dashboards and Observability · Phase 2: Data sources, logs and metrics · Before this: Lesson 6, MySQL in Grafana · Next: Lesson 8, Nginx logs and LogQL metrics

TimeYou needBy the end you can
About 90 minutesgraf01 and app01 from Lesson 6, internet on both VMsRun Loki and Alloy as services, write LogQL with selectors, filters and parsers, and fix the three most common ingestion errors

What it is, in one line

Loki is a log database that indexes only a small set of labels per stream and stores the log lines compressed, and Grafana Alloy is the agent that reads log files and pushes them to Loki.

In Simple Words

The courier sorting centre in Pune

A courier sorting centre doesn’t open every parcel and catalogue what’s inside. It sticks a label on each bag with the city and the pin code, and stacks the bags by label. When someone asks “where is the parcel from Jaipur?”, the staff go to the Jaipur stack first and only then open the bags they need.

Loki works the same way: labels such as job and host decide which stack a log line goes into, and the line itself stays sealed until a query opens that stack and searches inside. Alloy is the delivery van that picks up the bags from each server.

Engineer's View

Streams, labels and why Loki is cheap

Loki groups log lines into streams. A stream is one unique set of labels, for example {job="varlogs", host="app01", filename="/var/log/syslog"}. Loki indexes only those labels; the lines themselves are packed into compressed chunks on disk.

A query first picks streams by label (cheap, uses the index), then scans the chunk content with filters (brute force, but over a small slice).

PartWhat it does in this labWhere
LokiReceives pushes on /loki/api/v1/push, stores chunks and a TSDB index, answers LogQLgraf01, port 3100, config /etc/loki/config.yml
CompactorMerges index files and deletes data older than retention_periodInside the same Loki process
Grafana AlloyTails files, keeps a read position, adds labels, batches lines and pushes themgraf01 and app01, config /etc/alloy/config.alloy, UI 127.0.0.1:12345
GrafanaLoki data source, Explore, log panelsgraf01, data source “Loki” at http://localhost:3100

That design makes labels precious. Every new label value creates a new stream, each with its own chunks, so a label like request_id or user_id turns one stream into millions and Loki refuses them once max_global_streams_per_user (5000 by default) is reached. Values that change on every line belong in the line, where filters and parsers can still find them.

Promtail, the old Loki agent, reached end of life on 2 March 2026 and gets no more updates. Grafana Alloy replaces it, and alloy convert --source-format=promtail can translate an old promtail.yaml for you.

How it works, step by step

1Alloy finds and tails files

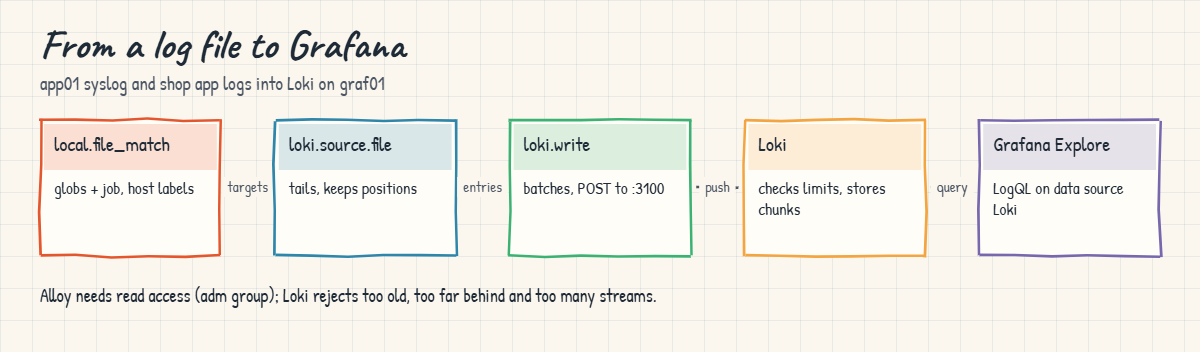
In Alloy you wire components together. local.file_match expands glob patterns into a list of targets, each with a __path__ and your labels. loki.source.file opens each file, reads new lines as they’re written and remembers how far it got in a positions file under /var/lib/alloy/data, so a restart doesn’t resend everything. The diagram below shows the whole path from a log file on app01 to a line in Grafana.

2Alloy batches and pushes to Loki

Each line becomes an entry with a timestamp (the time Alloy read it, unless a parsing stage says otherwise) and the target’s labels. loki.write groups entries per stream into batches and POSTs them to Loki’s push API. If Loki is down, Alloy keeps retrying with back-off, so a short Loki restart doesn’t lose lines.

Grafana Loki pipeline: local.file_match, loki.source.file and loki.write in Alloy to Loki and Explore

3Loki validates and stores

Loki checks every entry: the labels must be valid, the stream count must stay under the limit, and the timestamp must not be older than reject_old_samples_max_age or more than an hour behind the newest entry already in that stream. Accepted lines go into an in-memory chunk per stream, protected by a write-ahead log, and are flushed to /var/lib/loki/chunks.

4LogQL picks streams, then filters lines

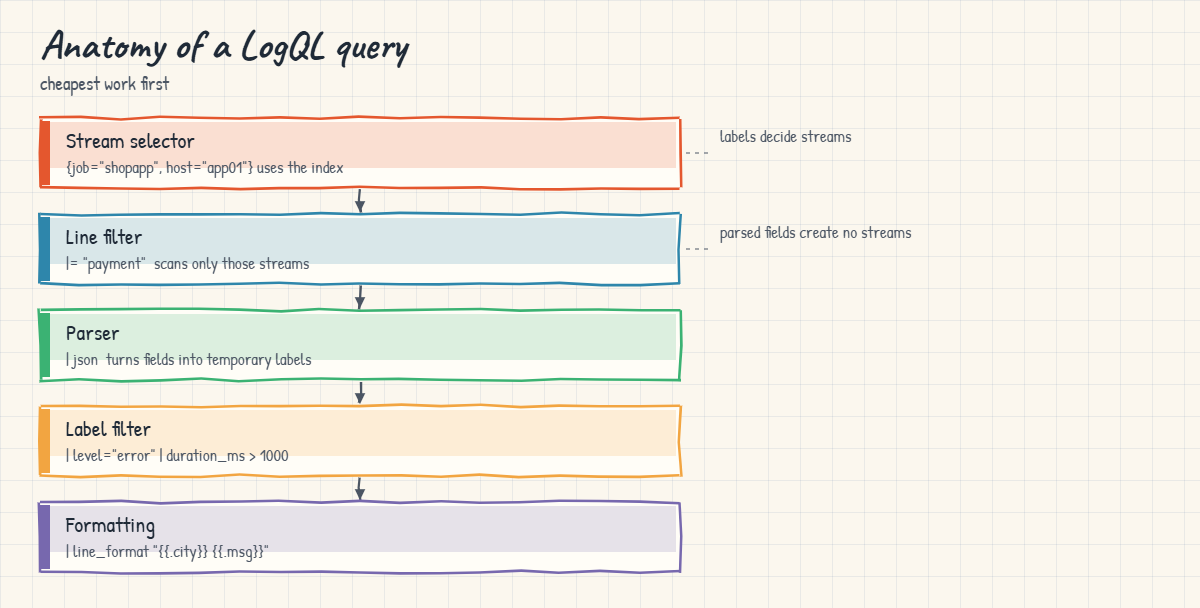
A LogQL query always starts with a stream selector in braces, such as {job="varlogs", host="app01"}. After that comes a pipeline: line filters (|=, !=, |~, !~), parsers (json, logfmt, pattern, regexp) that turn parts of the line into temporary labels, and label filters on those. The second drawing lays out one query stage by stage.

Grafana Loki LogQL query anatomy: stream selector, line filter, parser, label filter and formatting

5Retention and what to label

With retention_enabled: true the compactor deletes chunks older than retention_period, here 168h (7 days); it needs delete_request_store set or Loki refuses to start. Keep labels to things with a handful of values that you filter by every day.

Good labelBad labelWhy
job=”nginx”path=”/order/98123″Paths, IDs and user names create a stream per value
host=”app01″client_ip=”49.36.12.8″IPs change with every visitor
env=”lab”level=”error” from every lineLevels are fine on a few streams; use a parser and filter when in doubt
filename=”/var/log/syslog”timestamp or request_idNever put values that change on every line into labels

Hands-on lab: Loki on graf01 and Alloy on both VMs

Before you run any command, double-check it

Read every command twice before you press Enter. Check the target: the server name, the user, the disk or device name, the path and the sizes. These commands are for learning and were tested in our lab, not on your system. At work, run the read-only commands first, follow your change process, make sure a backup exists, and ask a second person to check anything that changes or deletes data. You run them at your own risk.

Loki and an Alloy instance run on graf01; a second Alloy runs on app01. Commands say which VM. Take a snapshot of both VMs before you start, because this lesson changes services on both.

1Install Loki on graf01 from the Grafana APT repository

graf01 already has the Grafana APT repository from Lesson 2, so Loki is one package away. The package installs /usr/bin/loki, a loki system user and a loki.service unit that runs /usr/bin/loki -config.file /etc/loki/config.yml.

Run this on graf01:

sudo apt-get update
sudo apt-get install -y loki
loki --version | head -1
systemctl cat loki | grep ExecStart

The first line starts with loki, version 3.7.9 (or a later 3.x release), followed by the branch and Git revision it was built from. The second line should read:

ExecStart=/usr/bin/loki -config.file /etc/loki/config.yml

The package enables and starts Loki straight away with its own sample config, so you’ll replace that file next and restart. Loki 3.7.x is current as I write this; any 3.x release takes the same config. If you prefer the zip from GitHub releases, put loki-linux-amd64 in /usr/local/bin and write the same unit by hand, the rest of the lesson is identical.

✅ Checkpoint: The version check prints a 3.x version and the unit starts /usr/bin/loki with /etc/loki/config.yml.

2Write the Loki config with filesystem storage and 7-day retention

Paste this whole block on graf01:

sudo tee /etc/loki/config.yml >/dev/null <<'EOF'
auth_enabled: false

server:
  http_listen_port: 3100
  grpc_listen_port: 9096
  log_level: info

common:
  instance_addr: 127.0.0.1
  path_prefix: /var/lib/loki
  storage:
    filesystem:
      chunks_directory: /var/lib/loki/chunks
      rules_directory: /var/lib/loki/rules
  replication_factor: 1
  ring:
    kvstore:
      store: inmemory

schema_config:
  configs:
    - from: 2026-01-01
      store: tsdb
      object_store: filesystem
      schema: v13
      index:
        prefix: index_
        period: 24h

limits_config:
  retention_period: 168h
  reject_old_samples: true
  reject_old_samples_max_age: 168h

compactor:
  working_directory: /var/lib/loki/compactor
  retention_enabled: true
  delete_request_store: filesystem

analytics:
  reporting_enabled: false
EOF
sudo mkdir -p /var/lib/loki && sudo chown -R loki /var/lib/loki
sudo -u loki loki -config.file=/etc/loki/config.yml -verify-config

You should see (your time will differ):

level=info ts=2026-11-08T06:53:31.719913919Z caller=main.go:109 msg="config is valid"

auth_enabled: false means a single tenant (Loki calls it “fake” in messages), fine for one team. Schema v13 with the TSDB index is the current recommended layout, and the from date only has to be in the past. -verify-config checks the file without starting the server, so make it a habit before every restart.

✅ Checkpoint: loki -verify-config prints msg=”config is valid”.

3Start Loki and check it is ready

Run this on graf01:

sudo systemctl enable loki && sudo systemctl restart loki
sleep 20
curl -s localhost:3100/ready; echo
sudo journalctl -u loki --no-pager | grep -E 'Starting Loki|Loki started' | tail -2

You should see (your times will differ):

ready
level=info ts=2026-11-08T05:56:35.354768065Z caller=main.go:146 msg="Starting Loki" version="(version=3.7.9, branch=release-3.7.x, revision=d3b4a2f7)"
level=info ts=2026-11-08T05:56:35.584067572Z caller=loki.go:615 msg="Loki started" startup_time=296.44178ms

For the first 15 seconds /ready answers “Ingester not ready: waiting for 15s after being ready”, which is normal. Loki listens on all addresses on port 3100, so open it to the lab network only, because app01’s Alloy must push to it:

Run this on graf01:

sudo ufw allow from 192.168.56.0/24 to any port 3100 proto tcp
sudo ufw status | grep 3100
3100/tcp                   ALLOW       192.168.56.0/24

✅ Checkpoint: curl localhost:3100/ready answers ready and ufw allows 3100 from 192.168.56.0/24 only.

4Install Alloy on graf01 and app01

app01 doesn’t have the Grafana repository yet, so add it there first; on graf01 it’s already present.

Run this on app01 only (adds the repository):

sudo mkdir -p /etc/apt/keyrings
sudo wget -q -O /etc/apt/keyrings/grafana.asc https://apt.grafana.com/gpg-full.key
sudo chmod 644 /etc/apt/keyrings/grafana.asc
echo "deb [signed-by=/etc/apt/keyrings/grafana.asc] https://apt.grafana.com stable main" | sudo tee /etc/apt/sources.list.d/grafana.list

Then run this on both VMs:

sudo apt-get update && sudo apt-get install -y alloy
alloy --version | head -1
id -nG alloy

The version line starts with alloy, version v1.21.3 (or a later v1.21.x), followed by the branch and Git revision of the build. The group list should read:

alloy adm systemd-journal

The package creates an alloy user and adds it to the adm and systemd-journal groups, because on Ubuntu /var/log/syslog and /var/log/auth.log belong to syslog:adm with mode 640. The service runs alloy run on /etc/alloy/config.alloy, and its UI listens on 127.0.0.1:12345.

✅ Checkpoint: The version check prints v1.21.x on both VMs and id -nG alloy shows the adm group.

5Write config.alloy on app01

The app also needs a log to ship. Create a small JSON log for the shop application first, then the Alloy config.

Paste this whole block on app01:

sudo mkdir -p /var/log/shopapp
sudo tee /var/log/shopapp/app.log >/dev/null <<'EOF'
{"level":"info","msg":"order placed","city":"Jaipur","amount":899,"duration_ms":42}
{"level":"error","msg":"payment gateway timeout","city":"Pune","amount":1299,"duration_ms":5003}
{"level":"info","msg":"order placed","city":"Delhi","amount":349,"duration_ms":38}
EOF
echo 'level=warn msg="slow query" table=orders duration_ms=812' | sudo tee -a /var/log/shopapp/app.log >/dev/null

sudo tee /etc/alloy/config.alloy >/dev/null <<'EOF'
logging {
  level  = "info"
  format = "logfmt"
}

// 1. Find the files to read
local.file_match "system" {
  path_targets = [
    {"__path__" = "/var/log/syslog",   "job" = "varlogs", "host" = "app01"},
    {"__path__" = "/var/log/auth.log", "job" = "varlogs", "host" = "app01"},
  ]
}

local.file_match "shopapp" {
  path_targets = [
    {"__path__" = "/var/log/shopapp/*.log", "job" = "shopapp", "host" = "app01"},
  ]
}

// 2. Tail them
loki.source.file "system" {
  targets    = local.file_match.system.targets
  forward_to = [loki.write.graf01.receiver]
}

loki.source.file "shopapp" {
  targets    = local.file_match.shopapp.targets
  forward_to = [loki.write.graf01.receiver]
}

// 3. Send to Loki on graf01
loki.write "graf01" {
  endpoint {
    url = "http://192.168.56.70:3100/loki/api/v1/push"
  }
}
EOF
alloy fmt /etc/alloy/config.alloy >/dev/null && echo "syntax OK"
sudo systemctl restart alloy && systemctl is-active alloy

You should see:

syntax OK
active

Each block is a component with a type and a label you choose, like loki.write "graf01". Components refer to each other’s exports by those names, local.file_match.system.targets and loki.write.graf01.receiver, which is how the pipeline is wired. alloy fmt parses the file and fails on any syntax error, a quick check before every restart; Alloy itself adds the filename label for each file it tails.

✅ Checkpoint: alloy fmt reports syntax OK and the alloy service is active on app01.

6Ship graf01’s own logs and open the Alloy UI

Run this on graf01:

sudo tee /etc/alloy/config.alloy >/dev/null <<'EOF'
logging {
  level  = "info"
  format = "logfmt"
}

local.file_match "system" {
  path_targets = [
    {"__path__" = "/var/log/syslog",   "job" = "varlogs", "host" = "graf01"},
    {"__path__" = "/var/log/auth.log", "job" = "varlogs", "host" = "graf01"},
  ]
}

loki.source.file "system" {
  targets    = local.file_match.system.targets
  forward_to = [loki.write.local.receiver]
}

loki.write "local" {
  endpoint {
    url = "http://localhost:3100/loki/api/v1/push"
  }
}
EOF
sudo systemctl restart alloy
curl -s localhost:12345/-/ready; echo

You should see:

Alloy is ready.

The Alloy UI listens only on 127.0.0.1, so reach it from your laptop with an SSH tunnel: ssh -L 12345:127.0.0.1:12345 student@192.168.56.71 and browse to http://localhost:12345. The home page lists each component with its health, and the Graph page draws the pipeline you wrote; open loki.source.file.shopapp to see the tailed path and its read offset.

Grafana Loki and Alloy: the Alloy UI component list on app01 with every component healthy
The Alloy UI on app01, opened through the SSH tunnel at http://localhost:12345: all five components from config.alloy report healthy. Click View on one to see its arguments, or Graph for the pipeline.

✅ Checkpoint: /-/ready on graf01 answers “Alloy is ready.” and the Alloy UI on app01 shows all components healthy.

7Check the labels arriving in Loki

Run this on graf01:

curl -s localhost:3100/loki/api/v1/labels; echo
curl -s localhost:3100/loki/api/v1/label/job/values; echo
curl -s localhost:3100/loki/api/v1/label/host/values; echo

You should see:

{"status":"success","data":["filename","host","job","service_name"]}
{"status":"success","data":["shopapp","varlogs"]}
{"status":"success","data":["app01","graf01"]}

You set job and host, Alloy added filename, and Loki 3 adds service_name by itself (it copies job when no service label exists), which Grafana’s Logs Drilldown app uses. Four label names and a handful of values: this is what healthy cardinality looks like.

✅ Checkpoint: The labels API lists filename, host, job and service_name, with jobs shopapp and varlogs and hosts app01 and graf01.

Grafana Loki lab: labels API showing job and host values and Alloy ready check
The labels Loki received from Alloy and the Alloy ready check.

8Add the Loki data source and run your first LogQL in Explore

In Grafana add a data source of type Loki named Loki with URL http://localhost:3100, then Save & test. Open Explore, pick Loki, switch the query editor to Code and run:

{job="varlogs", host="app01"}

You get the newest syslog and auth.log lines from app01, with a bar chart of log volume above them. Click a line to see its labels. Now generate a failed login and find it: from your laptop run ssh hacker@192.168.56.71 (a user that doesn’t exist on app01) and press Enter at the password prompt twice, then query:

{job="varlogs", host="app01"} |= "Failed password"
Grafana Loki in Explore: Failed password lines from app01 found with a LogQL line filter
Explore with the Loki data source: the line filter |= “Failed password” finds your failed SSH logins on app01, and the logs volume bar shows when they happened.

The same query from graf01 with curl:

curl -s -G localhost:3100/loki/api/v1/query_range \
  --data-urlencode 'query={job="varlogs", host="app01"} |= "Failed password"' \
  --data-urlencode 'since=15m' --data-urlencode 'limit=5' | python3 -m json.tool | grep -A2 '"values"'

You should see (your timestamps, PID and port will differ):

                "values": [
                    [
                        "1794120700787705223",
                        "2026-11-08T07:10:02.118042+00:00 app01 sshd-session[1240]: Failed password for invalid user hacker from 192.168.56.1 port 50130 ssh2"

On Ubuntu 26.04 the OpenSSH 10 login process is called sshd-session; on 24.04 the same line says sshd[1240].

✅ Checkpoint: Explore shows app01 log lines, and the Failed password filter returns your failed SSH attempt.

9Line filters and parsers

Try each query in Explore against the last 15 minutes. These are the forms you’ll use every day:

QueryWhat it does
{job=”varlogs”} != “CRON”Drops every line containing CRON
{job=”varlogs”} |~ “(?i)failed|error”Regex match, case-insensitive
{job=”shopapp”} | json | level=”error”Parses JSON, keeps lines where the extracted level is error
{job=”shopapp”} | json | duration_ms > 1000 | line_format “{{.city}} {{.msg}} {{.duration_ms}}ms”Numeric filter on an extracted field, then rewrites the line
{job=”shopapp”} | logfmt | level=”warn”Parses key=value lines
{job=”varlogs”} | pattern “<_> <_> <proc>[<pid>]: <msg>” | proc=”sshd-session”Pulls fields out of plain text by position (use proc=”sshd” on 24.04)

Check the JSON parser from graf01:

curl -s -G localhost:3100/loki/api/v1/query_range \
  --data-urlencode 'query={job="shopapp"} | json | duration_ms > 1000 | line_format "{{.city}} {{.msg}} {{.duration_ms}}ms"' \
  --data-urlencode 'since=1h' | python3 -m json.tool | grep -A1 '"values"' | tail -1

You should see (your timestamp will differ):

                    "1794120702987705223", "Pune payment gateway timeout 5003ms"

Order matters for speed: put the stream selector first, then cheap line filters like |=, and only then the parser, so Loki parses only the lines that survived the filter. Parsed fields are labels for that query only; they don’t create streams in the database.

✅ Checkpoint: The json, logfmt and pattern queries all return results, and the duration filter returns only the Pune timeout.

10Check retention is active and take a snapshot

Run this on graf01:

curl -s localhost:3100/config | grep -E '^\s+(retention_period|retention_enabled|reject_old_samples_max_age):'
sudo du -sh /var/lib/loki

You should see (the size will differ):

  retention_enabled: true
  reject_old_samples_max_age: 1w
  retention_period: 1w
  retention_period: 0s
1.6M	/var/lib/loki

The /config endpoint shows the settings Loki loaded, with 168h printed as 1w; the extra retention_period: 0s line belongs to the separate table manager section and doesn’t matter here. Shut down both VMs and take a snapshot called loki-alloy; Lesson 8 builds on it with Nginx logs.

✅ Checkpoint: /config shows retention_enabled true and retention_period 1w, and both VMs have a loki-alloy snapshot.

Break It, Then Fix It

Three failures you’ll meet in real log pipelines. The first two use curl to push hand-made entries straight to Loki on graf01, so they’re quick and safe.

1Entries too old or too far behind

Push one line dated nine days ago, then one line three hours behind the newest entry of the same stream:

Run this on graf01:

OLD=$(( ($(date +%s) - 9*24*3600) * 1000000000 ))
curl -s -w ' HTTP %{http_code}\n' -H 'Content-Type: application/json' localhost:3100/loki/api/v1/push \
  --data-raw '{"streams":[{"stream":{"job":"varlogs","host":"app01","filename":"/var/log/syslog"},"values":[["'$OLD'","old line from last week"]]}]}'
BEHIND=$(( ($(date +%s) - 3*3600) * 1000000000 ))
curl -s -w ' HTTP %{http_code}\n' -H 'Content-Type: application/json' localhost:3100/loki/api/v1/push \
  --data-raw '{"streams":[{"stream":{"job":"varlogs","host":"app01","filename":"/var/log/syslog"},"values":[["'$BEHIND'","line from three hours ago"]]}]}'

You’ll get these errors:

entry for stream '{filename="/var/log/syslog", host="app01", job="varlogs", service_name="varlogs"}' has timestamp too old: 2026-10-30T06:50:31Z, oldest acceptable timestamp is: 2026-11-01T06:50:31Z
 HTTP 400
entry with timestamp 2026-11-08 03:50:37 +0000 UTC ignored, reason: 'entry too far behind, entry timestamp is: 2026-11-08T03:50:37Z, oldest acceptable timestamp is: 2026-11-08T05:50:30Z',
user 'fake', total ignored: 1 out of 1 for stream: {filename="/var/log/syslog", host="app01", job="varlogs", service_name="varlogs"}
 HTTP 400

The first is reject_old_samples_max_age (7 days here). The second is the out-of-order window: within one stream Loki accepts entries up to one hour (half the default max_chunk_age of 2h) older than the newest it has seen. In real life you see both when an agent catches up on a big old file, when a parsing stage sets timestamps from the line and the server clock was wrong, or when two agents write to the same stream.

Fix: don’t send stale lines, or give the backlog its own stream:

# in Alloy, skip old rotated files instead of replaying them
local.file_match "system" {
  path_targets      = [ ... ]
  ignore_older_than = "24h"
}
# in Loki, only if you truly need older data accepted:
#   limits_config: reject_old_samples_max_age: 336h

✅ Checkpoint: You can explain both messages, and a current-time push to the same stream returns HTTP 204.

2Too many streams from a bad label

A developer asks you to add request_id as a label “so we can search faster”. Simulate it with a low stream limit: add max_global_streams_per_user: 20 under limits_config in /etc/loki/config.yml, restart Loki and push 25 lines with a different request_id each.

Run this on graf01:

for i in $(seq 1 25); do
  NOW=$(date +%s%N)
  curl -s -o /tmp/push.out -w '%{http_code}' -H 'Content-Type: application/json' localhost:3100/loki/api/v1/push \
    --data-raw '{"streams":[{"stream":{"job":"shopapp","host":"app01","request_id":"req-'$i'"},"values":[["'$NOW'","order '$i'"]]}]}' | grep -q 204 || { echo "push $i:"; cat /tmp/push.out; }
done | tail -2

You’ll get this error (HTTP 429):

push 25:
maximum active stream limit exceeded when trying to create stream {host="app01", job="shopapp", request_id="req-25", service_name="shopapp"}, reduce the number of active streams (reduce labels or reduce label values), or contact your Loki administrator to see if the limit can be increased, user: 'fake'

Each request ID made a new stream, and the limit stopped it (in the lab at about 20, in real life at the default 5000, after a lot of memory has already been spent). Alloy keeps retrying a 429, so the backlog also grows on the agent side. Searching by request ID never needed a label: {job="shopapp"} |= "req-17" finds it by scanning one stream.

Fix: remove the label from the agent config and put the default limit back:

sudo sed -i '/max_global_streams_per_user: 20/d' /etc/loki/config.yml
sudo -u loki loki -config.file=/etc/loki/config.yml -verify-config && sudo systemctl restart loki

✅ Checkpoint: The limit line is gone, Loki restarted with config is valid, and request IDs are searched with |= instead of a label.

3Alloy cannot read the log file

On a hardened server the image build often removes service accounts from adm. Do the same on app01 and restart Alloy:

Run this on app01:

sudo gpasswd -d alloy adm
sudo systemctl restart alloy
sleep 5
sudo journalctl -u alloy --no-pager | grep -i 'permission denied' | tail -2

You’ll get this error:

ts=2026-11-08T07:31:12.402Z level=error msg="failed to run tailer" component_path=/ component_id=loki.source.file.system error="failed to tail the file: open /var/log/syslog: permission denied"
ts=2026-11-08T07:31:12.403Z level=error msg="failed to run tailer" component_path=/ component_id=loki.source.file.system error="failed to tail the file: open /var/log/auth.log: permission denied"

/var/log/syslog is -rw-r----- syslog adm, so only root, syslog and members of adm can read it. The shopapp log still works because the files you created are world-readable, which is why “some logs arrive and some don’t” is the classic symptom. Explore shows nothing new for {job="varlogs", host="app01"} after the restart.

Fix: give the alloy user read access through the adm group again:

ls -l /var/log/syslog
sudo usermod -aG adm alloy
sudo systemctl restart alloy
sudo -u alloy head -c 80 /var/log/syslog; echo
-rw-r----- 1 syslog adm 412377 Nov  8 07:31 /var/log/syslog
2026-11-08T07:32:01.551203+00:00 app01 systemd[1]: Started alloy.service - Vendor

Group changes only apply to new processes, so the restart is needed. Avoid running Alloy as root or making logs world-readable to “fix” this; group membership or a targeted ACL (setfacl -m u:alloy:r) is the safe answer.

✅ Checkpoint: sudo -u alloy can read /var/log/syslog, the journal has no new permission errors, and app01 syslog lines appear in Explore again.

This happened at work

The UPI outage nobody could find in the logs

My team lead was on call at a payments company in Pune the night this happened. Around 10:40 pm the support team reported UPI payments failing for some customers, and the first thing he did was open the payments dashboard’s log panel, which showed nothing unusual for the payment service. Ten minutes went into checking the database and the bank gateway, both healthy.

Then someone noticed the log volume graph for the payment pods was flat since 9:15 pm. Loki was up, Grafana was fine, and the agent on those servers was running, so it looked like the service had gone quiet. One look at the agent’s own log showed thousands of HTTP 429 errors: “maximum active stream limit exceeded”.

That afternoon a developer had added the customer’s transaction ID as a label to make searching easier. Every payment created a new stream, the tenant hit its stream limit within hours, and from then on Loki refused new streams, including the ones carrying the error messages they needed.

They rolled back the label change, raised the limit temporarily so the agent’s backlog could drain, and found the real problem (an expired certificate on one gateway node) within minutes once logs flowed again. The team then added a Loki alert on loki_discarded_samples_total by reason and a review rule: any new label needs a guess at how many values it will have, written in the pull request.

Common mistakes and troubleshooting

MistakeWhat happensWhat to do instead
Using IDs, IPs or URL paths as labelsStream count explodes, memory grows and Loki returns 429 stream limit errorsKeep them in the line and search with |= or a parser
Starting a query with a filter, not a selectorparse error: unexpected IDENTIFIER or “queries require at least one regexp or equality matcher”Always begin with {label=”value”}, and avoid {} or label=~”.*”
Parsing before filteringSlow queries that parse every line in the rangePut |= or |~ line filters before | json or | logfmt
Running Alloy as root to read /var/logWorks, but a bug in the agent can touch anythingKeep the alloy user and add it to adm or use ACLs
Enabling retention without delete_request_storeLoki refuses to start: compactor.delete-request-store should be configuredSet delete_request_store: filesystem with retention_enabled: true
Exposing Loki 3100 to everyoneAnyone can push or read logs, there is no auth with auth_enabled: falseAllow 3100 only from agent hosts, or put an authenticating proxy in front
Still installing Promtail from old tutorialsNo security fixes since March 2026Install Alloy and convert old configs with alloy convert

Interview questions

Click a question to open it. Each one is written the way an interviewer would ask it. Under it you will see why they ask it and one way you could answer, in your own words.

Fresher level

1. What is the difference between Loki and Elasticsearch for logs?

Why they ask this: They want the indexing trade-off in plain words.

How you might answer: Elasticsearch builds a full-text index of every word in every log line, which makes full-text search fast but costs a lot of storage and memory. Loki indexes only a few labels per stream, like job and host, and stores the lines compressed, then scans them at query time.

So Loki is much cheaper to run, and queries are fast when you narrow by labels first, but searching all logs for one word over a long range is slower.

2. What do Alloy, Loki and Grafana each do in a log pipeline?

Why they ask this: A basic architecture check.

How you might answer: Alloy runs on each server, tails log files, adds labels and pushes batches to Loki. Loki stores the lines and answers LogQL queries, and Grafana is where people run those queries in Explore or show them in dashboards and alerts.

2–5 years experience

3. Walk me through writing a LogQL query to find payment errors in a JSON application log.

Why they ask this: They want selector, filter, parser and label filter in the right order.

How you might answer: I start with the stream selector, for example {job=”shopapp”, host=”app01″}, then a cheap line filter like |= “payment” so Loki only parses relevant lines. Then | json to extract fields and | level=”error” to keep errors, and maybe | duration_ms > 1000 for slow ones.

If I want a cleaner view I add line_format “{{.city}} {{.msg}}”. Order matters for speed, selector first, filters before parsers.

4. Alloy is running but logs from /var/log/syslog never reach Loki. How do you troubleshoot?

Why they ask this: A practical debugging walk-through.

How you might answer: First I look at the Alloy UI on 127.0.0.1:12345 to see the component health and whether the file is being tailed, then journalctl -u alloy for errors. A common one is “open /var/log/syslog: permission denied”, because the file is syslog:adm 640 and the alloy user isn’t in adm.

If tailing works I check loki.write errors such as 400 too old or 429 stream limit, and finally query Loki’s labels API to see whether the expected job and host labels exist.

Senior level

5. A team wants to add user_id as a Loki label for faster lookups. How do you respond?

Why they ask this: They’re testing your understanding of cardinality and your ability to say no with an alternative.

How you might answer: I’d explain that every distinct label value creates a new stream with its own chunks and index entries, so user_id would create one stream per user and hit the stream limit or blow up memory. Lookups by user ID work fine as a line filter or parser on a stream selected by job and host.

If they need very frequent lookups, structured metadata or recording the user ID in the line with a good pattern is the right tool, and I’d add an alert on discarded samples so mistakes show up early.

6. How would you size and protect a single-node Loki for 50 servers?

Why they ask this: They want retention, storage, limits and safety thinking.

How you might answer: I’d estimate daily log volume first, then set retention_period with the compactor enabled and keep filesystem storage on a separate disk with headroom, or move to object storage like S3 or MinIO when it grows. Limits like ingestion_rate_mb, max_global_streams_per_user and reject_old_samples protect it from one noisy agent.

Loki has no auth when auth_enabled is false, so I’d restrict port 3100 to agent hosts and Grafana, monitor Loki’s own metrics and alert on discarded samples and ingestion errors.

Quick quiz

Q1. What does Loki index?

  1. Every word in every line
  2. Only the labels of each stream
  3. Nothing at all
  4. Only timestamps
Show answer

B — Loki indexes labels; line content is scanned at query time.

Q2. Which LogQL is valid?

  1. job=”varlogs”
  2. {job=”varlogs”} |= “error”
  3. |= “error” {job=”varlogs”}
  4. {} |= “error”
Show answer

B — A query must start with a stream selector that has at least one non-empty matcher.

Q3. Alloy logs “open /var/log/syslog: permission denied”. What is the usual fix on Ubuntu?

  1. Run Alloy as root
  2. chmod 777 /var/log
  3. Add the alloy user to the adm group and restart Alloy
  4. Reinstall Loki
Show answer

C — syslog is root-readable and adm-readable only; group membership is the safe fix.

Q4. Why is request_id a bad label?

  1. Labels must be numbers
  2. Each value creates a new stream and cardinality explodes
  3. Loki cannot store strings
  4. It is a reserved word
Show answer

B — High-cardinality labels create too many streams.

Q5. What happened to Promtail?

  1. It became the default agent
  2. It reached end of life on 2 March 2026; use Alloy
  3. It was renamed to Loki
  4. It only runs on Windows now
Show answer

B — Grafana Alloy is the supported agent.

Quick recap

  • Loki stores log lines in streams identified by labels and indexes only those labels, so keep labels few and low-cardinality.
  • Loki on graf01 runs from /etc/loki/config.yml with filesystem storage, schema v13 and 7-day retention through the compactor.
  • Alloy on both VMs uses local.file_match, loki.source.file and loki.write; the UI on 127.0.0.1:12345 shows component health.
  • LogQL starts with a stream selector, then line filters (|=, !=, |~), then parsers (json, logfmt, pattern) and label filters.
  • Too old or too far behind, 429 stream limits and permission denied on /var/log are the three ingestion failures to recognise.

Next lesson

Lesson 8: Nginx logs, LogQL metrics and annotations → You ship Nginx access logs from app01, parse them in Alloy, turn them into request rate and 5xx graphs with LogQL metric queries and mark incidents with log annotations.

Further reading: Grafana Loki

Want to go deeper into Grafana Loki? The official docs on Loki labels and cardinality, LogQL, retention and loki.source.file in Alloy go deeper into each part, and the Promtail migration guide helps with older setups. On SaatVedha, Lesson 4 covers the Grafana side of data sources, and the Linux administration course explains file permissions and groups used in the Break It section.

You can also see the full plan for this course on the Grafana Dashboards and Observability course page.

Scroll to Top

This website uses cookies

We use a few cookies to keep this site working. If you allow it, we also use Google Analytics to count visits so we can improve our lessons. You can accept all, deny the optional ones, or choose what to allow.