Nginx logs, LogQL metrics and annotations

Most people first put Nginx logs in Grafana to read them, and soon they want graphs instead: how many requests per second, how many 500 errors, which pages are slow or missing. In this lesson you install Nginx on app01 as a small exam portal and add an Alloy pipeline that drops health checks, parses every access log line and attaches a status label. Then you turn the lines into numbers with LogQL metric queries and build an “Nginx app01” dashboard.

On top of that dashboard you’ll draw deploy markers from a log file with a Loki annotation, so a jump in errors sits right next to the release that caused it. The break labs cover the three problems that bite people with web logs: a parser that quietly stops matching, a label that explodes the stream count, and annotations that never show up because of a timestamp mistake.

Where this lesson fits

Lesson 8 of 14 in Grafana Dashboards and Observability · Phase 2: Data sources, logs and metrics · Before this: Lesson 7, Loki and Alloy · Next: Lesson 9, Node Exporter dashboards

TimeYou needBy the end you can
About 90 minutesgraf01 and app01 from Lesson 7 (Loki on graf01, Alloy on both VMs, Loki data source in Grafana)Ship and parse Nginx access logs with Alloy, graph request rate and 5xx errors with LogQL, and mark deploys on a dashboard

What it is, in one line

Alloy reads each Nginx access log line, pulls out fields such as the status code, and sends it to Loki, where LogQL metric queries count those lines over time so Grafana can graph traffic and errors from logs alone.

In Simple Words

The register at the exam centre gate

At a Delhi exam centre, a guard at the gate writes one line in a register for every person who walks in: time, roll number, which hall, and whether they were let in or sent back. Nobody reads the whole register line by line. At 10 am the centre in-charge asks two questions: “how many came in during the last 15 minutes?” and “how many were sent back?”

The guard runs his finger down the “sent back” column and counts the ticks for that quarter of an hour. He doesn’t copy roll numbers onto the cover of the register, because then the cover would be full of numbers and useless for sorting.

Nginx is the guard writing the register, Alloy reads each line and notes the status column, and LogQL does the counting by time slot.

Engineer's View

What happens to one access log line

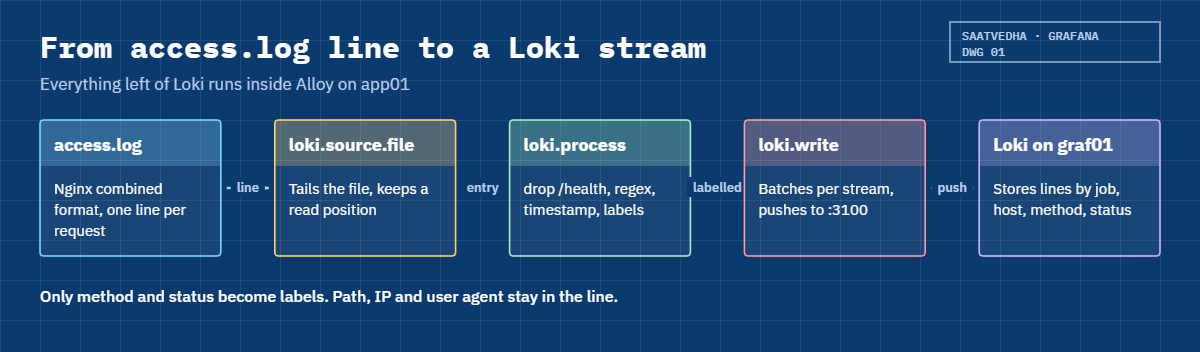
Ubuntu’s Nginx writes access logs in the predefined combined format: client address, remote user, local time in brackets, the request line in quotes, status, body bytes, referrer and user agent. Alloy’s loki.source.file tails /var/log/nginx/access.log and hands each line to loki.process, which runs stages in the order you write them.

StageWhat it does hereWhy
stage.dropThrows away lines that match “GET /health “Load balancer checks every few seconds add noise and cost, never insight
stage.regexNamed groups pull method, path, status and time_local into the extracted mapThe extracted map is scratch space; nothing there is stored as a label yet
stage.timestampUses time_local as the entry timeGrafana shows when the request happened, not when Alloy read it
stage.labelsPromotes method and status to labelsBoth have a handful of values, so they make cheap, fast stream selectors
stage.static_labelsAdds env=”lab”Same value for every line, so it never adds a stream

Every unique set of labels is a separate stream in Loki. With job, host, filename, env, method and status you get maybe 10 to 20 streams for this server. Put the URL path or client IP into labels and you get thousands, which Loki punishes with memory use, slow queries and finally rejected pushes.

High-cardinality fields stay inside the line and get parsed at query time with | pattern or | regexp.

LogQL has two kinds of query. A log query returns lines. A metric query wraps a log query in a range aggregation such as count_over_time(...[5m]) or rate(...[5m]) and returns numbers, which you can then group with sum by (status) or rank with topk, the same way you would in PromQL.

How it works, step by step

1Nginx writes, Alloy tails

Nginx appends a line to /var/log/nginx/access.log when each request finishes. Alloy keeps the file open, reads new lines as they arrive, and remembers the byte offset in its positions file, so after a restart it carries on where it stopped. Logrotate renames the file every day on Ubuntu, and Alloy notices the new file and follows it.

From there the line passes through the stages of loki.process and on to loki.write, which batches lines per stream and pushes them to Loki on graf01. The diagram shows the whole path, and the important point is that labels are decided on app01, before Loki ever sees the line.

Nginx logs in Grafana: access.log through loki.source.file, loki.process and loki.write to Loki

2Stages share an extracted map

Parsing stages (regex, pattern, json, logfmt) write values into a temporary key-value map for that one line. Later stages read from it: stage.timestamp reads time_local, stage.labels reads status. Anything you don’t promote is thrown away when the line leaves the pipeline, but the original text is kept, so you can always parse it again in a query.

If the regex doesn’t match a line, nothing is extracted and nothing fails loudly. The line still goes to Loki, only without the status label, which is why Break 1 is so sneaky.

3Metric queries turn lines into numbers

A metric query is built in layers. The stream selector picks streams by label, optional filters and parsers narrow the lines, a range aggregation counts or rates them per window, and an outer aggregation groups the result. The diagram below shows the layers for “requests per second by status”.

sum by (status) (rate({job="nginx", host="app01"}[5m]))

Read it inside out: take all nginx lines from app01, compute the per-second rate over each 5 minute window for every stream, then add the streams up per status value.

Nginx logs in Grafana: layers of a LogQL metric query from stream selector to panel

4Annotations come from log lines too

A Loki annotation query is a log query. Grafana runs it over the dashboard time range and draws a marker for each returned line at that line’s timestamp, using the line text (or a template you write) as the tooltip. So the marker sits where the entry’s timestamp says it happened, and a wrong timestamp means a marker in the wrong place, or no marker at all.

QueryReturnsUse it for
{job=”nginx”} |= “/api/submit”Log linesLogs panel, Explore, annotations
count_over_time({job=”nginx”}[1m])Number of lines per stream per minuteRaw volume
sum by (status) (rate({job=”nginx”}[5m]))Requests per second per statusTraffic graph
topk(5, sum by (path) (count_over_time({job=”nginx”} | regexp `…` [$__auto])))Top paths by countBar gauge or table
sum(rate({job=”nginx”, status=~”5..”}[5m]))5xx per secondError stat and alerts

Hands-on lab: ship, parse and graph Nginx logs from app01 with Alloy and LogQL

Before you run any command, double-check it

Read every command twice before you press Enter. Check the target: the server name, the user, the disk or device name, the path and the sizes. These commands are for learning and were tested in our lab, not on your system. At work, run the read-only commands first, follow your change process, make sure a backup exists, and ask a second person to check anything that changes or deletes data. You run them at your own risk.

You’ll build a tiny exam portal on app01 (192.168.56.71), ship its access log through a new Alloy pipeline to Loki on graf01 (192.168.56.70), then build the dashboard in Grafana at https://graf01.lab/. The Alloy config from Lesson 7 stays as it is; you add new blocks to it.

1Install Nginx on app01 as the exam portal

Paste this whole block on app01:

sudo apt update && sudo apt install -y nginx
sudo mkdir -p /var/www/exam/exam /var/www/exam/results
echo '<h1>SaatVedha exam portal</h1>' | sudo tee /var/www/exam/index.html >/dev/null
echo 'Exam started'  | sudo tee /var/www/exam/exam/start >/dev/null
echo 'Results page'  | sudo tee /var/www/exam/results/index.html >/dev/null

sudo tee /etc/nginx/sites-available/exam >/dev/null <<'EOF'
server {
    listen 80 default_server;
    server_name app01.lab;
    root /var/www/exam;

    location = /health     { return 200 "ok\n"; }
    location = /api/submit { return 500; }
    location /             { try_files $uri $uri/ =404; }
}
EOF
sudo rm -f /etc/nginx/sites-enabled/default
sudo ln -s /etc/nginx/sites-available/exam /etc/nginx/sites-enabled/exam
sudo nginx -t && sudo systemctl reload nginx
sudo ufw allow from 192.168.56.0/24 to any port 80 proto tcp

The last lines of the output are:

nginx: the configuration file /etc/nginx/nginx.conf syntax is ok
nginx: configuration file /etc/nginx/nginx.conf test is successful
Rule added

/api/submit always returns 500, so you have a reliable “broken” page to graph. The ufw rule lets graf01 and your laptop reach port 80; app01 still allows 9100 and 3306 only from graf01, as before.

✅ Checkpoint: nginx -t is successful and ufw shows port 80 allowed from 192.168.56.0/24 on app01.

2Read a few access log lines

Run this on graf01, then the tail on app01:

for p in / /exam/start /results/ /nope /api/submit /health; do
  curl -s -o /dev/null -w "%{http_code} $p\n" http://app01$p
done
# on app01:
sudo tail -n 6 /var/log/nginx/access.log

You should see this (your times and curl version will differ):

200 /
200 /exam/start
200 /results/
404 /nope
500 /api/submit
200 /health

192.168.56.70 - - [08/Nov/2026:09:42:16 +0000] "GET / HTTP/1.1" 200 31 "-" "curl/8.5.0"
192.168.56.70 - - [08/Nov/2026:09:42:16 +0000] "GET /exam/start HTTP/1.1" 200 13 "-" "curl/8.5.0"
192.168.56.70 - - [08/Nov/2026:09:42:16 +0000] "GET /results/ HTTP/1.1" 200 13 "-" "curl/8.5.0"
192.168.56.70 - - [08/Nov/2026:09:42:16 +0000] "GET /nope HTTP/1.1" 404 162 "-" "curl/8.5.0"
192.168.56.70 - - [08/Nov/2026:09:42:16 +0000] "GET /api/submit HTTP/1.1" 500 186 "-" "curl/8.5.0"
192.168.56.70 - - [08/Nov/2026:09:42:16 +0000] "GET /health HTTP/1.1" 200 3 "-" "curl/8.5.0"

This is the combined format. The time in brackets is the server’s local time with its offset (+0000 because Ubuntu Server defaults to UTC), the request line sits in the first pair of quotes, and the status follows it. Your curl version and byte counts may differ.

✅ Checkpoint: access.log on app01 shows lines with 200, 404 and 500 status codes.

3Add the Nginx pipeline to Alloy on app01

Append these blocks to the end of /etc/alloy/config.alloy. They reuse the loki.write "graf01" component from Lesson 7, so nothing else changes. Inside Alloy strings a backslash must be doubled, which is why the regex has \\S instead of \S.

Paste this whole block on app01:

sudo tee -a /etc/alloy/config.alloy >/dev/null <<'EOF'

// ---- Nginx access log (Lesson 8) ----
local.file_match "nginx" {
  path_targets = [
    {"__path__" = "/var/log/nginx/access.log", "job" = "nginx", "host" = "app01"},
  ]
}

loki.source.file "nginx" {
  targets    = local.file_match.nginx.targets
  forward_to = [loki.process.nginx.receiver]
}

loki.process "nginx" {
  // 1. throw away load balancer health checks
  stage.drop {
    expression          = "\"GET /health "
    drop_counter_reason = "healthcheck"
  }

  // 2. parse the combined format into the extracted map
  stage.regex {
    expression = "^(?P<remote_addr>\\S+) \\S+ (?P<remote_user>\\S+) \\[(?P<time_local>[^\\]]+)\\] \"(?P<method>\\S+) (?P<path>[^ ?\"]+)\\S* (?P<protocol>[^\"]+)\" (?P<status>\\d{3}) (?P<bytes>\\d+) \"(?P<referer>[^\"]*)\" \"(?P<user_agent>[^\"]*)\"$"
  }

  // 3. use the request time, not the read time
  stage.timestamp {
    source = "time_local"
    format = "02/Jan/2006:15:04:05 -0700"
  }

  // 4. only low-cardinality fields become labels
  stage.labels {
    values = { method = "", status = "" }
  }

  stage.static_labels {
    values = { env = "lab" }
  }

  forward_to = [loki.write.graf01.receiver]
}
EOF
alloy fmt /etc/alloy/config.alloy >/dev/null && echo "syntax OK"
sudo systemctl restart alloy && systemctl is-active alloy

You should see:

syntax OK
active

The format string 02/Jan/2006:15:04:05 -0700 is Go’s way of describing a layout: you write the reference date (2 January 2006, 15:04:05, zone -0700) the way your log writes dates. Note that path is extracted but not made a label; it’s there for the drop stage to ignore and for you to see in the Alloy UI’s live debugging, and you’ll parse it again at query time.

✅ Checkpoint: alloy fmt reports syntax OK and alloy is active on app01.

4Generate exam-day traffic from graf01

A small script sends a realistic mix: mostly normal pages, a few missing pages, some failing submits and a health check every second, the way a load balancer would.

Paste this whole block on graf01:

cat > ~/exam-traffic.sh <<'EOF'
#!/bin/bash
# usage: ./exam-traffic.sh [seconds]   (default 600)
end=$((SECONDS + ${1:-600}))
pages=(/ / / /exam/start /exam/start /results/ /results/ /nope /api/submit)
while [ $SECONDS -lt $end ]; do
  for i in 1 2 3 4 5; do
    p=${pages[$RANDOM % ${#pages[@]}]}
    curl -s -o /dev/null "http://app01$p"
  done
  curl -s -o /dev/null http://app01/health
  sleep 1
done
EOF
chmod +x ~/exam-traffic.sh
nohup ~/exam-traffic.sh 1800 >/dev/null 2>&1 &
echo "traffic running as PID $!"

You should see this (your PID will differ):

traffic running as PID 4127

That’s about five page requests and one health check per second for 30 minutes. Leave it running while you do the next steps; run it again later whenever a graph looks empty.

✅ Checkpoint: The traffic script is running on graf01 and app01’s access.log is growing (sudo tail -f shows new lines).

5Check the labels and the dropped health checks in Loki

Run this on graf01:

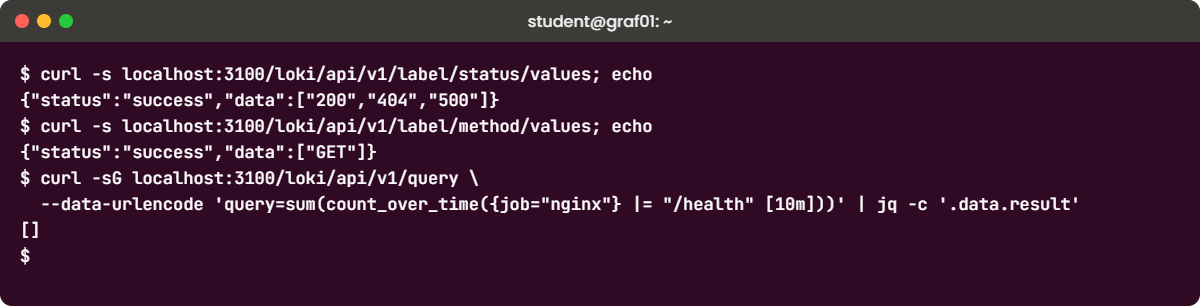
curl -s localhost:3100/loki/api/v1/label/status/values; echo
curl -s localhost:3100/loki/api/v1/label/method/values; echo
sudo apt install -y jq
curl -sG localhost:3100/loki/api/v1/query \
  --data-urlencode 'query=sum(count_over_time({job="nginx"} |= "/health" [10m]))' | jq -c '.data.result'

You should see:

{"status":"success","data":["200","404","500"]}
{"status":"success","data":["GET"]}
[]

The first two calls show the status and method values Alloy attached (Loki also adds a service_name label by itself, taken from job). Query responses carry a large stats block, so jq keeps only the result. The third asks for health check lines in the last 10 minutes and gets an empty result, because the drop stage removed them on app01 before they were ever sent.

On app01, curl -s localhost:12345/metrics | grep dropped_lines shows the counter loki_process_dropped_lines_total{reason="healthcheck"} going up.

✅ Checkpoint: Loki lists status values 200, 404 and 500, and the /health query returns an empty result.
Nginx logs in Grafana: Loki label values for status and method, and no health check lines
Lab output: the status and method labels Alloy attached, and an empty result for /health lines

6Write LogQL metric queries in Explore

In Grafana open Explore, pick the Loki data source, switch the editor to Code and set the time range to the last 15 minutes. Run these one by one and look at the graph each time.

Paste each query into Explore:

# lines per minute, one series per stream
count_over_time({job="nginx", host="app01"}[1m])

# requests per second by status
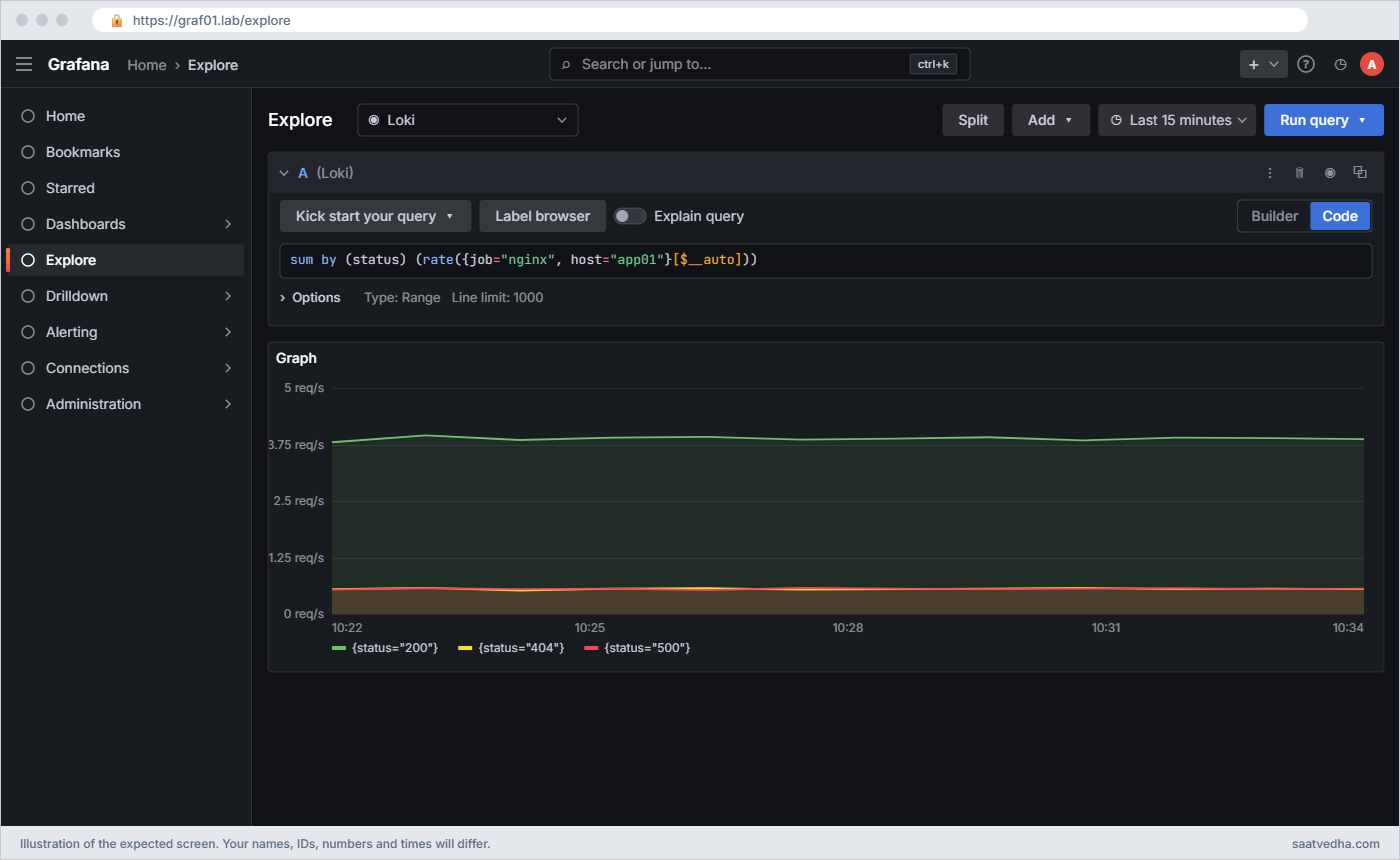
sum by (status) (rate({job="nginx", host="app01"}[$__auto]))

# 5xx per second
sum(rate({job="nginx", host="app01", status=~"5.."}[5m]))

# percentage of requests that failed with 5xx
100 * sum(rate({job="nginx", status=~"5.."}[5m])) / sum(rate({job="nginx"}[5m]))

# top 5 paths, parsed at query time (path is NOT a label)
topk(5, sum by (path) (count_over_time({job="nginx"} | regexp `"\S+ (?P<path>[^ ?"]+)` [$__auto])))

In Table view the status query gives about these values:

status   Value
200      3.89
404      0.556
500      0.556

The script sends 5 requests a second from 9 pages, and 7 of those pages return 200, so about 3.9 per second should be 200s and about 0.56 each should be 404 and 500. The numbers move a little on every refresh because the pages are random.

$__auto lets Grafana pick the range to match the graph’s step, so the graph stays smooth when you zoom out. For the top paths query, set Type to Instant in the query options so you get one number per path instead of a graph.
Nginx logs in Grafana: Explore graph of sum by (status) rate for app01 Nginx lines
Explore with the Loki data source in Code mode: one series per status label, about 3.9 requests a second for 200 and about 0.56 each for 404 and 500.

✅ Checkpoint: The status query shows three series (200, 404, 500) and the topk query lists paths such as /, /exam/start and /api/submit.

7Build the “Nginx app01” dashboard

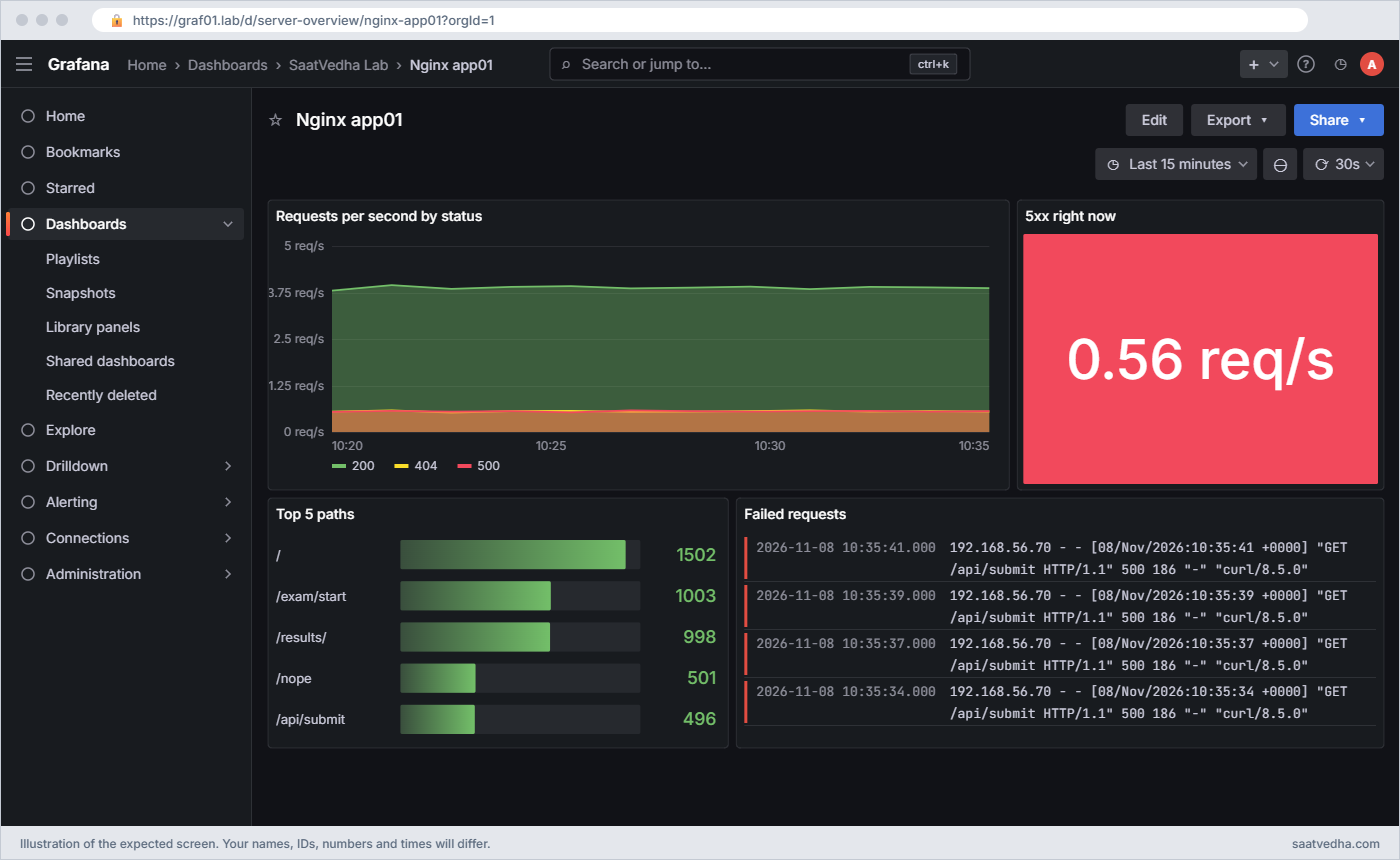
Create a new dashboard, save it as Nginx app01 in the SaatVedha Lab folder, and add these four panels, all on the Loki data source.

PanelVisualisationQuerySettings
Requests per second by statusTime seriessum by (status) (rate({job=”nginx”, host=”app01″}[$__auto]))Legend {{status}}, unit requests/sec (reqps), stack series Normal
5xx right nowStatsum(rate({job=”nginx”, host=”app01″, status=~”5..”}[5m]))Unit reqps, thresholds green base, red at 0.1, colour mode Background
Top 5 pathsBar gaugethe topk query from step 6, Type InstantLegend {{path}}, orientation Horizontal
Failed requestsLogs{job=”nginx”, host=”app01″, status=~”5..”}Time on, Wrap lines on, Order Newest first

The Logs panel matters more than people think. When the 5xx stat goes red, the on-call engineer scrolls down and sees the actual failing lines on the same screen, with client address and user agent, without opening Explore.
Nginx logs in Grafana: Nginx app01 dashboard with status rates, 5xx stat, top paths and failed requests
The Nginx app01 dashboard: requests per second by status, the 5xx stat in red, the top five paths and the failing /api/submit lines.

✅ Checkpoint: Nginx app01 is saved in SaatVedha Lab with four panels that all show data.

8Ship a deploy log for annotations

Releases on app01 will write one logfmt line to /var/log/deploy/deploy.log. Add a second, small pipeline that tails it with job="deploy" and uses the ts field as the timestamp.

Paste this whole block on app01:

sudo mkdir -p /var/log/deploy && sudo touch /var/log/deploy/deploy.log
sudo tee -a /etc/alloy/config.alloy >/dev/null <<'EOF'

// ---- Deploy markers (Lesson 8) ----
local.file_match "deploy" {
  path_targets = [
    {"__path__" = "/var/log/deploy/deploy.log", "job" = "deploy", "host" = "app01"},
  ]
}

loki.source.file "deploy" {
  targets    = local.file_match.deploy.targets
  forward_to = [loki.process.deploy.receiver]
}

loki.process "deploy" {
  stage.logfmt {
    mapping = { ts = "", app = "", version = "" }
  }
  stage.timestamp {
    source = "ts"
    format = "RFC3339"
  }
  forward_to = [loki.write.graf01.receiver]
}
EOF
alloy fmt /etc/alloy/config.alloy >/dev/null && sudo systemctl restart alloy

# a release happens:
echo "ts=$(date -u +%Y-%m-%dT%H:%M:%SZ) level=info msg=deployed app=exam-portal version=v2.4.1" \
  | sudo tee -a /var/log/deploy/deploy.log

tee prints the line back (with your own time):

ts=2026-11-08T10:05:31Z level=info msg=deployed app=exam-portal version=v2.4.1

date -u with a trailing Z gives an unambiguous UTC time, which RFC3339 parsing understands. Remember this choice, because Break 3 shows what happens without it.

✅ Checkpoint: The deploy line is in /var/log/deploy/deploy.log and {job=”deploy”} returns it in Explore.

9Add the annotation query to the dashboard

Open Nginx app01, click Edit, then Settings and the Annotations tab, and click Add annotation query. Fill it in like this and save the dashboard.

FieldValue
NameDeploys
Data sourceLoki
Query{job=”deploy”} |= “deployed” | logfmt
Title{{app}} {{version}}
Tagsapp
Text(leave empty, so the log line is used)

Back on the dashboard, a dashed vertical line now crosses the time series panel at the deploy time, and hovering the small marker at the bottom shows “exam-portal v2.4.1”. Write a second deploy line with a different version a few minutes later and press refresh to see a second marker.

✅ Checkpoint: The time series panel shows a deploy marker with the title exam-portal v2.4.1 at the time of your deploy line.

10Snapshot both VMs

Run this on your laptop (VMs can stay running):

VBoxManage snapshot graf01 take nginx-logs
VBoxManage snapshot app01 take nginx-logs

You should see this (your UUIDs will differ):

0%...10%...20%...30%...40%...50%...60%...70%...80%...90%...100%
Snapshot taken. UUID: 3b8e61f2-5c0d-4f7a-9e21-7d4c0a9b6e13
0%...10%...20%...30%...40%...50%...60%...70%...80%...90%...100%
Snapshot taken. UUID: c41a7d09-2e6b-4b38-8f55-1a9e3d7c2b60

✅ Checkpoint: Both VMs have a snapshot called nginx-logs.

Break It, Then Fix It

All three of these happen in real teams. Run the traffic script again before each one so you have fresh lines to look at.

1The parser quietly stops matching

A developer wants response times in the log and adds $request_time to the end of the Nginx log format. Do the same on app01:

Run this on app01:

sudo tee /etc/nginx/conf.d/timed-log.conf >/dev/null <<'EOF'
log_format timed '$remote_addr - $remote_user [$time_local] "$request" '
                 '$status $body_bytes_sent "$http_referer" "$http_user_agent" $request_time';
EOF
sudo sed -i 's|root /var/www/exam;|root /var/www/exam;\n    access_log /var/log/nginx/access.log timed;|' /etc/nginx/sites-available/exam
sudo nginx -t && sudo systemctl reload nginx
sudo tail -n 1 /var/log/nginx/access.log

You should see this (with your own time):

nginx: the configuration file /etc/nginx/nginx.conf syntax is ok
nginx: configuration file /etc/nginx/nginx.conf test is successful
192.168.56.70 - - [08/Nov/2026:10:21:44 +0000] "GET /exam/start HTTP/1.1" 200 13 "-" "curl/8.5.0" 0.000

Nothing errors anywhere. Nginx is happy, Alloy is healthy, and lines keep arriving in Loki. But the dashboard’s status graph flattens to zero within a few minutes, and in Explore the newest lines come back with only job, host, filename and env labels.

Run this on graf01:

curl -sG localhost:3100/loki/api/v1/query \
  --data-urlencode 'query=sum by (status) (count_over_time({job="nginx"}[2m]))' | jq -c '.data.result[]'

You’ll get this (no status label on new lines):

{"metric":{},"value":[1794131192.813,"238"]}
{"metric":{"status":"200"},"value":[1794131192.813,"185"]}
{"metric":{"status":"404"},"value":[1794131192.813,"26"]}
{"metric":{"status":"500"},"value":[1794131192.813,"29"]}

The regex ends with "$, meaning “the line ends right after the user agent’s closing quote”. Now there’s 0.000 after it, so the regex fails, nothing is extracted, stage.labels has nothing to promote and stage.timestamp falls back to the read time. To Alloy a failed parse isn’t an error, only an empty extracted map.

Fix: make the extra field optional. Open the file on app01:

sudo nano /etc/alloy/config.alloy

Find the stage.regex line and change only its end. It ends like this now:

\"(?P<user_agent>[^\"]*)\"$"

Change it so the end reads like this, then save:

\"(?P<user_agent>[^\"]*)\"(?: (?P<request_time>[0-9.]+))?$"
alloy fmt /etc/alloy/config.alloy >/dev/null && sudo systemctl restart alloy

The same regex now matches both the old and the new format. Before changing a log format at work, agree it with whoever owns the parsing pipeline, and test new lines against the regex first.

✅ Checkpoint: After a minute of traffic, the count by status query shows 200, 404 and 500 again.

2One label explodes the stream count

Someone wants a “per URL” graph and adds path to the labels. On an exam portal the result pages carry the roll number, so every student creates a new path. Simulate it:

Run this on app01, then the loop on graf01:

sudo sed -i 's|values = { method = "", status = "" }|values = { method = "", status = "", path = "" }|' /etc/alloy/config.alloy
sudo systemctl restart alloy
# on graf01: 300 students check their results
for i in $(seq 1 300); do curl -s -o /dev/null http://app01/results/2026DL$((10000+i)); done
curl -sG localhost:3100/loki/api/v1/series --data-urlencode 'match[]={job="nginx"}' \
  --data-urlencode "start=$(date -d '-10 min' +%s)" | jq '.data | length'

You should see:

303

Before the change this count was 3 (one stream per status). Each roll number made a new stream with one or two lines in it. Loki now keeps hundreds of tiny chunks in memory, the index grows, and queries over {job="nginx"} have to open every one of them.

With 50,000 students on result day this is how an ingester runs out of memory or starts answering pushes with 429 “maximum active stream limit exceeded”, the error you saw in Lesson 7.

Fix: remove path from the labels and parse it at query time:

sudo sed -i 's|, path = "" }| }|' /etc/alloy/config.alloy
alloy fmt /etc/alloy/config.alloy >/dev/null && sudo systemctl restart alloy

The old streams age out with retention. For “per URL” numbers use the topk query from step 6, which parses the path from the line only when you ask. A good rule: a label value should come from a short, fixed list (status codes, methods, environments, hosts), never from user input.

✅ Checkpoint: New nginx lines carry only job, host, filename, env, method and status, and the series count stops growing.

3Deploy annotations never appear

The release team’s script writes the deploy time the way people read it, in Indian time, without any zone. Change the pipeline to match their format and write a line:

Run this on app01:

sudo sed -i 's|format = "RFC3339"|format = "2006-01-02 15:04:05"|' /etc/alloy/config.alloy
sudo systemctl restart alloy
echo "ts=\"$(TZ=Asia/Kolkata date '+%F %T')\" level=info msg=deployed app=exam-portal version=v2.4.2" \
  | sudo tee -a /var/log/deploy/deploy.log
sleep 5; sudo journalctl -u alloy --since "1 min ago" | grep -i "too new\|error" | tail -n 2

You’ll get this error (shortened):

level=error msg="final error sending batch, no retries left, dropping data" component_path=/ component_id=loki.write.graf01 component=endpoint host=192.168.56.70:3100 status=400 tenant="" error="server returned HTTP status 400 Bad Request (400): entry for stream '{filename=\"/var/log/deploy/deploy.log\", host=\"app01\", job=\"deploy\", service_name=\"deploy\"}' has timestamp too new: 2026-11-08T15:40:12Z"

No marker appears on the dashboard. The line says 15:40:12 in IST, the format has no zone, so Alloy reads it as 15:40 UTC, which is five and a half hours in the future. Loki refuses entries more than creation_grace_period (10 minutes by default) ahead of its clock, so the line never lands and Grafana has nothing to draw.

If the error were the other way (a UTC time read as IST) the marker would land five and a half hours in the past, off the left edge of a “last 1 hour” view.

Fix: tell Alloy which zone the field is in:

sudo sed -i 's|format = "2006-01-02 15:04:05"|format   = "2006-01-02 15:04:05"\n    location = "Asia/Kolkata"|' /etc/alloy/config.alloy
alloy fmt /etc/alloy/config.alloy >/dev/null && sudo systemctl restart alloy
echo "ts=\"$(TZ=Asia/Kolkata date '+%F %T')\" level=info msg=deployed app=exam-portal version=v2.4.2" \
  | sudo tee -a /var/log/deploy/deploy.log

Now Alloy converts 15:40 IST to 10:10 UTC and the marker lands at the right place. The cleaner long-term fix is the one from step 8: ask the release team to write RFC3339 with a zone (date -u +%Y-%m-%dT%H:%M:%SZ), so nobody has to guess.

✅ Checkpoint: A marker titled exam-portal v2.4.2 appears on the time series panel at the current time.

This happened at work

Result day at the exam portal

My team lead tells this one from his time at an online exam company in Delhi. On a board result morning at 10:30 the call centre said students were seeing “something went wrong” on the marks page. The Nginx dashboard was green: requests per second were huge, as expected, and the 5xx stat said zero.

He first suspected the database and spent fifteen minutes in MySQL looking for slow queries, and found nothing unusual. Then a junior opened Explore and ran a plain log query for the results page, and the lines were full of 502s from the upstream app servers. The dashboard missed them because two days earlier someone had added $upstream_response_time to the log format, the Alloy regex stopped matching, and every new line arrived without a status label, so status=~"5.." matched nothing.

The app servers had run out of worker threads, and adding two more servers behind the load balancer fixed the outage within twenty minutes. Afterwards the team did two things. They added a stat panel showing count_over_time({job="nginx"} | status="" [5m]), which counts lines with no status label and must stay at zero, and they made any change to the log format go through the same review as the Alloy config, with a sample line tested against the regex.

Common mistakes and troubleshooting

MistakeWhat happensWhat to do instead
Putting path, client IP or user ID into labelsStream count explodes, Loki memory climbs and pushes fail with stream limit errorsKeep labels to a short fixed list; parse high-cardinality fields at query time with | regexp or | pattern
Anchoring the regex with $ and then changing the log formatLines arrive without labels and status-based panels drop to zero with no error anywhereMake new trailing fields optional in the regex and alert on lines with an empty status
Leaving health checks in the log streamThousands of identical lines a day, noisy graphs and higher storageDrop them in Alloy with stage.drop, or turn access_log off for /health in Nginx
Not setting stage.timestamp for access logsOld lines replayed after an Alloy restart or file rotation get the read time, and graphs show a fake spikeParse time_local with stage.timestamp so each line keeps its real request time
Using [$__range] as the range in a panel queryEach point covers the whole time window, the graph goes flat and queries scan far more dataUse [$__auto] in panels so the range follows the graph step
Writing deploy times without a time zoneAnnotations land hours off, or Loki rejects them as too newWrite RFC3339 with Z or an offset, or set location in stage.timestamp

Interview questions

Click a question to open it. Each one is written the way an interviewer would ask it. Under it you will see why they ask it and one way you could answer, in your own words.

Fresher level

1. You have Nginx access logs in Loki. How would you graph requests per second split by HTTP status?

Why they ask this: They check that you know the difference between a log query and a metric query.

How you might answer: I’d use a metric query: sum by (status) (rate({job=”nginx”}[$__auto])). The selector picks the nginx streams, rate turns lines into per-second values per stream, and sum by (status) groups them.

That only works if status is a label, which I set in Alloy with stage.regex and stage.labels. If it isn’t a label I can still parse it at query time with | regexp and then sum by the extracted field.

2. Why shouldn’t the URL path be a Loki label?

Why they ask this: A basic cardinality question that every Loki user must answer correctly.

How you might answer: Every unique label set is a separate stream, and paths often carry IDs or roll numbers, so you’d get thousands of tiny streams. That bloats the index and ingester memory, slows queries and can hit the stream limit, so pushes get rejected.

I keep path in the log line and parse it at query time, for example with a topk over count_over_time and a regexp parser.

2–5 years experience

3. Your Nginx 5xx panel shows zero, but users report errors. Walk me through how you check whether the panel or the site is wrong.

Why they ask this: They want a calm debugging order instead of guessing.

How you might answer: First I query the raw lines in Explore, {job=”nginx”} |= ” 50″, to see whether errors exist at all. If they do, I check their labels; if status is missing, the Alloy parser isn’t matching, often because the log format changed.

Then I compare a recent line with the regex in config.alloy, fix it, and add a guard panel that counts lines with an empty status label so it can’t happen silently again.

4. How do you stop load balancer health checks from filling Loki?

Why they ask this: They check that you know where filtering belongs in the pipeline.

How you might answer: I drop them at the agent with a stage.drop in loki.process, matching the request line like “GET /health “, and give it a drop_counter_reason so I can see the count in loki_process_dropped_lines_total.

If the team agrees, turning access_log off for that location in Nginx is even cheaper, but dropping in Alloy keeps the decision in one place for every server.

Senior level

5. A release team wants deploy markers on every service dashboard. How would you design it with Loki?

Why they ask this: They are looking at design: a consistent event format, timestamps and reuse across dashboards.

How you might answer: I’d have every pipeline write one logfmt or JSON line per deploy with an RFC3339 UTC timestamp, app, version and who deployed, shipped as job=”deploy”. Alloy uses that ts as the entry time, so the marker sits at the real deploy time.

On dashboards I add a Loki annotation query like {job=”deploy”, app=”$app”} | logfmt with a title template of app and version. The main risks are time zones and volume, so I insist on a zone in the timestamp and keep deploy logs separate from chatty app logs.

6. When would you keep request metrics from logs in Loki, and when would you want an exporter or app metrics in Prometheus instead?

Why they ask this: They are checking cost and accuracy judgement across tools.

How you might answer: LogQL metrics are great when logs are all I have, for ad-hoc questions and for things like top paths that need the line content. Every query re-reads lines, though, so wide time ranges over busy logs are slow and expensive.

For dashboards that stay open all day and for alerting on a busy site, I’d rather have counters, either from an Nginx exporter, from the application, or from Loki recording rules writing to Prometheus. Then the log query is for investigation and the metric is for the always-on view.

Quick quiz

Q1. Which Alloy stage should you use to remove load balancer health check lines?

  1. stage.labels
  2. stage.drop
  3. stage.static_labels
  4. stage.timestamp
Show answer

B — stage.drop discards lines that match an expression or condition, before they are sent to Loki.

Q2. What does sum by (status) (rate({job=”nginx”}[5m])) return?

  1. The last log line per status
  2. Requests per second for each status value
  3. The number of streams
  4. The total bytes sent
Show answer

B — rate turns lines into a per-second rate per stream, and sum by (status) groups them by the status label.

Q3. Why is a URL path a bad Loki label?

  1. Loki can’t store slashes
  2. It has too many unique values, creating huge numbers of streams
  3. It makes queries case-sensitive
  4. Grafana can’t display it
Show answer

B — Each unique label set is a separate stream, so high-cardinality values like paths blow up the index and memory.

Q4. Your regex stage stops matching after a log format change. What happens?

  1. Alloy stops with an error
  2. Loki rejects the lines
  3. Lines still arrive but without the extracted labels
  4. Nginx refuses to start
Show answer

C — A non-matching regex extracts nothing, so labels and timestamps from it are missing, silently.

Q5. A deploy line written in IST without a zone is parsed as UTC. What do you see in Loki?

  1. Nothing, it’s rejected as too new because it looks 5.5 hours in the future
  2. It lands 5.5 hours in the past
  3. It lands at the right time
  4. It’s stored twice
Show answer

A — Loki rejects entries further ahead than creation_grace_period, so the deploy line never arrives and no annotation is drawn.

Quick recap

  • Alloy’s loki.process runs stages in order: drop health checks, regex the combined format, set the timestamp from time_local, then promote only method and status to labels.
  • Keep labels low-cardinality; paths, IPs and IDs stay in the line and are parsed at query time.
  • LogQL metric queries wrap a log query in count_over_time or rate, then group with sum by or rank with topk.
  • The Nginx app01 dashboard shows requests by status, a 5xx stat, top paths and a Logs panel of failed requests.
  • Loki annotations are log queries; a wrong time zone in the timestamp makes markers land in the wrong place or not at all.

Next lesson

Lesson 9: Prometheus and Node Exporter dashboards in Grafana → You import the Node Exporter Full dashboard, learn what each row means, edit it safely and build a Grafana health dashboard from Grafana’s own metrics.

Further reading: Nginx logs in Grafana

Want to go deeper into Nginx logs in Grafana? The Alloy reference for loki.process and its stages, the Loki docs on LogQL metric queries and label best practices, Grafana’s page on Loki annotations and the Nginx log module are the best references. Lesson 7 covers Loki and Alloy basics, and the Prometheus course shows the metrics side in PromQL examples.

You can also see the full plan for this course on the Grafana Dashboards and Observability course page.

Scroll to Top

This website uses cookies

We use a few cookies to keep this site working. If you allow it, we also use Google Analytics to count visits so we can improve our lessons. You can accept all, deny the optional ones, or choose what to allow.