InfluxDB and Telegraf in Grafana, including SNMP
-
Phase 1: Grafana setup and your first dashboards
-
Phase 2: Data sources, logs and metrics
-
Phase 3: Alerting, teams and running Grafana
Grafana InfluxDB Telegraf is the classic “TIG” stack: Telegraf collects metrics, InfluxDB stores them, Grafana draws them. Network teams love it because one Telegraf agent can read the local Linux box and poll routers and switches over SNMP in the same config. In this lesson you install InfluxDB 3 Core on graf01, run Telegraf on app01 for CPU, memory, disk and network, turn app01 into a pretend tower router with snmpd, and graph both in Grafana with plain SQL.
The break labs cover the four calls a TIG admin gets most: Telegraf writes rejected with 401, an SNMP poll that times out, a MIB that can’t be found, and a typo in a database name that quietly sends data somewhere nobody is looking.
Where this lesson fits
Lesson 10 of 14 in Grafana Dashboards and Observability · Phase 2: Data sources, logs and metrics · Before this: Lesson 9, Node Exporter dashboards · Next: Lesson 11, Grafana alerting
| Time | You need | By the end you can |
|---|---|---|
| About 100 minutes | graf01 and app01 from Lesson 9, internet on both VMs | Run InfluxDB 3 Core and Telegraf with tokens, poll SNMP interface counters, and build Linux and SNMP dashboards with SQL |
What it is, in one line
Telegraf is an agent that collects metrics from the machine it runs on and from devices it polls, InfluxDB stores them as tables of timestamped rows, and Grafana queries those tables with SQL to draw panels.
In Simple Words
The milk collection centre
In a Bengal village, a milk collection centre has one agent who goes from house to house every morning with a measuring can and a register. At some houses he measures the milk himself; at the cowshed on the hill, where he can’t walk in, he shouts across the fence and the farmer calls back the number. Every evening the register goes to the dairy office, where clerks file it by date and village and draw a chart on the wall.
Telegraf is the agent with the can, SNMP is shouting across the fence to a device you can’t install anything on, InfluxDB is the dairy office’s filing cabinet, and Grafana is the chart on the wall.
Engineer's View
Why InfluxDB 3 Core for this course
InfluxData now ships two open source lines. InfluxDB 2.x (TSM engine, buckets, Flux and InfluxQL) is in maintenance, and InfluxData’s own docs say Flux is in maintenance mode too. InfluxDB 3 Core (3.12 at the time of writing) is the current open source release: a single influxdb3 binary, packaged as influxdb3-core in the same InfluxData APT repository as Telegraf, storing data as Parquet files on local disk, queried with SQL or InfluxQL.
Grafana’s InfluxDB data source supports it directly (“InfluxDB OSS 3.x”, SQL over Flight SQL), Telegraf has had a native outputs.influxdb_v3 plugin since 1.38, and SQL is a language freshers already half know, so this course uses Core and caps its memory pool to fit a 3 GB lab VM.
| InfluxDB 2.x idea | InfluxDB 3 Core equivalent | In this lab |
|---|---|---|
| Bucket | Database | telegraf |
| Measurement | Table | cpu, mem, disk, net, system, snmp, interface |
| Tag | Tag column (string, indexed) | host, cpu, path, interface, ifName, source |
| Field | Field column (number, string, bool) | usage_idle, used_percent, bytes_recv, ifHCInOctets |
| Token with per-bucket permissions | Admin tokens only in Core (resource tokens are Enterprise) | Separate named tokens for Telegraf and Grafana |
| Port 8086 | Port 8181 (HTTP API and Flight SQL) | http://localhost:8181 from Grafana |
Two Core details matter in practice. Every Core token is an admin token, so you can’t give Grafana a read-only token; you create a named token per client so you can revoke one without touching the others, and you keep port 8181 behind ufw. Second, writes create databases and tables automatically, which is friendly until a typo creates a database you didn’t want (Break 4).
For SNMP, Telegraf’s inputs.snmp plugin polls agents with SNMP GET and walks tables such as IF-MIB’s ifXTable. Names like IF-MIB::ifHCInOctets have to be translated into numeric OIDs, which needs the MIB files on disk; Telegraf’s gosmi translator reads them from /usr/share/snmp/mibs (the older netsnmp translator is deprecated).
How it works, step by step
1Telegraf gathers on a timer and writes in batches
Every interval (10 seconds here) Telegraf runs each input plugin. inputs.cpu reads /proc/stat, inputs.mem reads /proc/meminfo, and inputs.snmp sends SNMP requests over UDP 161. Each result becomes a metric with a name, tags, fields and a timestamp, and every flush_interval the output plugin sends the batch as line protocol to InfluxDB with the token in an Authorization header. The diagram shows this path from app01 to a Grafana panel.
2InfluxDB 3 turns lines into table rows
InfluxDB checks the token, then appends each line to a write-ahead log and an in-memory buffer, so it can be queried straight away. Every few minutes it snapshots the buffer into Parquet files under /var/lib/influxdb3/data. One line like cpu,cpu=cpu-total,host=app01 usage_idle=97.4 becomes one row in table cpu of database telegraf, with cpu and host as tag columns and usage_idle as a field column.
3Grafana sends SQL with time macros
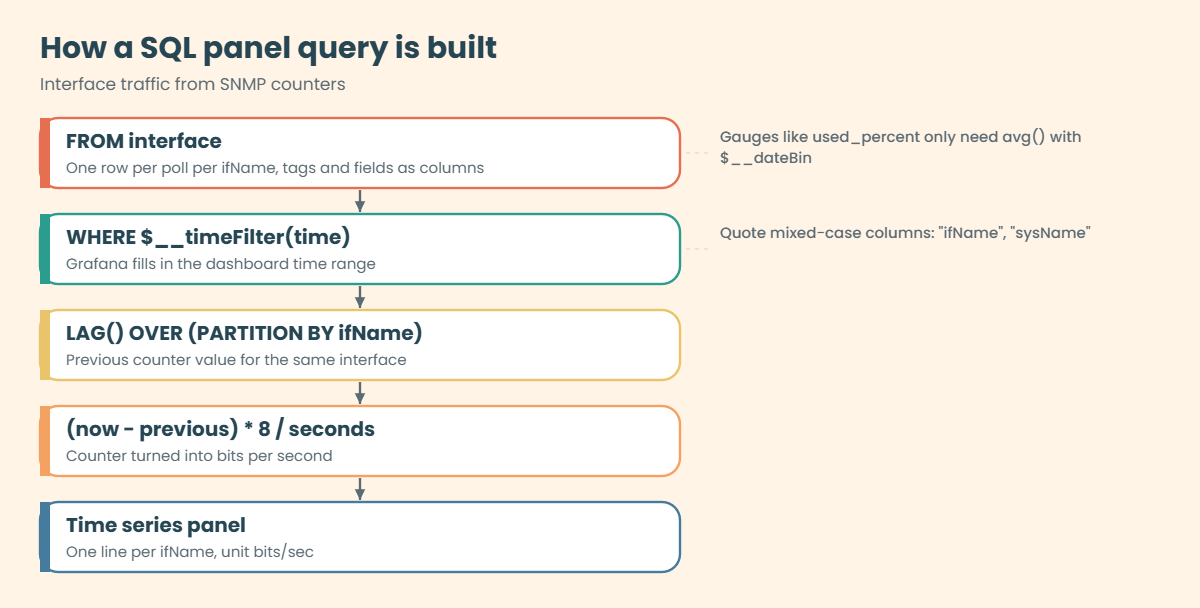
The Grafana data source talks Flight SQL (gRPC) to port 8181. Before sending, it expands $__timeFilter(time) into a WHERE clause for the dashboard range and $__dateBin(time) into date_bin() with the panel interval, so one query works for 15 minutes or 7 days. The diagram below shows how a panel query is built and where counters become rates.
4Counters need turning into rates
Network bytes in net and ifHCInOctets in SNMP are counters that only go up. A graph of the raw value is a rising line that tells you nothing about traffic right now. In SQL you compare each row with the previous one for the same interface using the LAG() window function, then divide by the seconds between them.
| Metric type | Example | How to graph it |
|---|---|---|
| Gauge | usage_idle, used_percent, load1 | Average per time bin with $__dateBin |
| Counter | bytes_recv, ifHCInOctets | Difference from previous row divided by seconds, times 8 for bits |
| Status | ifOperStatus (1 up, 2 down) | Latest value per interface in a table or state timeline |
Hands-on lab: InfluxDB 3 Core, Telegraf and SNMP interface graphs in Grafana
Before you run any command, double-check it
Read every command twice before you press Enter. Check the target: the server name, the user, the disk or device name, the path and the sizes. These commands are for learning and were tested in our lab, not on your system. At work, run the read-only commands first, follow your change process, make sure a backup exists, and ask a second person to check anything that changes or deletes data. You run them at your own risk.
InfluxDB runs on graf01 (192.168.56.70); Telegraf and snmpd run on app01 (192.168.56.71). Tokens are long random strings, so you’ll keep them in files with chmod 600 instead of typing them. The InfluxDB data source in Grafana uses port 8181, the InfluxDB 3 default, not the 8086 you may know from older versions.
1Add the InfluxData repository and install InfluxDB 3 Core on graf01
Paste this whole block on graf01:
cd /tmp
curl --silent --location -O https://repos.influxdata.com/influxdata-archive.key
gpg --show-keys --with-fingerprint --with-colons ./influxdata-archive.key 2>&1 \
| grep -q '^fpr::*24C975CBA61A024EE1B631787C3D57159FC2F927:$' \
&& cat influxdata-archive.key | gpg --dearmor \
| sudo tee /usr/share/keyrings/influxdata-archive.gpg >/dev/null \
&& echo 'deb [signed-by=/usr/share/keyrings/influxdata-archive.gpg] https://repos.influxdata.com/debian stable main' \
| sudo tee /etc/apt/sources.list.d/influxdata.list
sudo apt-get update && sudo apt-get install -y influxdb3-core
influxdb3 --version
grep -v ^# /etc/influxdb3/influxdb3-core.conf | grep .Leaving out the apt messages, you should see:
deb [signed-by=/usr/share/keyrings/influxdata-archive.gpg] https://repos.influxdata.com/debian stable main
influxdb3 InfluxDB 3 Core, 3.12.2, revision cc9769917ab399ed5b48567a92b5d34ed4d918ea
node-id="primary-node"
object-store="file"
data-dir="/var/lib/influxdb3/data"
plugin-dir="/var/lib/influxdb3/plugins"The package writes a long, fully commented config file and switches on only these four keys, so the grep hides the comments.
The grep checks the key’s fingerprint before trusting it, which is what InfluxData’s own install guide does; if the fingerprint doesn’t match, nothing is written. The package enables the influxdb3-core unit but doesn’t start it, so you can configure it first.
✅ Checkpoint: The version check prints a 3.x version and the TOML file shows object-store file and data-dir /var/lib/influxdb3/data.
2Cap memory and start the service
graf01 has 3 GB shared by Grafana, Prometheus, Loki and now InfluxDB. The systemd launcher turns each TOML key into an INFLUXDB3_* environment variable, so you add settings to the same file.
Paste this whole block on graf01:
sudo tee -a /etc/influxdb3/influxdb3-core.conf >/dev/null <<'EOF'
exec-mem-pool-size = "10%"
disable-telemetry-upload = true
EOF
sudo systemctl start influxdb3-core
sleep 5; systemctl is-active influxdb3-core
sudo ss -ltnp | grep 8181
sudo ufw status | grep 8181 || echo "8181 not open in ufw (good for now)"You should see this (your pid and fd numbers will differ):
active
LISTEN 0 1024 0.0.0.0:8181 0.0.0.0:* users:(("influxdb3",pid=6114,fd=12))
8181 not open in ufw (good for now)Until the first admin token exists, InfluxDB 3 accepts the token-creation call without authentication, so whoever reaches port 8181 first could claim it. ufw already blocks 8181 from other machines, which closes that window; you’ll open it for app01 only after the next step.
✅ Checkpoint: influxdb3-core is active, listening on 8181, and ufw has no rule for 8181 yet.
3Create the operator token, a database and client tokens
Run this on graf01:
influxdb3 create token --adminYou should see this (the token is shortened here):
New token created successfully!
Token: apiv3_kH3q...0w==
HTTP Requests Header: Authorization: Bearer apiv3_kH3q...0w==
IMPORTANT: Store this token securely, as it will not be shown again.Copy the token (the whole apiv3_... string) into a private file and use it for the next commands:
Paste this whole block on graf01 (put your token in the first line):
echo 'apiv3_PASTE_YOUR_OPERATOR_TOKEN' > ~/.influxdb3-operator && chmod 600 ~/.influxdb3-operator
export INFLUXDB3_AUTH_TOKEN=$(cat ~/.influxdb3-operator)
influxdb3 create database --retention-period 30d telegraf
influxdb3 show databases
influxdb3 create token --admin --name telegraf
influxdb3 create token --admin --name grafana
sudo ufw allow from 192.168.56.71 to any port 8181 proto tcpYou should see this (tokens shortened here):
Database "telegraf" created successfully
+---------------+
| iox::database |
+---------------+
| _internal |
| telegraf |
+---------------+
New token created successfully!
Token: apiv3_Q9vd...Lw==
HTTP Requests Header: Authorization: Bearer apiv3_Q9vd...Lw==
IMPORTANT: Store this token securely, as it will not be shown again.
New token created successfully!
Token: apiv3_7mPa...Jg==
HTTP Requests Header: Authorization: Bearer apiv3_7mPa...Jg==
IMPORTANT: Store this token securely, as it will not be shown again.
Rule addedSave the telegraf token for step 4 and the grafana token for step 6. The 30 day retention period means rows older than 30 days stop being queryable and are removed, which keeps the lab disk small. _internal is InfluxDB’s own system database.
✅ Checkpoint: show databases lists telegraf, you have three tokens (operator, telegraf, grafana) and ufw allows 8181 from 192.168.56.71 only.
4Install Telegraf on app01 and send Linux metrics
Paste this whole block on app01 (repository lines are the same as on graf01):
cd /tmp
curl --silent --location -O https://repos.influxdata.com/influxdata-archive.key
gpg --show-keys --with-fingerprint --with-colons ./influxdata-archive.key 2>&1 \
| grep -q '^fpr::*24C975CBA61A024EE1B631787C3D57159FC2F927:$' \
&& cat influxdata-archive.key | gpg --dearmor \
| sudo tee /usr/share/keyrings/influxdata-archive.gpg >/dev/null \
&& echo 'deb [signed-by=/usr/share/keyrings/influxdata-archive.gpg] https://repos.influxdata.com/debian stable main' \
| sudo tee /etc/apt/sources.list.d/influxdata.list
sudo apt-get update && sudo apt-get install -y telegraf
# token goes in an environment file only root can read
echo 'INFLUX_TOKEN=apiv3_PASTE_THE_TELEGRAF_TOKEN' | sudo tee /etc/default/telegraf >/dev/null
sudo chmod 600 /etc/default/telegraf
sudo mv /etc/telegraf/telegraf.conf /etc/telegraf/telegraf.conf.sample
sudo tee /etc/telegraf/telegraf.conf >/dev/null <<'EOF'
[agent]
interval = "10s"
flush_interval = "10s"
snmp_translator = "gosmi"
[[outputs.influxdb_v3]]
urls = ["http://192.168.56.70:8181"]
token = "${INFLUX_TOKEN}"
database = "telegraf"
[[inputs.cpu]]
percpu = false
totalcpu = true
[[inputs.mem]]
[[inputs.disk]]
ignore_fs = ["tmpfs", "devtmpfs", "overlay", "squashfs"]
[[inputs.net]]
interfaces = ["enp0s3", "enp0s8"]
[[inputs.system]]
EOF
sudo -u telegraf telegraf --config /etc/telegraf/telegraf.conf --test --input-filter cpu:mem 2>/dev/null
sudo systemctl restart telegraf && systemctl is-active telegrafYou should see this (your numbers will differ, and the two lines can swap places):
> cpu,cpu=cpu-total,host=app01 usage_guest=0,usage_guest_nice=0,usage_idle=97.01492537313433,usage_iowait=0.4975124378109453,usage_irq=0,usage_nice=0,usage_softirq=0,usage_steal=0,usage_system=1.4925373134328357,usage_user=0.9950248756218906 1794135610000000000
> mem,host=app01 active=512319488u,available=905338880u,available_percent=58.890451982820174,buffered=48439296u,cached=611934208u,commit_limit=1573711872u,committed_as=1187516416u,dirty=118784u,free=153419776u,high_free=0u,high_total=0u,huge_page_size=2097152u,huge_pages_free=0u,huge_pages_total=0u,inactive=659230720u,low_free=0u,low_total=0u,mapped=214523904u,page_tables=9682944u,shared=1851392u,slab=137916416u,sreclaimable=91463680u,sunreclaim=46452736u,swap_cached=0u,swap_free=805302272u,swap_total=805302272u,total=1537327104u,used=519266304u,used_percent=33.777216484956995,vmalloc_chunk=0u,vmalloc_total=35184372087808u,vmalloc_used=24326144u,write_back=0u,write_back_tmp=0u 1794135610000000000
activeTelegraf sorts the fields by name in test mode. The u after a number marks an unsigned integer, and the cpu input is gathered twice half a second apart so it can work out the usage percentages.
--test runs the inputs once and prints line protocol without sending anything, which is the best way to check a new input. The sample config that ships with the package enables an old InfluxDB 1.x output by default, which is why you replace the file instead of editing it. Telegraf reads /etc/default/telegraf through its systemd unit, so ${INFLUX_TOKEN} in the config is filled in at start and the token never sits in telegraf.conf.
✅ Checkpoint: The Telegraf test run prints cpu and mem lines for host=app01 and the telegraf service is active.

5Query InfluxDB with SQL from the CLI
Run this on graf01:
export INFLUXDB3_AUTH_TOKEN=$(cat ~/.influxdb3-operator)
influxdb3 query --database telegraf \
"SELECT table_name FROM information_schema.tables WHERE table_schema = 'iox' ORDER BY table_name"
influxdb3 query --database telegraf \
"SELECT time, host, round(100 - usage_idle, 1) AS cpu_busy FROM cpu WHERE cpu = 'cpu-total' ORDER BY time DESC LIMIT 3"You should see this (your times and values will differ):
+------------+
| table_name |
+------------+
| cpu |
| disk |
| mem |
| net |
| system |
+------------+
+---------------------+-------+----------+
| time | host | cpu_busy |
+---------------------+-------+----------+
| 2026-11-08T11:00:40 | app01 | 2.9 |
| 2026-11-08T11:00:30 | app01 | 3.1 |
| 2026-11-08T11:00:20 | app01 | 2.6 |
+---------------------+-------+----------+Each Telegraf input became a table, created on the first write. Rows arrive every 10 seconds, and the time column is UTC.
✅ Checkpoint: The table list shows cpu, disk, mem, net and system, and the cpu query returns recent rows for app01.
6Add the InfluxDB data source in Grafana
In Grafana go to Connections > Data sources > Add data source > InfluxDB and fill in:
| Field | Value |
|---|---|
| Name | InfluxDB |
| URL | http://localhost:8181 |
| Product | InfluxDB OSS 3.x |
| Query language | SQL |
| Database | telegraf |
| Token | the grafana token from step 3 |
| Advanced Database Settings > Insecure Connection | On (the lab has no TLS on 8181) |
Click Save & test. A green result means Grafana reached port 8181 over Flight SQL and the token was accepted. Without Insecure Connection the test fails, because Grafana tries TLS on a port that only speaks plain gRPC.
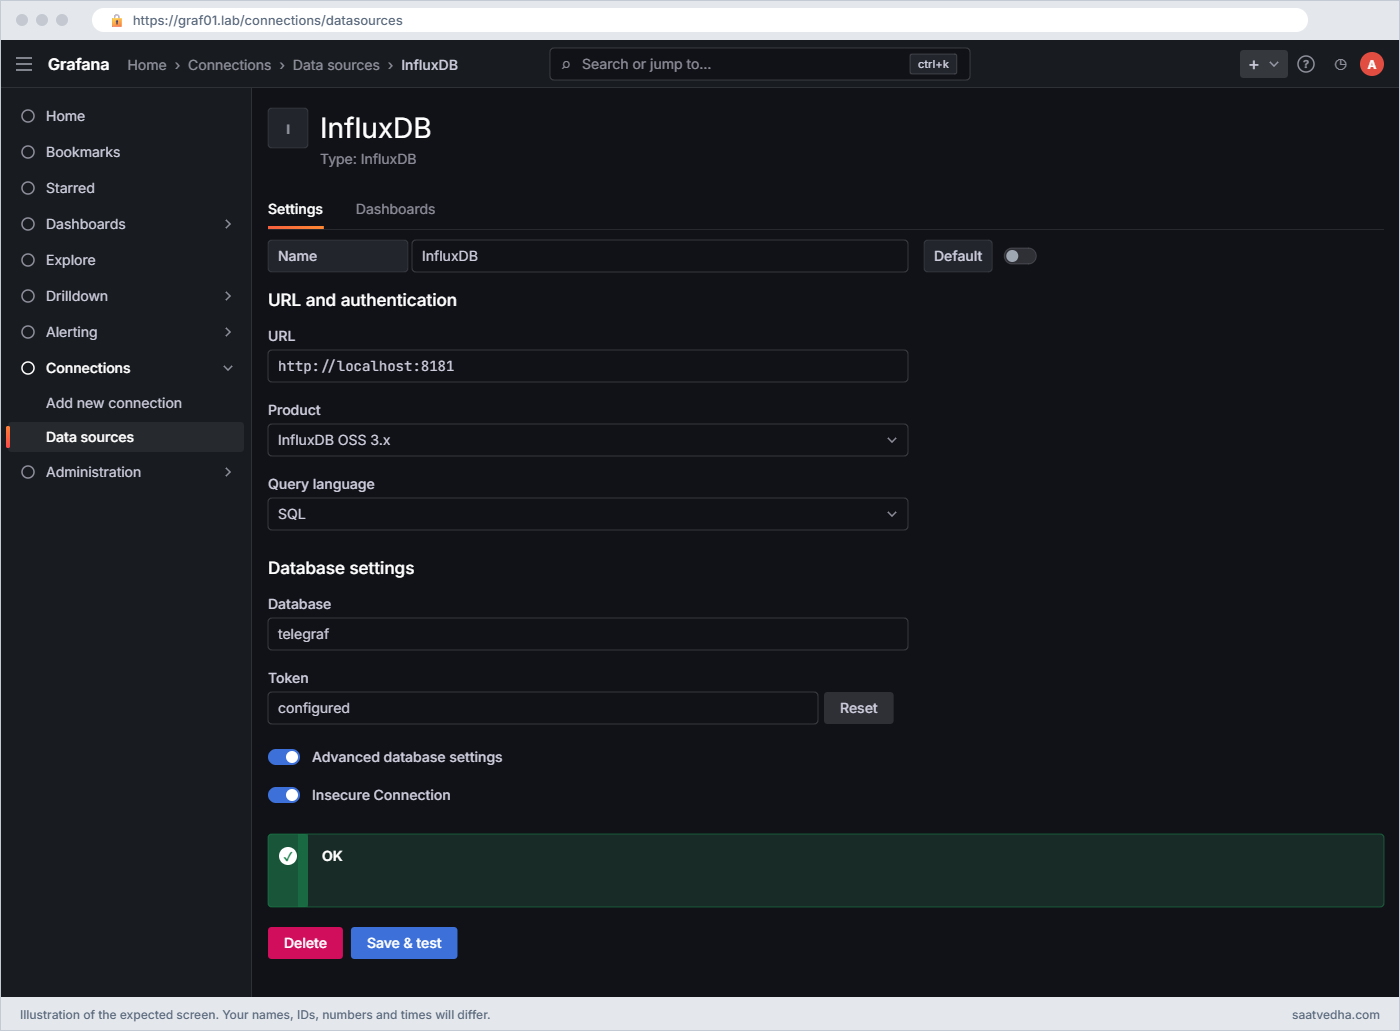
✅ Checkpoint: The InfluxDB data source saves and tests green with SQL.
7Build the “Linux via Telegraf” dashboard
Create a dashboard Linux via Telegraf in SaatVedha Lab. Add a query variable host on the InfluxDB data source with SELECT DISTINCT host FROM cpu WHERE $__timeFilter(time), then these panels:
CPU busy % (time series):
SELECT $__dateBin(time) AS time, 100 - avg(usage_idle) AS "CPU busy"
FROM cpu
WHERE $__timeFilter(time) AND cpu = 'cpu-total' AND host = '$host'
GROUP BY 1 ORDER BY 1Memory and root disk used % (two queries on one time series panel):
SELECT $__dateBin(time) AS time, avg(used_percent) AS "RAM used"
FROM mem WHERE $__timeFilter(time) AND host = '$host' GROUP BY 1 ORDER BY 1
SELECT $__dateBin(time) AS time, avg(used_percent) AS "Root disk used"
FROM disk WHERE $__timeFilter(time) AND host = '$host' AND path = '/' GROUP BY 1 ORDER BY 1Network in, bits per second (counter turned into a rate):
SELECT time, interface,
(CAST(bytes_recv AS DOUBLE) - LAG(CAST(bytes_recv AS DOUBLE)) OVER w) * 8
/ ((CAST(time AS BIGINT) - LAG(CAST(time AS BIGINT)) OVER w) / 1e9) AS in_bps
FROM net
WHERE $__timeFilter(time) AND host = '$host'
WINDOW w AS (PARTITION BY interface ORDER BY time)
ORDER BY timeSet the unit to percent (0-100) for the first two panels and bits/sec (SI) for the network panel. CAST(time AS BIGINT) gives nanoseconds, so dividing by 1e9 gives seconds between samples. If the network panel draws one line instead of one per interface, add the Partition by values transformation on the interface field.
✅ Checkpoint: Linux via Telegraf shows CPU busy, RAM and root disk percentages, and a bits per second line for enp0s3 and enp0s8.
8Turn app01 into a pretend tower router with snmpd
A real tower site has a router you can’t install Telegraf on. snmpd on app01 plays that role. Ubuntu’s default snmpd only listens on 127.0.0.1 and shows only the system group to the public community, so you write your own config with a private community and the interface tables visible.
Paste this whole block on app01:
sudo apt-get install -y snmpd snmp snmp-mibs-downloader
sudo sed -i 's/^mibs :/# mibs :/' /etc/snmp/snmp.conf
sudo cp /etc/snmp/snmpd.conf /etc/snmp/snmpd.conf.orig
sudo tee /etc/snmp/snmpd.conf >/dev/null <<'EOF'
agentaddress udp:161
view netview included .1.3.6.1.2.1.1
view netview included .1.3.6.1.2.1.2
view netview included .1.3.6.1.2.1.31
rocommunity tower-ro 127.0.0.1 -V netview
rocommunity tower-ro 192.168.56.0/24 -V netview
sysLocation KOL-0142 tower shelter, Kolkata
sysContact noc@lab.local
EOF
sudo systemctl restart snmpd
snmpget -v2c -c tower-ro 192.168.56.71 SNMPv2-MIB::sysName.0 SNMPv2-MIB::sysLocation.0
snmpwalk -v2c -c tower-ro 192.168.56.71 IF-MIB::ifNameYou should see:
SNMPv2-MIB::sysName.0 = STRING: app01
SNMPv2-MIB::sysLocation.0 = STRING: KOL-0142 tower shelter, Kolkata
IF-MIB::ifName.1 = STRING: lo
IF-MIB::ifName.2 = STRING: enp0s3
IF-MIB::ifName.3 = STRING: enp0s8snmp-mibs-downloader (from Ubuntu’s multiverse section) fetches the standard IETF and IANA MIB files into /usr/share/snmp/mibs/ietf and iana, and commenting out mibs : lets the net-snmp tools load them, so you see names like ifName instead of numbers. The three views expose system, interfaces and the 64-bit interface counters, nothing else.
✅ Checkpoint: snmpget returns sysName app01 and the KOL-0142 location, and snmpwalk lists lo, enp0s3 and enp0s8.
9Poll the “router” with Telegraf inputs.snmp
Add an SNMP input in its own file. Telegraf on app01 polls 192.168.56.71 over the network, the same way it would poll a router at a tower site, and adding a second device later is one more entry in agents.
Paste this whole block on app01:
sudo tee /etc/telegraf/telegraf.d/snmp-towers.conf >/dev/null <<'EOF'
[[inputs.snmp]]
agents = ["udp://192.168.56.71:161"]
version = 2
community = "tower-ro"
timeout = "5s"
retries = 3
agent_host_tag = "source"
path = ["/usr/share/snmp/mibs"]
[[inputs.snmp.field]]
oid = "SNMPv2-MIB::sysName.0"
name = "sysName"
is_tag = true
[[inputs.snmp.field]]
oid = "SNMPv2-MIB::sysUpTime.0"
name = "uptime"
conversion = "float(2)"
[[inputs.snmp.table]]
oid = "IF-MIB::ifXTable"
name = "interface"
inherit_tags = ["sysName"]
[[inputs.snmp.table.field]]
oid = "IF-MIB::ifName"
is_tag = true
[[inputs.snmp.table.field]]
oid = "IF-MIB::ifOperStatus"
EOF
sudo -u telegraf telegraf --config /etc/telegraf/telegraf.conf --config-directory /etc/telegraf/telegraf.d \
--test --input-filter snmp 2>/dev/null | head -n 3
sudo systemctl restart telegrafThe first line is the device row (your uptime will differ):
> snmp,host=app01,source=192.168.56.71,sysName=app01 uptime=118734.52 1794136020000000000The next two lines are interface rows that start with > interface,host=app01,ifName=lo,source=192.168.56.71,sysName=app01 and the same for ifName=enp0s3, each followed by a long, sorted list of fields such as ifHCInOctets, ifHCOutOctets, ifHighSpeed and ifOperStatus.
Telegraf walked the whole ifXTable (64-bit counters, ifName, ifHighSpeed) and joined ifOperStatus from ifTable because both use the same interface index. agent_host_tag = "source" names the polled device’s address tag the same way other Telegraf plugins do, and sysName is copied to every interface row so you can filter by device name.
✅ Checkpoint: The Telegraf test run prints an snmp line and one interface line per ifName, and the service restarts cleanly.
10Build the “Tower routers (SNMP)” dashboard
Create a dashboard Tower routers (SNMP) with a variable device (SELECT DISTINCT "sysName" FROM interface WHERE $__timeFilter(time)) and these panels:
Interface traffic in and out, bits per second (time series):
SELECT time, "ifName",
(CAST("ifHCInOctets" AS DOUBLE) - LAG(CAST("ifHCInOctets" AS DOUBLE)) OVER w) * 8
/ ((CAST(time AS BIGINT) - LAG(CAST(time AS BIGINT)) OVER w) / 1e9) AS in_bps,
(CAST("ifHCOutOctets" AS DOUBLE) - LAG(CAST("ifHCOutOctets" AS DOUBLE)) OVER w) * 8
/ ((CAST(time AS BIGINT) - LAG(CAST(time AS BIGINT)) OVER w) / 1e9) AS out_bps
FROM interface
WHERE $__timeFilter(time) AND "sysName" = '$device' AND "ifName" <> 'lo'
WINDOW w AS (PARTITION BY "ifName" ORDER BY time)
ORDER BY timeInterface status (table, Format Table):
SELECT "ifName", last_value("ifOperStatus" ORDER BY time) AS status,
last_value("ifHighSpeed" ORDER BY time) AS speed_mbps
FROM interface
WHERE $__timeFilter(time) AND "sysName" = '$device'
GROUP BY "ifName" ORDER BY "ifName"Column names with capital letters ("ifName", "sysName") must be in double quotes in SQL, or they are read as lower case and not found. On the status table add value mappings 1 = up (green) and 2 = down (red). From graf01 run curl -s -o /dev/null http://app01/ in a loop or reuse the Lesson 8 traffic script, and the enp0s8 line climbs.

✅ Checkpoint: Tower routers (SNMP) shows in and out bits per second for enp0s3 and enp0s8, and the status table shows both as up.
11Snapshot both VMs
Run this on your laptop:
VBoxManage snapshot graf01 take influx-telegraf
VBoxManage snapshot app01 take influx-telegrafYou should see this (your UUIDs will differ):
0%...10%...20%...30%...40%...50%...60%...70%...80%...90%...100%
Snapshot taken. UUID: 5d9a2c47-8e13-4b6f-a0d2-6c7e1f3b9a84
0%...10%...20%...30%...40%...50%...60%...70%...80%...90%...100%
Snapshot taken. UUID: e8b03f15-4a7c-4d29-9b61-0f5d2e8c7a39✅ Checkpoint: Both VMs have a snapshot called influx-telegraf.
Break It, Then Fix It
Each of these is a real ticket from TIG setups. Take them one at a time and put things back before the next.
1Telegraf writes rejected with 401
Someone rotates tokens on graf01 and forgets app01. Simulate it with a wrong token:
Run this on app01:
sudo cp /etc/default/telegraf /root/telegraf.env.bak
echo 'INFLUX_TOKEN=apiv3_this-token-was-revoked' | sudo tee /etc/default/telegraf >/dev/null
sudo systemctl restart telegraf; sleep 25
sudo journalctl -u telegraf --since "1 min ago" | grep -E 'E!' | tail -n 2You’ll get this error:
... E! [outputs.influxdb_v3] Writing to "http://192.168.56.70:8181" failed: failed to write metric to telegraf (401 Unauthorized)
... E! [agent] Error writing to outputs.influxdb_v3: failed to send metrics to any configured server(s)InfluxDB refused the token, so Telegraf keeps the metrics in its buffer (10,000 by default) and retries every flush. Panels go flat at the time of the change. If the buffer fills, the oldest metrics are dropped, so a long outage means a real gap.
Fix: put the valid token back and restart:
sudo cp /root/telegraf.env.bak /etc/default/telegraf && sudo chmod 600 /etc/default/telegraf
sudo systemctl restart telegraf; sleep 25
sudo journalctl -u telegraf --since "30 sec ago" | grep -c 'E!'0✅ Checkpoint: No new E! lines after the restart and the Linux via Telegraf panels move again.
2SNMP poll times out
A field engineer replaces the tower router and the new one ships with the vendor default config. Put snmpd back to Ubuntu’s original file to play that part:
Run this on app01:
sudo cp /etc/snmp/snmpd.conf /root/snmpd.conf.lab
sudo cp /etc/snmp/snmpd.conf.orig /etc/snmp/snmpd.conf && sudo systemctl restart snmpd
snmpget -v2c -c tower-ro -t 1 -r 1 192.168.56.71 SNMPv2-MIB::sysName.0
sleep 30; sudo journalctl -u telegraf --since "1 min ago" | grep snmp | tail -n 1You’ll get this error:
Timeout: No Response from 192.168.56.71.
... E! [inputs.snmp] Error in plugin: agent udp://192.168.56.71:161: performing get on field sysName: request timeout (after 3 retries)SNMP runs over UDP, so there’s no “connection refused”: a closed port, a firewall, an agent listening on 127.0.0.1 only and a wrong community all look the same, silence until the timeout. Ubuntu’s default config does two of those at once: agentaddress 127.0.0.1,[::1] and no tower-ro community. Check in this order: is the agent listening on the right address (sudo ss -ulnp | grep :161), does a firewall allow UDP 161 from the poller, and does the community match.
Fix: restore the lab config:
sudo cp /root/snmpd.conf.lab /etc/snmp/snmpd.conf && sudo systemctl restart snmpd
snmpget -v2c -c tower-ro 192.168.56.71 SNMPv2-MIB::sysName.0SNMPv2-MIB::sysName.0 = STRING: app01✅ Checkpoint: snmpget answers again and the next Telegraf poll logs no timeout.
3MIB not found
On a new poller someone installs Telegraf but not the MIB files. Simulate it by pointing the plugin at a folder that has only net-snmp’s own MIBs:
Run this on app01:
sudo mkdir -p /opt/mibs-empty && sudo cp /usr/share/snmp/mibs/NET-SNMP-*.txt /opt/mibs-empty/
sudo sed -i 's|path = \["/usr/share/snmp/mibs"\]|path = ["/opt/mibs-empty"]|' /etc/telegraf/telegraf.d/snmp-towers.conf
sudo -u telegraf telegraf --config /etc/telegraf/telegraf.conf --config-directory /etc/telegraf/telegraf.d \
--test --input-filter snmp 2>&1 | grep -m1 'E!'
snmpwalk -v2c -c tower-ro -M /opt/mibs-empty 192.168.56.71 IF-MIB::ifNameYou’ll get these errors:
... E! [telegraf] Error running agent: could not initialize input inputs.snmp: initializing field sysName: translating: cannot translate SNMPv2-MIB::sysName.0 into a numeric OID, please ensure all imported MIBs are in the path
MIB search path: /opt/mibs-empty
Cannot find module (IF-MIB): At line 1 in (none)
IF-MIB::ifName: Unknown Object IdentifierNames like SNMPv2-MIB::sysName.0 are only labels for numeric OIDs (.1.3.6.1.2.1.1.5.0). Without the MIB file Telegraf can’t translate them, refuses to start the plugin, and the whole agent stops, Linux metrics included. On vendor devices the same error appears when you reference a vendor MIB (Cisco, Juniper, Nokia) that isn’t in the path.
Fix: point back at the full MIB folder:
sudo sed -i 's|path = \["/opt/mibs-empty"\]|path = ["/usr/share/snmp/mibs"]|' /etc/telegraf/telegraf.d/snmp-towers.conf
sudo systemctl restart telegraf && systemctl is-active telegrafactiveFor vendor MIBs, copy the vendor’s files into a subfolder such as /usr/share/snmp/mibs/vendor; the gosmi translator searches subfolders of each path. Or use numeric OIDs in the config and give each field a name, which needs no MIB at all.
✅ Checkpoint: Telegraf is active again and the SNMP dashboard keeps updating.
4Data goes to the wrong database
A colleague copies the Telegraf config to another server and mistypes the database. Do the same on app01:
Run this on app01, then the check on graf01:
sudo sed -i 's/database = "telegraf"/database = "telegarf"/' /etc/telegraf/telegraf.conf
sudo systemctl restart telegraf
# on graf01, a minute later:
export INFLUXDB3_AUTH_TOKEN=$(cat ~/.influxdb3-operator)
influxdb3 show databasesYou’ll see this (and No data on new points in Grafana):
+---------------+
| iox::database |
+---------------+
| _internal |
| telegarf |
| telegraf |
+---------------+There’s no error anywhere. InfluxDB 3 creates a database on first write, so Telegraf reports success while Grafana, which reads telegraf, stops getting new rows. The new database also has no retention period, so it grows forever if nobody notices.
Fix: correct the name and remove the stray database:
# on app01
sudo sed -i 's/database = "telegarf"/database = "telegraf"/' /etc/telegraf/telegraf.conf
sudo systemctl restart telegraf
# on graf01
influxdb3 delete database telegarfAre you sure you want to delete "telegarf"? Enter 'yes' to confirm
yes
Database "telegarf" deleted successfullyAt work, keep the database name in one shared config snippet (or a Telegraf database_tag) instead of typing it per server, and add a panel or alert that counts hosts reporting in the last 5 minutes, so a server writing somewhere else shows up as missing.
✅ Checkpoint: show databases lists only _internal and telegraf, and app01 rows are arriving in telegraf again.
This happened at work
Forty towers that looked fine
An on-call engineer at a tower company in Kolkata told me this one. During the pre-monsoon storm season, customers in two districts complained of slow mobile data for three evenings in a row. The SNMP dashboards for the tower routers were all green: every router had uptime, and none showed high interface traffic.
The team first suspected the fibre backhaul provider and raised tickets with them, which went nowhere for a day. Then the engineer opened the interface table panel for one tower and saw it was empty, not low. A firmware upgrade a week earlier had reset the SNMP config on forty routers to a “system only” view, so polls for sysUpTime still worked while every interface walk returned “No more variables left in this MIB View”.
Telegraf logged nothing because an empty table isn’t an error.
Once the view was restored, the graphs showed the microwave links at those towers pinned at their capacity every evening after rain, and the radio team re-aligned two dishes that week. The NOC added a panel counting interface rows per device over the last 15 minutes, with an alert when any device drops to zero, and added the SNMP view to the post-upgrade checklist.
Common mistakes and troubleshooting
| Mistake | What happens | What to do instead |
|---|---|---|
| Graphing raw counters like ifHCInOctets or bytes_recv | A line that only climbs and says nothing about current traffic | Turn counters into rates with LAG() over time, or with a derivative in InfluxQL |
| Leaving port 8181 open before the first token exists | Anyone who reaches it first can claim the operator token | Keep 8181 blocked in ufw until the operator token is created, then allow only the writers |
| Putting the token straight into telegraf.conf | The token ends up in backups, tickets and Git | Use an environment file readable only by root and ${INFLUX_TOKEN} in the config |
| Using one token for every Telegraf and Grafana | Rotating it means touching every system at once | Create a named token per client so you can revoke one at a time |
| Using the default public community and 32-bit ifInOctets | Anyone can read the device, and counters wrap within seconds on fast links | Use a private community or SNMPv3, and 64-bit ifHC counters from ifXTable |
| Typing the database name per server | A typo creates a new database silently and data seems to vanish | Share one config snippet and alert on hosts that stop reporting |
| Forgetting double quotes around mixed-case column names in SQL | Query errors saying the column doesn’t exist | Write “ifName”, “sysName” with double quotes |
Interview questions
Click a question to open it. Each one is written the way an interviewer would ask it. Under it you will see why they ask it and one way you could answer, in your own words.
Fresher level
1. What does each part of a TIG stack do?
Why they ask this: They check that you can explain the roles without mixing them up.
How you might answer: Telegraf is the agent: it runs input plugins on an interval, like cpu, mem or snmp, and sends the results through an output plugin. InfluxDB stores them as tables of timestamped rows with tags and fields. Grafana connects to InfluxDB as a data source and queries it with SQL or InfluxQL to draw panels.
In our lab Telegraf on app01 writes to InfluxDB 3 Core on graf01 port 8181, and Grafana queries the telegraf database.
2. How would you check a new Telegraf input before turning it on?
Why they ask this: They want to see a safe, practical habit.
How you might answer: I run telegraf in test mode with an input filter for that plugin, which gathers once and prints line protocol without writing anywhere. That shows me the measurement name, tags and fields, and any error like a timeout or a missing MIB, before the service restarts.
2–5 years experience
3. Telegraf on a poller logs request timeout for one router. How do you troubleshoot?
Why they ask this: A network troubleshooting order for SNMP over UDP.
How you might answer: Because SNMP is UDP, a timeout can mean the agent isn’t listening, a firewall drops UDP 161, the community or SNMPv3 user is wrong, or an ACL on the device doesn’t include the poller. I test from the poller with snmpget using the same version and community as Telegraf.
If snmpget also times out, I check the device config and the path; if snmpget works, I compare Telegraf’s settings, especially the community, version and agent address format like udp://ip:161.
4. Why use ifHCInOctets instead of ifInOctets, and how do you graph it?
Why they ask this: They check SNMP counter knowledge and rate maths.
How you might answer: ifInOctets is a 32-bit counter, so on a gigabit link it can wrap in about half a minute, faster than many polling intervals, and you get false drops. ifHCInOctets in ifXTable is 64-bit and doesn’t wrap in practice.
To graph it I take the difference from the previous sample divided by the seconds between them and multiply by 8 for bits per second, which in InfluxDB 3 SQL is a LAG() window partitioned by interface.
Senior level
5. Your team must choose between InfluxDB 2.x and InfluxDB 3 Core for a new monitoring project. What do you weigh?
Why they ask this: They are checking product judgement, not loyalty to one version.
How you might answer: InfluxDB 2.x is mature with buckets, fine-grained tokens and a built-in UI, but it is in maintenance and Flux is in maintenance mode too. InfluxDB 3 Core is the current line with SQL, Parquet storage and native Telegraf and Grafana support, but in Core every token is an admin token and some features sit in Enterprise.
For a new project I’d lean to 3 Core for metrics, keep the API port firewalled with a named token per client, and budget for Enterprise if we need read-only tokens or clustering.
6. How would you design SNMP polling for 2,000 tower routers?
Why they ask this: They want scale, reliability and change-safety thinking.
How you might answer: I’d run several Telegraf pollers by region, each with a list of agents, 64-bit counters only, and a sensible interval like 60 seconds for interfaces and longer for inventory data. Configs come from a template in Git, with SNMPv3 credentials in a secret store rather than in files.
I’d also monitor the monitoring: a panel and alert on devices with zero interface rows or poll errors in the last 15 minutes, because firmware upgrades and ACL changes quietly break polls far more often than the pollers fail.
Quick quiz
Q1. What is the default port of InfluxDB 3 Core?
- 8086
- 8181
- 9090
- 3000
Show answer
B — InfluxDB 3 serves its HTTP API and Flight SQL on 8181 by default; 8086 was the 1.x and 2.x port.
Q2. In InfluxDB 3, what replaces the 2.x bucket?
- A table
- A database
- A measurement
- A retention policy
Show answer
B — InfluxDB 3 uses databases where 2.x used buckets; measurements become tables.
Q3. Telegraf logs failed to write metric to telegraf (401 Unauthorized). What is the likely cause?
- InfluxDB is down
- The database doesn’t exist
- The token is wrong or revoked
- The disk is full
Show answer
C — 401 means the server rejected the credentials, here the token.
Q4. Why do you need MIB files for Telegraf’s SNMP plugin?
- To encrypt SNMP traffic
- To translate names like IF-MIB::ifName into numeric OIDs
- To open UDP port 161
- To store the results
Show answer
B — MIBs map names to numeric OIDs; without them, named OIDs can’t be translated.
Q5. A typo in the Telegraf database name causes what in InfluxDB 3 Core?
- A 404 error in Telegraf
- Telegraf stops
- A new database is created silently
- InfluxDB refuses all writes
Show answer
C — Writes create databases automatically, so the data lands in a new, misspelt database.
Quick recap
- InfluxDB 3 Core runs on graf01 port 8181 with a telegraf database (30 day retention) and named admin tokens for Telegraf and Grafana.
- Telegraf on app01 sends cpu, mem, disk, net and system metrics through outputs.influxdb_v3, with the token in a root-only environment file.
- snmpd on app01 plays a tower router, and inputs.snmp polls ifXTable with the gosmi translator and MIBs in /usr/share/snmp/mibs.
- Grafana queries InfluxDB with SQL using $__timeFilter and $__dateBin, and turns counters into bits per second with LAG().
- 401 tokens, UDP timeouts, missing MIBs and auto-created misspelt databases are the four failures to recognise.
Next lesson
Lesson 11: Grafana alerting: rules, contact points and policies → You build Grafana-managed alert rules for high CPU and a dead server, send them by email through Mailpit, and route them with notification policies.
Further reading: Grafana InfluxDB Telegraf
Want to go deeper into Grafana InfluxDB Telegraf? InfluxData’s guides to installing InfluxDB 3 Core and admin tokens, the Telegraf SNMP input and InfluxDB v3 output READMEs, and Grafana’s InfluxDB data source page cover every setting used here. If SNMP is your main interest, the Zabbix monitoring course covers it from the Zabbix side, and Linux performance monitoring explains the CPU and memory numbers.
You can also see the full plan for this course on the Grafana Dashboards and Observability course page.
