MySQL in Grafana: time series and table queries
-
Phase 1: Grafana setup and your first dashboards
-
Phase 2: Data sources, logs and metrics
-
Phase 3: Alerting, teams and running Grafana
The Grafana MySQL data source lets you put business numbers (orders per hour, revenue by city, cancelled orders) on the same screen as CPU and memory graphs. In this lesson you install MySQL 8 on app01, load a small online-shop database called shopdb, give Grafana a read-only login, and build time series, table, bar chart and pie chart panels from plain SQL.
You’ll use the macros that make SQL time-aware, such as $__timeFilter and $__timeGroupAlias, and you’ll meet the timezone problem that makes every Indian team’s graphs look five and a half hours off at least once.
Where this lesson fits
Lesson 6 of 14 in Grafana Dashboards and Observability · Phase 2: Data sources, logs and metrics · Before this: Lesson 5, dashboard variables · Next: Lesson 7, logs with Loki and Alloy
| Time | You need | By the end you can |
|---|---|---|
| About 85 minutes | graf01 and app01 from Lesson 5, about 400 MB of free disk on app01 | Connect Grafana to MySQL safely and build time series and non-time-series panels from SQL, with correct time zones |
What it is, in one line
The MySQL data source lets Grafana run SELECT queries against a MySQL database and draw the rows as time series when there is a time column, or as tables, bars and pies when there isn’t.
In Simple Words
The kirana shop ledger
The kirana shop near your house writes every sale in a ledger: date and time, item, quantity, amount. At the end of the month the owner’s son wants a chart of sales per day for the festival week, so he doesn’t rewrite the ledger, he reads it and counts.
He only needs to read, so the owner gives him the ledger but keeps the pen. MySQL is the ledger, Grafana is the son counting sales, and the read-only database user is “you can read but you can’t write”.
Engineer's View
How the MySQL data source works
The MySQL plugin runs inside the Grafana server and connects with the Go MySQL driver to host:port, with the connection option loc=UTC and parseTime=true. Grafana expands its macros into plain SQL, sends the query, and converts the result rows into data frames. Since Grafana 13 the plugin ships separately from the core code and is updated on its own, but it is installed with Grafana.
| Macro | Expands to (MySQL) | Use |
|---|---|---|
| $__timeFilter(created_at) | created_at BETWEEN FROM_UNIXTIME(1794099600) AND FROM_UNIXTIME(1794121200) | Only rows inside the dashboard time range |
| $__timeGroupAlias(created_at, 1h) | UNIX_TIMESTAMP(created_at) DIV 3600 * 3600 AS “time” | Buckets rows into time slots and names the column time |
| $__timeGroup(created_at, $__interval) | The same bucket expression without the alias | When you want your own alias or GROUP BY |
| $__timeFrom() / $__timeTo() | FROM_UNIXTIME(…) for the range ends | Custom conditions, for example on a second column |
| $__unixEpochFilter(col) | col >= 1794099600 AND col <= 1794121200 | Tables that store epoch seconds in an integer column |
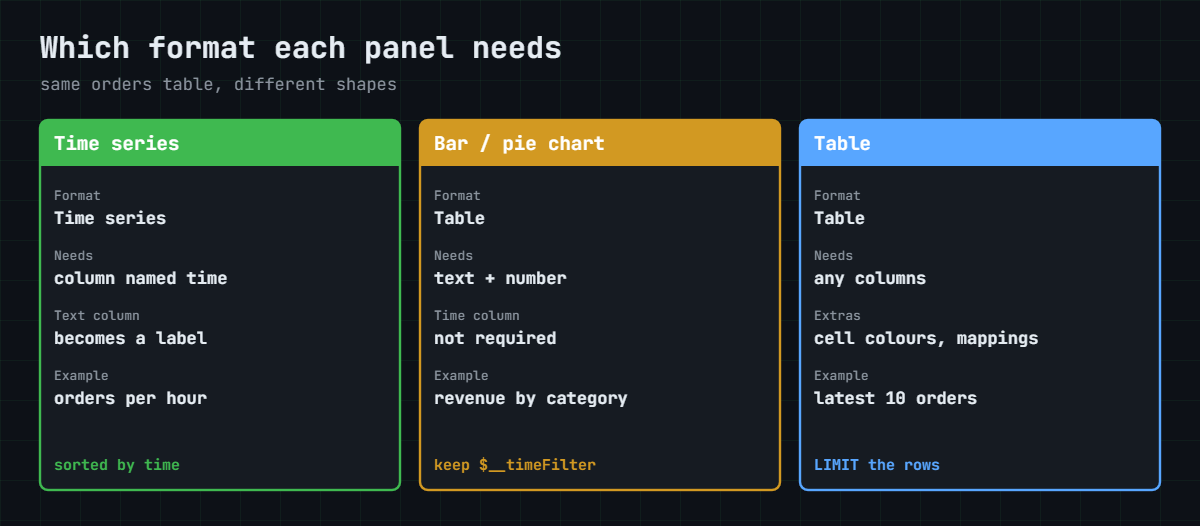
There are two result formats. Time series needs a column called time (a datetime or epoch seconds), sorted by time, plus numeric value columns; a text column becomes a label, so one query can draw one line per city. Table takes any result and is what bar charts, pie charts and tables use when the data has no time axis.
How it works, step by step
1Grafana connects as a read-only user
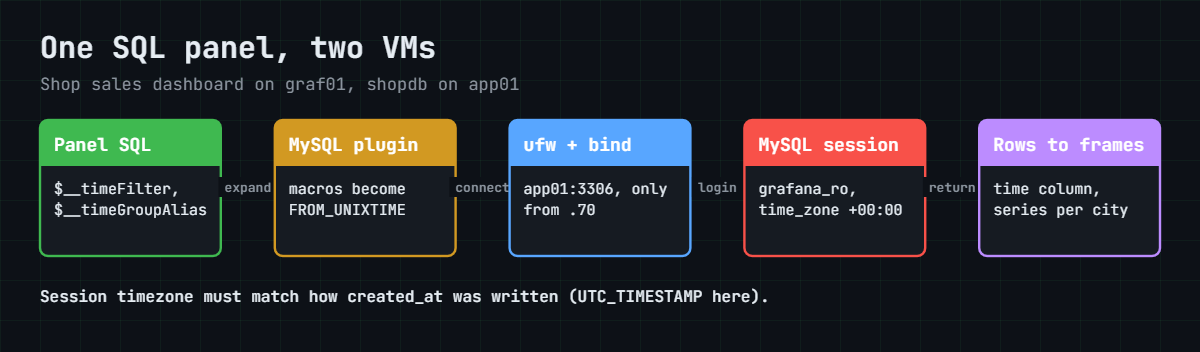
The data source stores host 192.168.56.71:3306, database shopdb, user grafana_ro and its password, encrypted in grafana.db. MySQL on app01 listens on the host-only address and ufw lets only graf01 in. The diagram below follows one panel query across both VMs.
2Macros become plain SQL
Before sending the query, Grafana replaces $__timeFilter(created_at) with a BETWEEN clause using the dashboard’s from and to times as UNIX seconds, and $__timeGroupAlias(created_at, $__interval) with an integer division that rounds every row down to its time bucket.
3MySQL runs it with the session time zone
FROM_UNIXTIME() and UNIX_TIMESTAMP() convert between epoch seconds and DATETIME using the session time zone. Grafana’s driver doesn’t set one unless you fill in “Session timezone” on the data source, so the server default applies, and that’s where IST vs UTC trouble starts.
4Rows become frames, frames become panels
With Format = Time series, Grafana groups rows by the text columns and builds one series per city or status. With Format = Table, the rows go to the panel as they are, and the visualisation decides: a bar chart wants one text column and one or more numbers, a pie chart wants a value per slice. The second diagram compares the shapes each panel type needs.
5Keep the database safe and the queries cheap
Grafana runs every panel query again on each refresh for every viewer, so a dashboard with ten panels refreshing every 30 seconds for twenty people means about 400 queries a minute. Index the time column, filter with $__timeFilter so queries only touch the visible range, and point Grafana at a read replica when the main database is busy.
| Protection | How | Why |
|---|---|---|
| Read-only user | GRANT SELECT ON shopdb.* only | A typo or a malicious query can’t change data |
| Network limit | bind-address on the host-only IP, ufw from 192.168.56.70 | Only graf01 can even try to log in |
| Index on the time column | INDEX idx_created_at (created_at) | $__timeFilter becomes a range scan, not a full table scan |
| Row limit | [dataproxy] row_limit in grafana.ini (default 1000000) | Stops a careless SELECT * from eating memory |
| Replica | Point the data source at a replica | Heavy dashboards don’t slow the shop’s checkout |
Hands-on lab: shopdb on app01 and a Shop sales dashboard
Before you run any command, double-check it
Read every command twice before you press Enter. Check the target: the server name, the user, the disk or device name, the path and the sizes. These commands are for learning and were tested in our lab, not on your system. At work, run the read-only commands first, follow your change process, make sure a backup exists, and ask a second person to check anything that changes or deletes data. You run them at your own risk.
MySQL goes on app01, Grafana stays on graf01. Commands say which VM they run on. The database is a small online shop selling block-print kurtas and blue pottery mugs, with about a week of orders and one new order every minute.
1Install MySQL 8 on app01
Run this on app01:
sudo apt-get update
sudo apt-get install -y mysql-server
mysqld --version
systemctl is-active mysqlOn Ubuntu 26.04 you should see:
/usr/sbin/mysqld Ver 8.4.11-0ubuntu0.26.04.1 for Linux on x86_64 ((Ubuntu))
activeUbuntu 26.04 ships MySQL 8.4 LTS, and 24.04 ships MySQL 8.0 (its line reads Ver 8.0.46-0ubuntu0.24.04.4 or a later 8.0 release). Every command in this lesson works on both. On Ubuntu the MySQL root account uses socket authentication, so sudo mysql logs you in as root without a password.
✅ Checkpoint: The version check prints an 8.x version and the mysql service is active on app01.
2Create shopdb with a week of orders
Paste this whole block on app01:
sudo mysql <<'SQL'
CREATE DATABASE IF NOT EXISTS shopdb;
USE shopdb;
CREATE TABLE products (
id INT AUTO_INCREMENT PRIMARY KEY,
name VARCHAR(60) NOT NULL,
category VARCHAR(30) NOT NULL,
price DECIMAL(10,2) NOT NULL
);
CREATE TABLE orders (
id BIGINT AUTO_INCREMENT PRIMARY KEY,
created_at DATETIME NOT NULL,
product_id INT NOT NULL,
city VARCHAR(30) NOT NULL,
qty INT NOT NULL,
amount DECIMAL(10,2) NOT NULL,
status ENUM('paid','shipped','cancelled') NOT NULL DEFAULT 'paid',
INDEX idx_created_at (created_at),
FOREIGN KEY (product_id) REFERENCES products(id)
);
INSERT INTO products (name, category, price) VALUES
('Block print kurta', 'Clothing', 899.00),
('Blue pottery mug', 'Home', 349.00),
('Leather mojari', 'Footwear', 1299.00),
('Bandhani dupatta', 'Clothing', 649.00),
('Brass diya set', 'Home', 499.00);
-- About 7 days of history: one order every 10 minutes (1000 rows), times in UTC
INSERT INTO orders (created_at, product_id, city, qty, amount, status)
WITH RECURSIVE t(n) AS (SELECT 1 UNION ALL SELECT n + 1 FROM t WHERE n < 1000)
SELECT UTC_TIMESTAMP() - INTERVAL n*10 MINUTE,
1 + FLOOR(RAND()*5),
ELT(1 + FLOOR(RAND()*4), 'Jaipur', 'Delhi', 'Mumbai', 'Pune'),
1 + FLOOR(RAND()*3),
0,
ELT(1 + FLOOR(RAND()*10), 'paid','paid','paid','paid','paid','shipped','shipped','shipped','shipped','cancelled')
FROM t;
UPDATE orders o JOIN products p ON p.id = o.product_id SET o.amount = p.price * o.qty;
SQL
sudo mysql shopdb -e "SELECT COUNT(*) FROM orders; SELECT status, COUNT(*) FROM orders GROUP BY status;"You should see (your status counts will differ):
COUNT(*)
1000
status COUNT(*)
cancelled 86
shipped 412
paid 502Your status counts differ because RAND() picks them, but the total is always 1000. Every created_at is written with UTC_TIMESTAMP(), so the table holds UTC times; keep that in mind for the Break It section.
✅ Checkpoint: shopdb.orders has 1000 rows on app01, with paid, shipped and cancelled statuses.
3Add one new order every minute with the event scheduler
Run this on app01:
sudo mysql shopdb <<'SQL'
CREATE EVENT IF NOT EXISTS ev_new_order
ON SCHEDULE EVERY 1 MINUTE
DO
INSERT INTO orders (created_at, product_id, city, qty, amount, status)
SELECT UTC_TIMESTAMP(), p.id, ELT(1 + FLOOR(RAND()*4), 'Jaipur','Delhi','Mumbai','Pune'), 1, p.price, 'paid'
FROM products p ORDER BY RAND() LIMIT 1;
SQL
sleep 65
sudo mysql shopdb -e "SELECT @@event_scheduler; SELECT id, created_at, city, amount FROM orders ORDER BY id DESC LIMIT 2;"You should see (your IDs, times, cities and amounts will differ):
@@event_scheduler
ON
id created_at city amount
1002 2026-11-08 06:42:44 Mumbai 649.00
1001 2026-11-08 06:41:44 Pune 349.00The event scheduler is on by default in MySQL 8, so the event starts firing at once. Your shop now has live data, and a “Last 15 minutes” graph keeps moving.
✅ Checkpoint: Two new rows appear one minute apart and @@event_scheduler shows ON.
4Create the read-only user grafana_ro
Run this on app01 (choose your own password):
sudo mysql <<'SQL'
CREATE USER 'grafana_ro'@'192.168.56.70' IDENTIFIED BY 'Ro-Pass-2026';
GRANT SELECT ON shopdb.* TO 'grafana_ro'@'192.168.56.70';
SHOW GRANTS FOR 'grafana_ro'@'192.168.56.70';
SQLYou should see:
Grants for grafana_ro@192.168.56.70
GRANT USAGE ON *.* TO `grafana_ro`@`192.168.56.70`
GRANT SELECT ON `shopdb`.* TO `grafana_ro`@`192.168.56.70`The host part @192.168.56.70 means this account can only log in from graf01. USAGE is MySQL’s word for “no global privileges”, and SELECT on shopdb.* is the only real right it has.
✅ Checkpoint: SHOW GRANTS lists USAGE on *.* and SELECT on shopdb.* for grafana_ro@192.168.56.70.
5Let MySQL listen on the host-only network, for graf01 only
Ubuntu’s MySQL listens on 127.0.0.1 only (bind-address = 127.0.0.1 in /etc/mysql/mysql.conf.d/mysqld.cnf). Change it to app01’s host-only address and open port 3306 to graf01 alone.
Run this on app01:
sudo sed -i 's/^bind-address.*/bind-address = 192.168.56.71/' /etc/mysql/mysql.conf.d/mysqld.cnf
sudo systemctl restart mysql
sudo ss -ltnp | grep 3306
sudo ufw allow from 192.168.56.70 to any port 3306 proto tcp
sudo ufw status | grep 3306You should see (your PID will differ):
LISTEN 0 151 192.168.56.71:3306 0.0.0.0:* users:(("mysqld",pid=5120,fd=23))
3306/tcp ALLOW 192.168.56.70Then test from graf01:
sudo apt-get install -y mysql-client
mysql -h 192.168.56.71 -u grafana_ro -p shopdb -e "SELECT COUNT(*) FROM orders;"Enter password:
COUNT(*)
1003The login works from graf01 with SELECT rights. sudo mysql on app01 still works too, because it uses the local socket, not the network address.
✅ Checkpoint: mysql from graf01 as grafana_ro returns the order count, and ss on app01 shows mysqld on 192.168.56.71:3306.
6Add the MySQL data source in Grafana
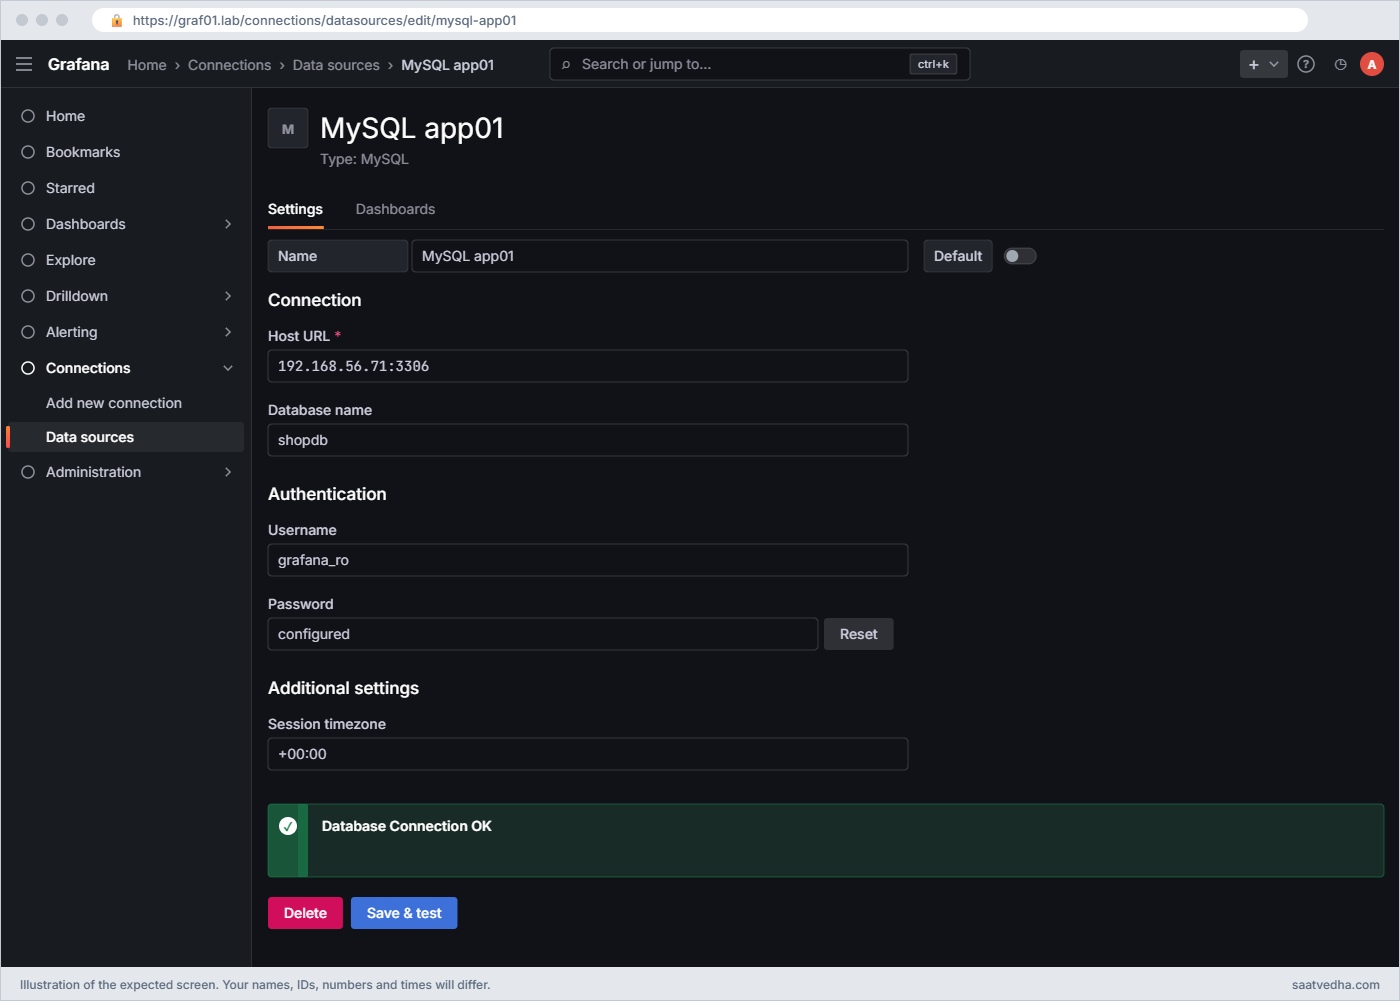
In Grafana open Connections > Data sources > Add new data source > MySQL and fill in:
| Field | Value |
|---|---|
| Name | MySQL app01 |
| Host URL | 192.168.56.71:3306 |
| Database name | shopdb |
| Username / Password | grafana_ro / your password |
| Session timezone | +00:00 |
| Max open / idle connections | 10 / 5 (defaults are fine) |
Write the host as host:port without mysql:// or http://. Click Save & test; you should see Database Connection OK. Setting the session timezone to UTC matches how the table stores times, and the Break It section shows what happens without it.
✅ Checkpoint: Save & test on “MySQL app01” shows Database Connection OK.
7Orders per hour as a time series
Create a new dashboard Shop sales in folder SaatVedha Lab. Add a panel, choose MySQL app01, switch the editor from Builder to Code, set Format to Time series and paste:
SELECT
$__timeGroupAlias(created_at, 1h),
COUNT(*) AS orders,
SUM(amount) AS revenue
FROM orders
WHERE $__timeFilter(created_at)
AND status <> 'cancelled'
GROUP BY 1
ORDER BY 1Set the time range to Last 6 hours and press Ctrl+Enter (Cmd+Return on a Mac). You get two lines, orders and revenue. Move revenue to the right axis with an override (Fields with name: revenue, Axis > Placement: Right, Unit: Currency > Indian Rupee (₹)) so the small order counts aren’t flattened.
Title it Orders and revenue per hour.
The same query as Grafana sends it, run by hand on graf01 (macros expanded for the last 6 hours):
F=$(date -u -d '-6 hours' +%s); T=$(date -u +%s)
mysql -h 192.168.56.71 -u grafana_ro -p shopdb -e "
SELECT UNIX_TIMESTAMP(created_at) DIV 3600 * 3600 AS \"time\", COUNT(*) AS orders, SUM(amount) AS revenue
FROM orders WHERE created_at BETWEEN FROM_UNIXTIME($F) AND FROM_UNIXTIME($T) AND status <> 'cancelled'
GROUP BY 1 ORDER BY 1;"The output looks like this, with your own times and numbers, because RAND() made the orders:
time orders revenue
1794099600 4 5794.00
1794103200 5 9188.00
1794106800 5 6842.00
1794110400 6 14134.00
1794114000 6 9588.00
1794117600 2 1396.00The time column holds epoch seconds rounded to the hour, which is what the macro produces. Open the panel’s Query inspector > Query tab and you’ll see Grafana’s own expanded SQL looks the same.
✅ Checkpoint: The panel shows orders and revenue per hour for the last 6 hours, with revenue on a right-hand rupee axis.

8One line per city, using $__interval
Add another time series panel. A text column in a time series query becomes a label, so this draws one line per city:
SELECT
$__timeGroupAlias(created_at, $__interval),
city,
COUNT(*) AS orders
FROM orders
WHERE $__timeFilter(created_at)
GROUP BY 1, 2
ORDER BY 1In the panel’s Query options set Min interval to 10m, because new rows arrive every minute and history every 10 minutes; smaller buckets would be full of zeros and ones. Zoom out to 7 days and the buckets grow by themselves through $__interval.
✅ Checkpoint: The panel shows four lines named Jaipur, Delhi, Mumbai and Pune, and the bucket size changes when you change the time range.
9Panels without a time axis: table, bar chart, pie chart
Add three panels with Format: Table. They still filter with $__timeFilter so they follow the time picker, but they don’t return a time column.
| Panel | Visualisation | SQL |
|---|---|---|
| Revenue by category | Bar chart | SELECT p.category, SUM(o.amount) AS revenue FROM orders o JOIN products p ON p.id = o.product_id WHERE $__timeFilter(o.created_at) AND o.status <> ‘cancelled’ GROUP BY p.category ORDER BY revenue DESC |
| Orders by status | Pie chart | SELECT status, COUNT(*) AS orders FROM orders WHERE $__timeFilter(created_at) GROUP BY status |
| Latest 10 orders | Table | SELECT o.created_at, p.name, o.city, o.qty, o.amount, o.status FROM orders o JOIN products p ON p.id = o.product_id ORDER BY o.id DESC LIMIT 10 |
For the pie chart set Value options > Show to All values, so each row becomes a slice. For the table, add a Cell type: Colored text override on status with value mappings paid = green, shipped = blue, cancelled = red.
Check the bar chart numbers on graf01 (last 6 hours):
mysql -h 192.168.56.71 -u grafana_ro -p shopdb -e "
SELECT p.category, SUM(o.amount) AS revenue FROM orders o JOIN products p ON p.id=o.product_id
WHERE o.created_at BETWEEN FROM_UNIXTIME($F) AND FROM_UNIXTIME($T) AND o.status<>'cancelled'
GROUP BY p.category ORDER BY revenue DESC;"The output looks like this (your amounts will differ):
category revenue
Footwear 22083.00
Clothing 14432.00
Home 10427.00
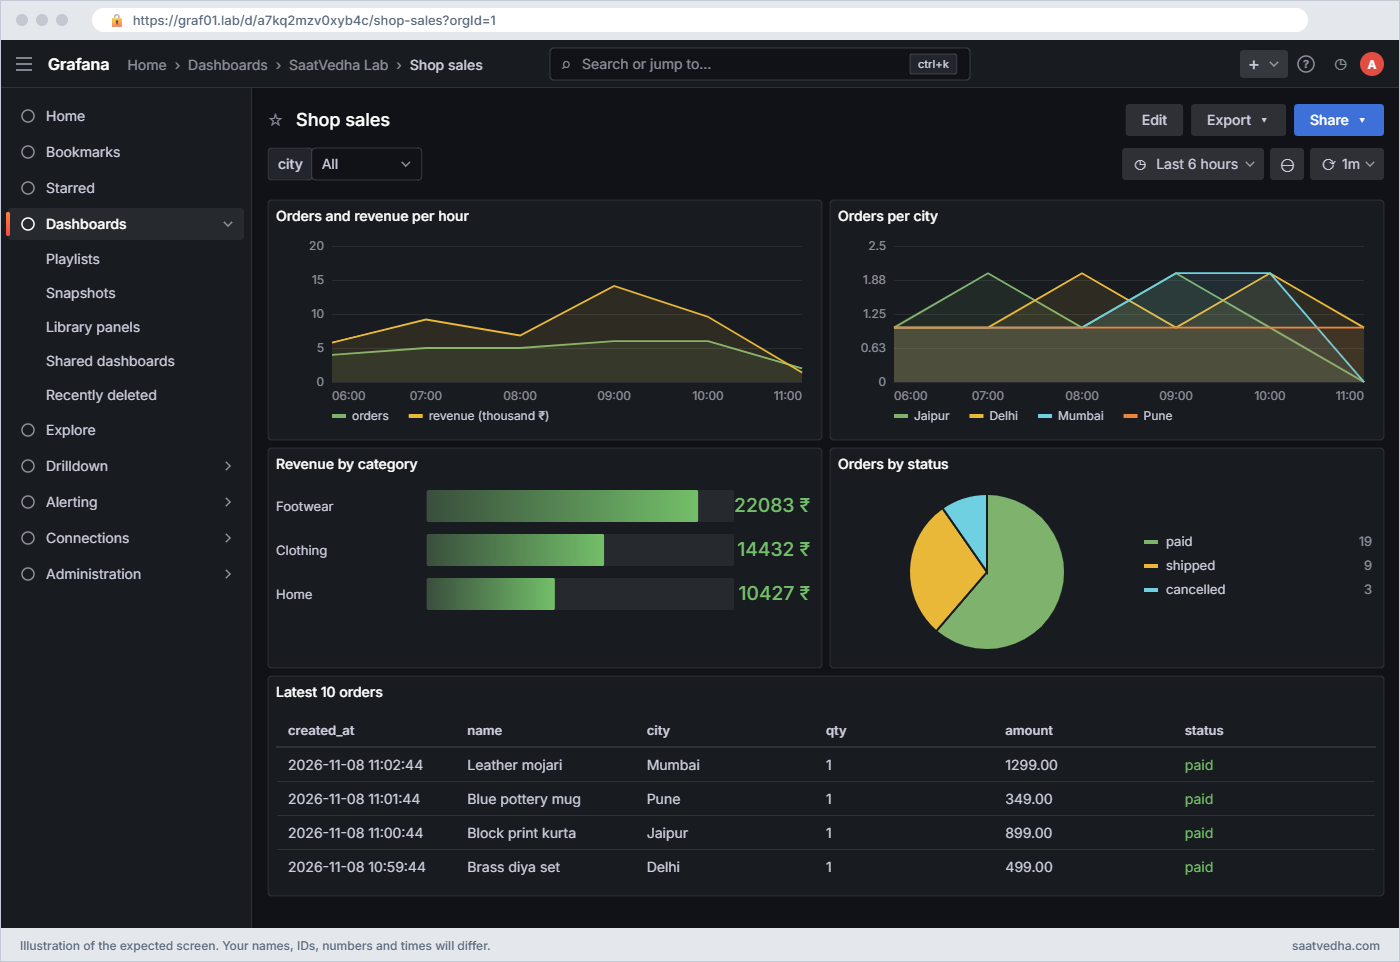
✅ Checkpoint: Shop sales has five panels: two time series, a bar chart, a pie chart and a coloured latest-orders table.
10Try the SQL builder and a city variable
Add a Query variable city on MySQL app01 with the query SELECT DISTINCT city FROM orders ORDER BY city, Multi-value and Include All on. In the per-city panel add AND city IN ($city) to the WHERE clause; for SQL data sources Grafana formats a multi-value selection as a quoted, comma-separated list, so IN works directly.
Then open a new panel and stay in Builder mode: pick table orders, column amount with aggregation SUM, filter status != cancelled and group by city. Click Code to see the SQL the builder wrote. The builder is fine for quick questions, while Code is better for joins and macros.
✅ Checkpoint: Picking Jaipur and Pune in the City drop-down leaves only those two lines in the per-city panel.
Break It, Then Fix It
All three are common tickets when a team first connects Grafana to a database. Each one is safe to try on these VMs.
1Access denied for user
On the data source page, change the password to something wrong and click Save & test. Then put the right password back but change the user to grafana_rw.
You’ll get this error in Grafana:
[auth] MySQL rejected the configured account. Verify the username, password, and account access. MySQL error number: 1045.The same failure from the command line on graf01:
mysql -h 192.168.56.71 -u grafana_ro -pWrongPass shopdb -e "SELECT 1"mysql: [Warning] Using a password on the command line interface can be insecure.
ERROR 1045 (28000): Access denied for user 'grafana_ro'@'192.168.56.70' (using password: YES)Error 1045 means MySQL found no account matching that user, host and password. The host part counts: if you created grafana_ro@localhost by mistake, graf01 can never log in as it, however correct the password is. Older plugin versions show the raw driver message “Error 1045 (28000): Access denied for user …” instead of the [auth] text; the number is what matters.
Fix: check the account and host on app01, then re-enter the password in Grafana:
sudo mysql -e "SELECT user, host FROM mysql.user WHERE user LIKE 'grafana%';"user host
grafana_ro 192.168.56.70✅ Checkpoint: Save & test shows Database Connection OK again with user grafana_ro.
2“db has no time column”
Edit the orders-per-hour panel and give the time column a different alias, as people do when they copy SQL from a report:
SELECT
$__timeGroup(created_at, 1h) AS hour_bucket,
COUNT(*) AS orders
FROM orders
WHERE $__timeFilter(created_at)
GROUP BY 1
ORDER BY 1You’ll get this error on the panel:
db has no time column: time column is missing; make sure your data includes a time column for time series format or switch to a table format that doesn't require itWith Format = Time series, Grafana looks for a column named time (or the old time_sec). $__timeGroupAlias adds AS "time" for you, while $__timeGroup plus your own alias doesn’t. A query that genuinely has no time axis, such as revenue by category, should use Format = Table instead.
Fix: name the column time, or use the Alias macro:
SELECT $__timeGroupAlias(created_at, 1h), COUNT(*) AS orders
FROM orders WHERE $__timeFilter(created_at) GROUP BY 1 ORDER BY 1✅ Checkpoint: The panel draws orders per hour again without an error.
3Everything is 5 hours 30 minutes off
A colleague sets Session timezone on the data source to +05:30 “because we’re in India”. Save, then look at the Last 1 hour view of the per-city panel.
You’ll get this:
Last 1 hour: No data
Last 12 hours: the newest orders appear about 5.5 hours in the pastThe table stores UTC wall-clock times in a DATETIME column, which has no time zone of its own. Grafana sends the range as epoch seconds, and with an IST session MySQL turns those into IST wall-clock times, so the filter looks for rows dated 11:13 to 12:13 while the newest row says 06:42. The same thing happens the other way round when an application writes NOW() on a server set to IST and Grafana reads it as UTC.
See it on app01 with the same epoch range in both session zones:
F=$(date -u -d '-1 hour' +%s); T=$(date -u +%s)
for tz in '+00:00' '+05:30'; do
sudo mysql shopdb -e "SET time_zone='$tz'; SELECT '$tz' AS session_tz, COUNT(*) AS orders_last_hour,
FROM_UNIXTIME($F) AS range_from FROM orders WHERE created_at BETWEEN FROM_UNIXTIME($F) AND FROM_UNIXTIME($T);"
donesession_tz orders_last_hour range_from
+00:00 66 2026-11-08 05:43:37
session_tz orders_last_hour range_from
+05:30 0 2026-11-08 11:13:37Fix: make the session zone match how the column was written:
Data source > Session timezone: +00:00 (rows written with UTC_TIMESTAMP())
Dashboard settings > Time zone: Browser Time (people still see IST on screen)Store times in UTC, tell the data source the column is UTC, and let the dashboard show the viewer’s local time. If an existing application writes IST, set the session timezone to +05:30 instead; the rule is “match the writer”, not “match the office”.
✅ Checkpoint: Last 1 hour shows the newest orders again, and the time axis shows IST in your browser.
This happened at work
The sales dashboard that said the shop closed at 6:30
A friend who was the only DevOps engineer at an e-commerce startup in Jaipur had this in her first month. The founders loved the new Grafana sales board on the office TV, until the head of operations pointed out that it showed zero orders after 6:30 pm every evening, the exact hours when most of their customers shopped.
She first thought the event that copied orders into the reporting database was failing at night, and spent an evening reading its logs, which were clean. Then she checked the reporting tables directly with SELECT MAX(created_at) and found orders up to 11:45 pm, so the data was there and Grafana wasn’t showing it.
The cause was two different time zones. The application server ran in IST and wrote NOW() into DATETIME columns, while Grafana’s MySQL connection assumed UTC. Every order appeared five and a half hours late, so “now” on the graph was in fact 6:30 pm, and everything after that sat in the future, off the right edge of the panel.
She set the data source’s session timezone to +05:30 as a quick fix that same evening, and the TV filled in. The lasting change took a sprint: the developers moved the application to write UTC timestamps, the session timezone went back to UTC, and the team added a “latest order age” stat panel that turns red if the newest row is more than ten minutes old.
Common mistakes and troubleshooting
| Mistake | What happens | What to do instead |
|---|---|---|
| Connecting Grafana as root or the app user | A wrong query or a stolen Grafana password can change or delete data | Create a user with SELECT only on the database Grafana needs |
| Creating the user for localhost only | Access denied 1045 from the Grafana server | Create the user for the Grafana server’s IP, for example grafana_ro@192.168.56.70 |
| Leaving bind-address on 127.0.0.1 | Grafana gets “connection refused” from the other VM | Bind to the internal IP and restrict port 3306 with the firewall |
| No $__timeFilter in the WHERE clause | Every refresh scans the whole table and the time picker does nothing | Always filter time series and summaries with $__timeFilter(col) |
| No index on the time column | Dashboards get slower as the table grows | Index created_at (or whatever column you filter on) |
| Mixing IST and UTC between writer and reader | Graphs shifted 5.5 hours, “No data” for recent ranges | Store UTC and set the data source session timezone to match the writer |
| Using Time series format for category totals | “db has no time column” error | Use Format: Table for bar charts, pie charts and tables without a time axis |
Interview questions
Click a question to open it. Each one is written the way an interviewer would ask it. Under it you will see why they ask it and one way you could answer, in your own words.
Fresher level
1. How would you connect Grafana to a production MySQL database safely?
Why they ask this: They want least privilege and network thinking, not only “add the data source”.
How you might answer: I create a dedicated user like grafana_ro with SELECT only on the needed database and limit it to the Grafana server’s IP. MySQL listens only on the internal address and the firewall allows port 3306 from Grafana alone.
If the database is busy I point Grafana at a read replica, and I make sure the time columns used in dashboards are indexed.
2. What does $__timeFilter do in a Grafana SQL query?
Why they ask this: A basic macro check.
How you might answer: It expands into a condition on the column I pass, like created_at BETWEEN FROM_UNIXTIME(start) AND FROM_UNIXTIME(end), using the dashboard’s time range. That way the query only reads rows in the visible range and follows the time picker.
2–5 years experience
3. A MySQL time series panel says “db has no time column”. Walk me through fixing it.
Why they ask this: They want you to know the format rules for SQL time series.
How you might answer: With Format set to Time series, Grafana needs a column named time holding a datetime or epoch seconds, sorted by time. Usually someone used $__timeGroup with their own alias, so I switch to $__timeGroupAlias or add AS “time”.
If the query has no time axis at all, like revenue by category, I set Format to Table and use a bar chart or pie chart instead.
4. Your MySQL graphs are shifted by five and a half hours. How do you find the cause?
Why they ask this: They’re checking that you understand DATETIME, session time zones and Grafana’s UTC handling.
How you might answer: I check how the application writes the column, NOW() on a server in IST or UTC_TIMESTAMP(), and compare SELECT MAX(created_at) with UTC_TIMESTAMP(). Then I look at the data source’s Session timezone, because FROM_UNIXTIME uses the session zone to build the filter.
The fix is to make the session zone match the writer, ideally UTC everywhere, and let the dashboard display Browser Time for the viewers.
Senior level
5. A business team wants live sales dashboards straight from the production orders database. What do you advise?
Why they ask this: They want trade-offs: load, safety, freshness and alternatives.
How you might answer: I’d start with a read replica and a read-only user so dashboards can’t affect checkout, plus indexes on the time columns and sensible refresh intervals. For heavy summaries I’d add small summary tables or materialised rollups refreshed every few minutes, so panels read hundreds of rows instead of millions.
I’d also add query caching or longer intervals for wall screens, and a data freshness panel so people trust what they see.
6. When would you choose a SQL data source in Grafana over exporting the same numbers to Prometheus?
Why they ask this: A design judgement question.
How you might answer: SQL is right when the truth already lives in the database and people want flexible slicing, like revenue by city and product for any date range, or tables of recent records. Prometheus is better for high-frequency operational numbers, alerting with labels and long series of counters.
Often I use both: an exporter or the app publishes order rates and error counts to Prometheus for alerting, and SQL panels answer business questions on the same dashboard.
Quick quiz
Q1. What does $__timeGroupAlias(created_at, 1h) add compared with $__timeGroup?
- A WHERE clause
- The alias AS “time”
- An ORDER BY
- A LIMIT
Show answer
B — The Alias version names the bucket column time, which time series format needs.
Q2. Which privilege should grafana_ro have on shopdb?
- ALL PRIVILEGES
- SELECT only
- SELECT and DELETE
- SUPER
Show answer
B — Grafana only reads, so SELECT is enough.
Q3. MySQL error 1045 when testing the data source means:
- The database does not exist
- No account matches that user, host and password
- The query is too slow
- The time column is missing
Show answer
B — 1045 is Access denied for user.
Q4. A pie chart of orders by status should use which format?
- Time series
- Table
- Logs
- Trace
Show answer
B — Category totals have no time axis, so Table format is right.
Q5. Rows are written with UTC_TIMESTAMP(). What should the data source Session timezone be?
- +05:30
- +00:00
- Empty always
- The browser time zone
Show answer
B — Match the zone the writer used; here that is UTC.
Quick recap
- MySQL 8 on app01 listens on 192.168.56.71:3306, and only graf01 can connect, as grafana_ro with SELECT on shopdb.
- The MySQL data source expands macros like $__timeFilter and $__timeGroupAlias into plain SQL using the dashboard time range.
- Time series format needs a time column sorted by time; text columns become one series per value. Table format handles everything else.
- Bar charts, pie charts and tables cover non-time-series business data; keep $__timeFilter so they follow the time picker.
- Store times in UTC, set the session timezone to match the writer, and let dashboards display Browser Time.
Next lesson
Lesson 7: Logs in Grafana with Loki and Alloy → You install Loki on graf01 and Grafana Alloy on both VMs, ship system and application logs, and learn LogQL stream selectors, line filters and parsers in Explore.
Further reading: Grafana MySQL data source
Want to go deeper into Grafana MySQL data source? The Grafana docs for the MySQL data source and its query editor and macros list every option, and the MySQL manual pages on time zone support and the event scheduler explain the behaviour behind the Break It section. For the Linux side of running a database server, see the SaatVedha Linux administration course and Linux performance monitoring.
You can also see the full plan for this course on the Grafana Dashboards and Observability course page.
