Zabbix in Grafana, and Prometheus exporters in Zabbix
-
Phase 1: Zabbix server and agents
-
Phase 2: Items, triggers, templates and dashboards
-
Phase 3: Alerts, proxies, SNMP and automation
The Zabbix Grafana plugin lets you draw Zabbix data in Grafana next to Prometheus, Loki and everything else your team already watches there, without moving a single item out of Zabbix. It talks to the Zabbix API with a token, so Zabbix keeps doing the collecting, triggers and alerts, and Grafana does the pictures.
The second half of this lesson goes the other way: many applications only expose Prometheus metrics, and Zabbix can read them directly. You’ll scrape node_exporter on web01 with one HTTP agent item, pull out values with the “Prometheus pattern” step, and discover filesystems with “Prometheus to JSON”.
Where this lesson fits
Lesson 23 of 24 in Zabbix Monitoring · Phase 3: Alerts, proxies, SNMP and automation · Before this: Lesson 22, Zabbix API with Python · Next: Lesson 24, health, upgrades and troubleshooting
| Time | You need | By the end you can |
|---|---|---|
| About 2 hours | zbx01 and web01 from Lessons 1 to 22; Grafana 13 on graf01 (192.168.56.70) from the Grafana course, or a fresh Grafana on zbx01 (step 1 shows both) | A Zabbix data source in Grafana with a least-privilege token, a dashboard with graphs and a Problems panel, and a host web01-prom in Zabbix fed by node_exporter |
What it is, in one line
The Grafana Zabbix plugin is a Grafana app with a data source that reads Zabbix items, problems and services through the Zabbix API; in the other direction, Zabbix can read any Prometheus /metrics page with an HTTP agent item and Prometheus preprocessing.
In Simple Words
Two newspapers, one reader
In a Kolkata office one manager reads the Telegraph and another reads Anandabazar Patrika, and every morning they argue about which one has the real news. The peon solves it by cutting the important stories from both and pinning them on one notice board.
The papers keep printing as they always did; only the board is shared. And when a new paper starts, the peon learns to read it too instead of asking the paper to change.
Grafana is the notice board, the plugin is the peon reading Zabbix, and the Prometheus pattern step is Zabbix learning to read a new paper.
Engineer's View
How the two directions work
The plugin ID is alexanderzobnin-zabbix-app, maintained by Grafana Labs, current version 6.10.2. It’s an app plugin that bundles a data source (alexanderzobnin-zabbix-datasource), a Problems panel and three example dashboards, and you must enable the app after installing it. Its backend calls api_jsonrpc.php with methods like hostgroup.get, item.get, history.get, trend.get and problem.get.
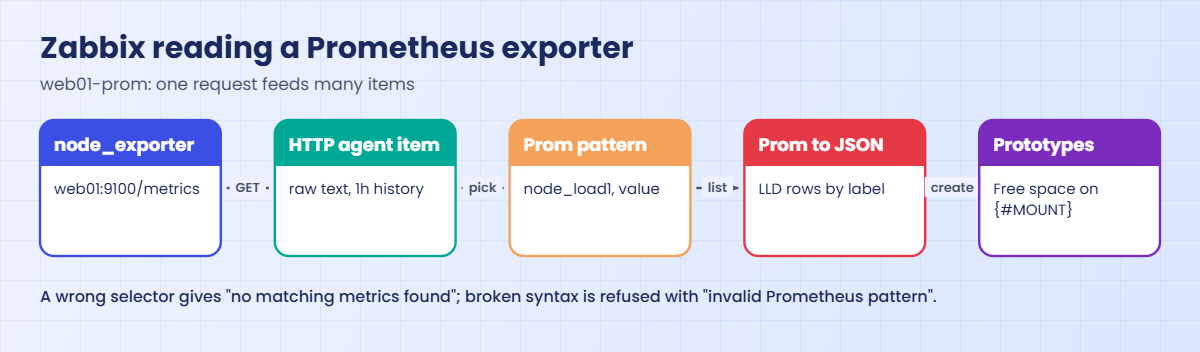
Use plugin 6.10.0 or later with Zabbix 8.0: 8.0’s trend.get no longer accepts sortfield, and older plugins fail on long time ranges with Invalid parameter "/": unexpected parameter "sortfield". For Prometheus data, Zabbix uses one HTTP agent item to fetch the whole /metrics page, then dependent items with the Prometheus pattern step (a PromQL-like selector such as node_filesystem_avail_bytes{mountpoint="/"}) and LLD with Prometheus to JSON.
| Query type in Grafana | Shows | Typical panel |
|---|---|---|
| Metrics | Numeric item history (trends for long ranges) | Time series |
| Text | Character, log and text items | Table, stat |
| Problems | Current or recent problems with severity and tags | Problems panel, table |
| Triggers | Counts of triggers or problems | Stat, bar gauge |
| Item ID | Specific items by their numeric ID | Time series |
| Services / User macros | SLA data, macro values | Stat, table |
Zabbix 8.0 also ships ready templates for this pattern, such as “Linux by Prom”, which expects two host macros, {$NODE_EXPORTER_HOST} and {$NODE_EXPORTER_PORT}.
How it works, step by step
1Grafana asks the plugin backend
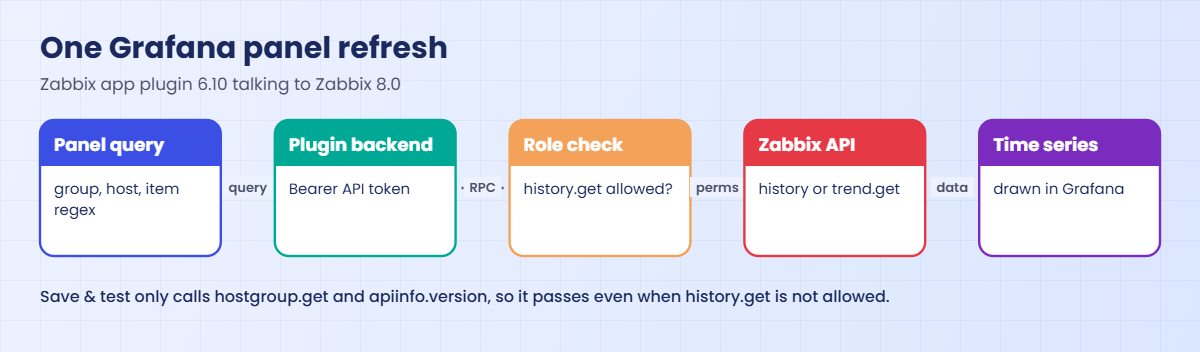
When a dashboard loads, each panel sends its query (group, host, item filter, time range) to Grafana’s server, which hands it to the Zabbix plugin’s backend process. The backend logs in to Zabbix with the API token from the data source, so your browser never talks to Zabbix directly.
2The plugin turns filters into API calls
For a Metrics query it calls hostgroup.get, host.get and item.get to resolve your filters (regex like /CPU utilization/ is allowed), then history.get, or trend.get when the range is older than the “After” setting. The diagram below follows one panel refresh.
3Zabbix applies the token user’s permissions
The token belongs to a Zabbix user, so the plugin sees only that user’s host groups and may call only the methods that user’s role allows. A token that can list host groups but not read history passes “Save & test” and then fails on every graph, which you’ll break on purpose later.
4Zabbix reads a Prometheus page
In the other direction, an HTTP agent item on the Zabbix server polls http://web01:9100/metrics every minute and stores the text only briefly. Dependent items apply the Prometheus pattern step to pick one sample by name and labels, and a discovery rule applies Prometheus to JSON to turn every matching line into an LLD row. The second diagram shows this.
5When to use which
Use the Grafana plugin when the team wants one dashboard tool and Zabbix stays the alerting system. Use Prometheus scraping in Zabbix when an application only offers /metrics and you want Zabbix triggers, maintenance and escalations on it, without running a separate Prometheus server.
| Prometheus step | Parameters | Result |
|---|---|---|
| Prometheus pattern, value | node_load1 | 0.1 |
| Prometheus pattern, value | node_filesystem_avail_bytes{mountpoint=”/”} | 17041027072 |
| Prometheus pattern, label | node_exporter_build_info, label version | 1.12.1 |
| Prometheus pattern, function | sum, avg, min, max, count over matching lines | One number |
| Prometheus to JSON | node_filesystem_avail_bytes{fstype=~”ext4|xfs”} | JSON array with name, value, labels per line |
Hands-on lab: Grafana Zabbix data source and node_exporter in Zabbix
Before you run any command, double-check it
Read every command twice before you press Enter. Check the target: the server name, the user, the disk or device name, the path and the sizes. These commands are for learning and were tested in our lab, not on your system. At work, run the read-only commands first, follow your change process, make sure a backup exists, and ask a second person to check anything that changes or deletes data. You run them at your own risk.
Grafana runs on graf01 (192.168.56.70) if you did the Grafana course; otherwise install it on zbx01 in step 1 and use http://zbx01.lab:3000 wherever the lesson says graf01. node_exporter runs on web01 (192.168.56.81). The Zabbix side was tested on a real 8.0.0 server with node_exporter 1.12.1; Grafana screens are described from plugin 6.10.2 and Grafana 13.3.
1Have Grafana ready
If you have graf01, run this on graf01:
grafana server -v
echo '192.168.56.80 zbx01 zbx01.lab' | sudo tee -a /etc/hosts
curl -sS -o /dev/null -w '%{http_code}\n' -k https://zbx01.lab/api_jsonrpc.phpYou should see this on Grafana 13.3.0:
Version 13.3.0 (commit: 752e3462ff71a43a5c1fb62d00a482fa2dc0ee6a, branch: HEAD)
192.168.56.80 zbx01 zbx01.lab
200The 200 means graf01 can reach the Zabbix frontend over HTTPS through zbx01’s firewall (Lesson 3 allowed 443 from the lab subnet). The -k is only for this reachability test; Grafana will trust the real certificate in step 5.
No graf01? Install Grafana OSS on zbx01 instead:
sudo apt install -y apt-transport-https wget
sudo mkdir -p /etc/apt/keyrings
wget -q -O - https://apt.grafana.com/gpg-full.key | sudo tee /etc/apt/keyrings/grafana.asc >/dev/null
echo "deb [signed-by=/etc/apt/keyrings/grafana.asc] https://apt.grafana.com stable main" | sudo tee /etc/apt/sources.list.d/grafana.list
sudo apt update && sudo apt install -y grafana
sudo systemctl enable --now grafana-server
sudo ufw allow from 192.168.56.0/24 to any port 3000 proto tcp✅ Checkpoint: Grafana 13 is running (graf01 or zbx01) and that machine can reach https://zbx01.lab/api_jsonrpc.php.
2Install and enable the Zabbix app
Run this on the Grafana machine:
sudo grafana cli plugins install alexanderzobnin-zabbix-app
sudo systemctl restart grafana-server
sudo ls /var/lib/grafana/plugins/You should see this (the plugin version may be newer):
✔ Downloaded and extracted alexanderzobnin-zabbix-app v6.10.2 zip successfully to /var/lib/grafana/plugins/alexanderzobnin-zabbix-app
Please restart Grafana after installing or removing plugins. Refer to Grafana documentation for instructions if necessary.
alexanderzobnin-zabbix-appOn Grafana 13 use grafana cli (two words); the old standalone grafana-cli binary is deprecated. Now open Grafana as admin, go to Administration > Plugins and data > Plugins, search Zabbix, open it and click Enable. Installing alone isn’t enough for an app plugin.
✅ Checkpoint: The Zabbix plugin page in Grafana shows version 6.10.x and a Disable button (meaning it is enabled).
3Create a Grafana role and token in Zabbix
Grafana needs more methods than the api-bot role from Lesson 22, mainly history and trends. In Zabbix go to Users > User roles > Create user role: name Grafana read-only, User type User, no UI elements or actions, Access to API Enabled with an Allow list:
hostgroup.get host.get item.get history.get trend.get problem.get trigger.get
event.get valuemap.get proxy.get usermacro.get service.get sla.getCreate user grafana-bot in group API bots (Lab/Web Read, frontend access disabled) with this role, then Users > API tokens > Create API token for grafana-bot with a 90-day expiry. Copy the token. If you plan to graph web01-snmp or web01-prom too, give API bots Read on Lab/Network and add web01-prom to Lab/Web in step 8.
✅ Checkpoint: Zabbix has role “Grafana read-only”, user grafana-bot and a token you have copied.
4Copy the Zabbix CA certificate to the Grafana machine
Run this on zbx01:
cat /etc/ssl/certs/zbx01.lab.crtCopy the whole block, from -----BEGIN CERTIFICATE----- to the END line. Grafana will use it to trust zbx01’s self-signed certificate instead of skipping TLS checks.
✅ Checkpoint: You have the PEM text of zbx01.lab.crt ready to paste.
5Add the Zabbix data source
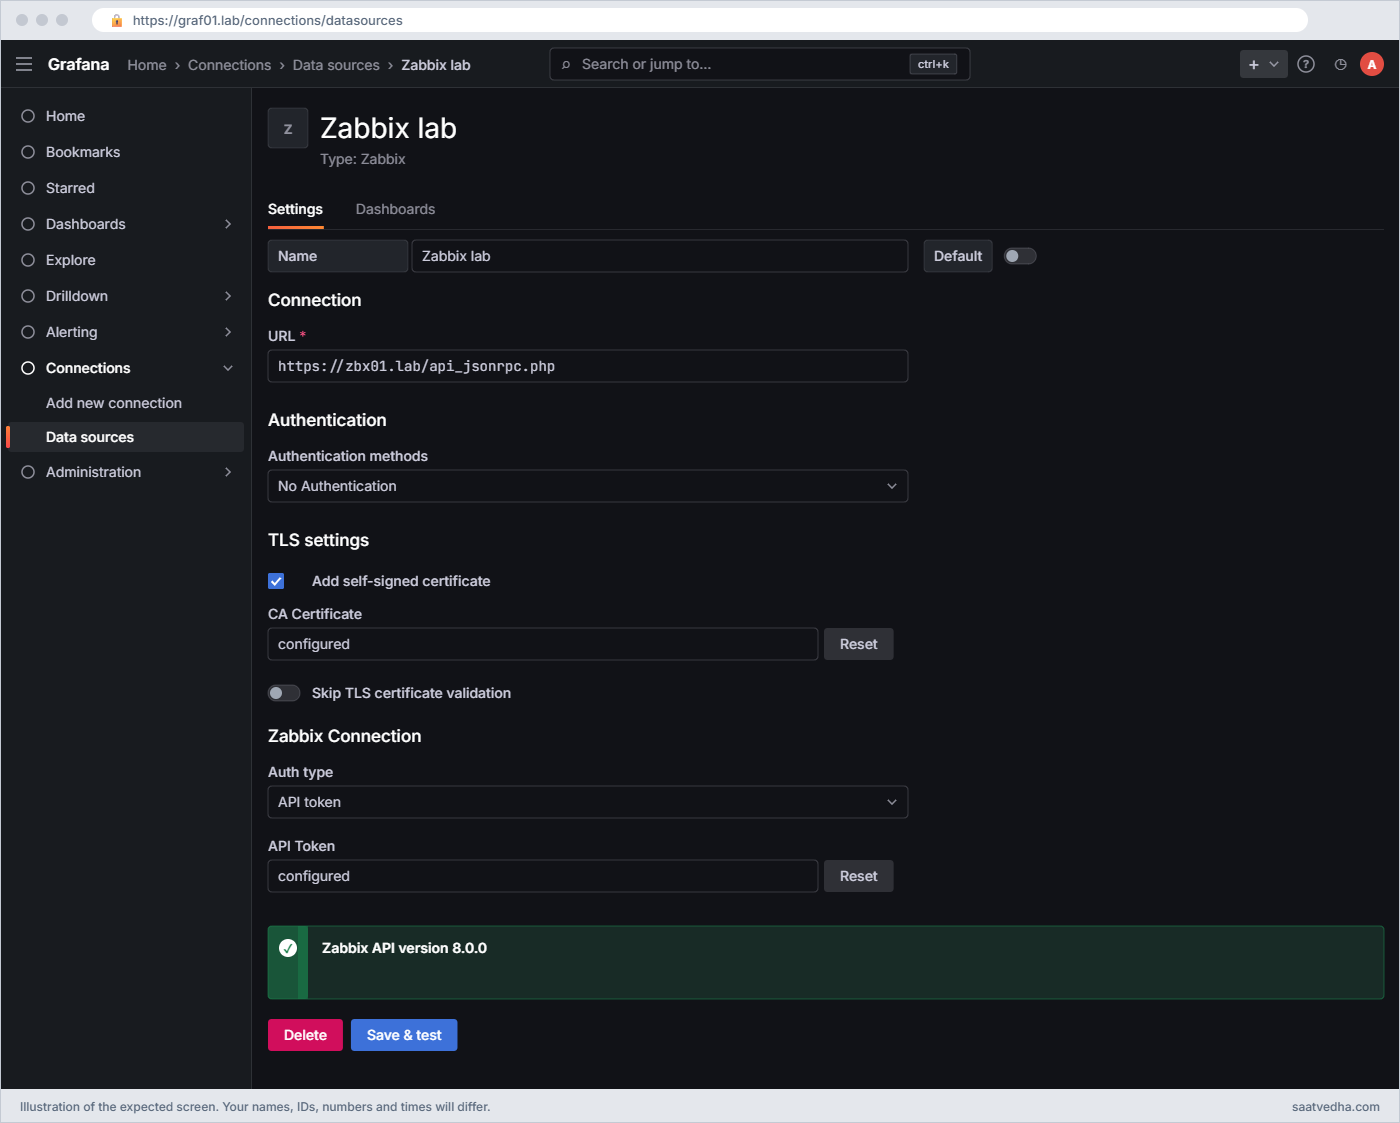
In Grafana open Connections > Add new connection, search Zabbix, click it and then Add new data source. Fill in:
| Field | Value |
|---|---|
| Name | Zabbix lab |
| URL | https://zbx01.lab/api_jsonrpc.php |
| TLS settings: Add self-signed certificate | On, paste the PEM from step 4 |
| Zabbix Connection: Auth type | API token |
| API Token | the grafana-bot token |
| Additional settings > Trends | Enable Trends on, After 7d, Range 4d |
Click Save & test.
You should see:
Zabbix API version 8.0.0The test calls hostgroup.get and apiinfo.version, so a green result proves the URL, TLS and token work. It does not prove the token may read history, which is why step 6 matters.
✅ Checkpoint: Save & test shows “Zabbix API version 8.0.0”.
6Build a dashboard: Metrics and Problems
Create a new dashboard, add a Time series visualization with data source Zabbix lab. Set Query type Metrics, Group Lab/Web, Host web01, Item /CPU utilization|Load average \(1m avg\)/. Add a second panel of type Zabbix Problems with Query type Problems, Group Lab/Web, Show Problems.
Save the dashboard as Zabbix lab overview.
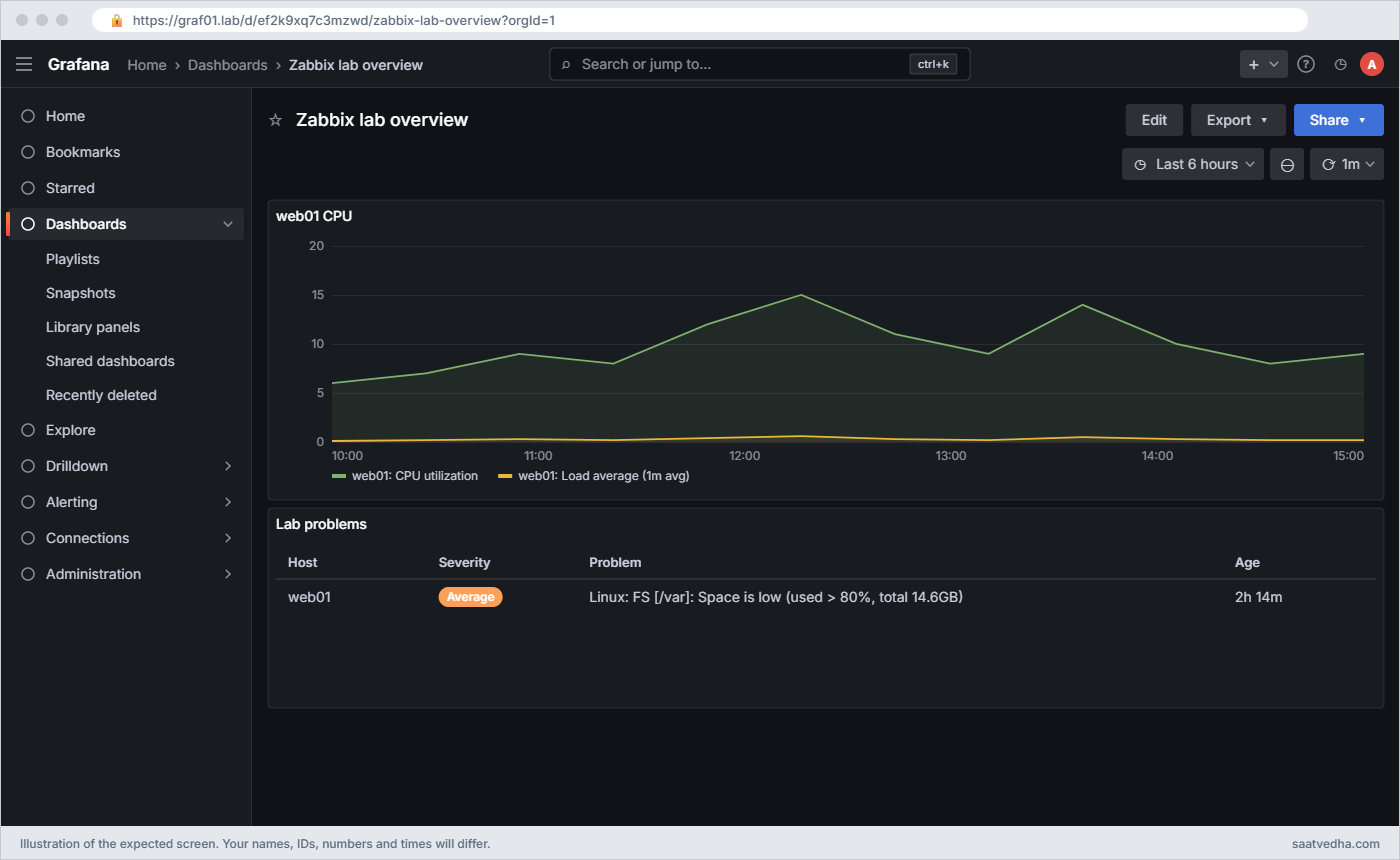
Regex filters are wrapped in slashes, and brackets must be escaped. The Problems panel can acknowledge problems from Grafana if the user’s role allows it; our grafana-bot can’t, which is what you want for a shared TV screen.
The data source also has a Dashboards tab with three bundled dashboards: Zabbix System Status, Zabbix Template Linux Server and Zabbix Server Dashboard. Import them for ideas, but on 8.0 some panels stay empty because they use old item names, for example Zabbix server: Queue (now Queue) and Processor load (15 min average per core) (now Load average (15m avg)); edit those queries to the current names.
✅ Checkpoint: The dashboard shows web01 CPU and load lines and the current Lab/Web problems.
7Run node_exporter on web01
Paste this whole block on web01:
VER=1.12.1
cd /tmp && wget -q https://github.com/prometheus/node_exporter/releases/download/v$VER/node_exporter-$VER.linux-amd64.tar.gz
tar xzf node_exporter-$VER.linux-amd64.tar.gz
sudo install -m 755 node_exporter-$VER.linux-amd64/node_exporter /usr/local/bin/
sudo useradd --system --no-create-home --shell /usr/sbin/nologin node_exporter 2>/dev/null
sudo tee /etc/systemd/system/node_exporter.service >/dev/null <<'EOF'
[Unit]
Description=Prometheus node_exporter
After=network-online.target
[Service]
User=node_exporter
ExecStart=/usr/local/bin/node_exporter --web.listen-address=:9100
Restart=on-failure
[Install]
WantedBy=multi-user.target
EOF
sudo systemctl daemon-reload && sudo systemctl enable --now node_exporter
sudo ufw allow from 192.168.56.80 to any port 9100 proto tcp
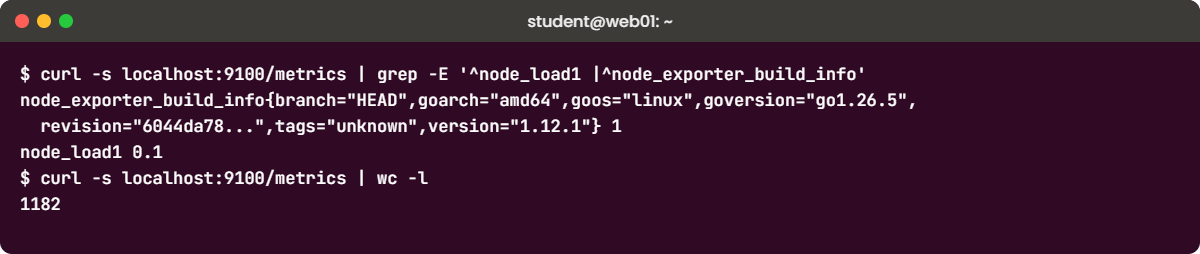
curl -s localhost:9100/metrics | grep -E '^node_load1 |^node_exporter_build_info'You should see this (your load value will differ):
node_exporter_build_info{branch="HEAD",goarch="amd64",goos="linux",goversion="go1.26.5",revision="6044da783597cc3b57aef7580ddcdcff58a4ee99",tags="unknown",version="1.12.1"} 1
node_load1 0.1This is the same node_exporter setup as the Prometheus course; if you already have it on web01, skip to the ufw line. Only zbx01 may reach port 9100.
✅ Checkpoint: curl on web01 shows node_load1 and node_exporter_build_info with version 1.12.1.
8Scrape it from Zabbix with one HTTP agent item
In Zabbix create host web01-prom in group Lab/Web, monitored by Server, no interface needed, with host macros {$NODE_EXPORTER_HOST} = 192.168.56.81 and {$NODE_EXPORTER_PORT} = 9100. Add an item:
| Field | Value |
|---|---|
| Name | node_exporter metrics (raw) |
| Type | HTTP agent |
| Key | lab.node.metrics |
| URL | http://{$NODE_EXPORTER_HOST}:{$NODE_EXPORTER_PORT}/metrics |
| Type of information | Text |
| Update interval | 1m |
| History | 1h |
Click Test, then Get value: you get the whole metrics page (about a thousand lines). Now add three Dependent items with master item “node_exporter metrics (raw)” and one preprocessing step each:
| Name | Key | Type | Prometheus pattern step |
|---|---|---|---|
| Load average 1m (prom) | lab.load1 | Numeric (float) | node_load1, value |
| Free space on / (prom) | lab.fs.root.avail | Numeric (unsigned), units B | node_filesystem_avail_bytes{mountpoint=”/”}, value |
| node_exporter version (prom) | lab.ne.version | Character | node_exporter_build_info, label, version |
After two minutes, Latest data for web01-prom shows (your values will differ):
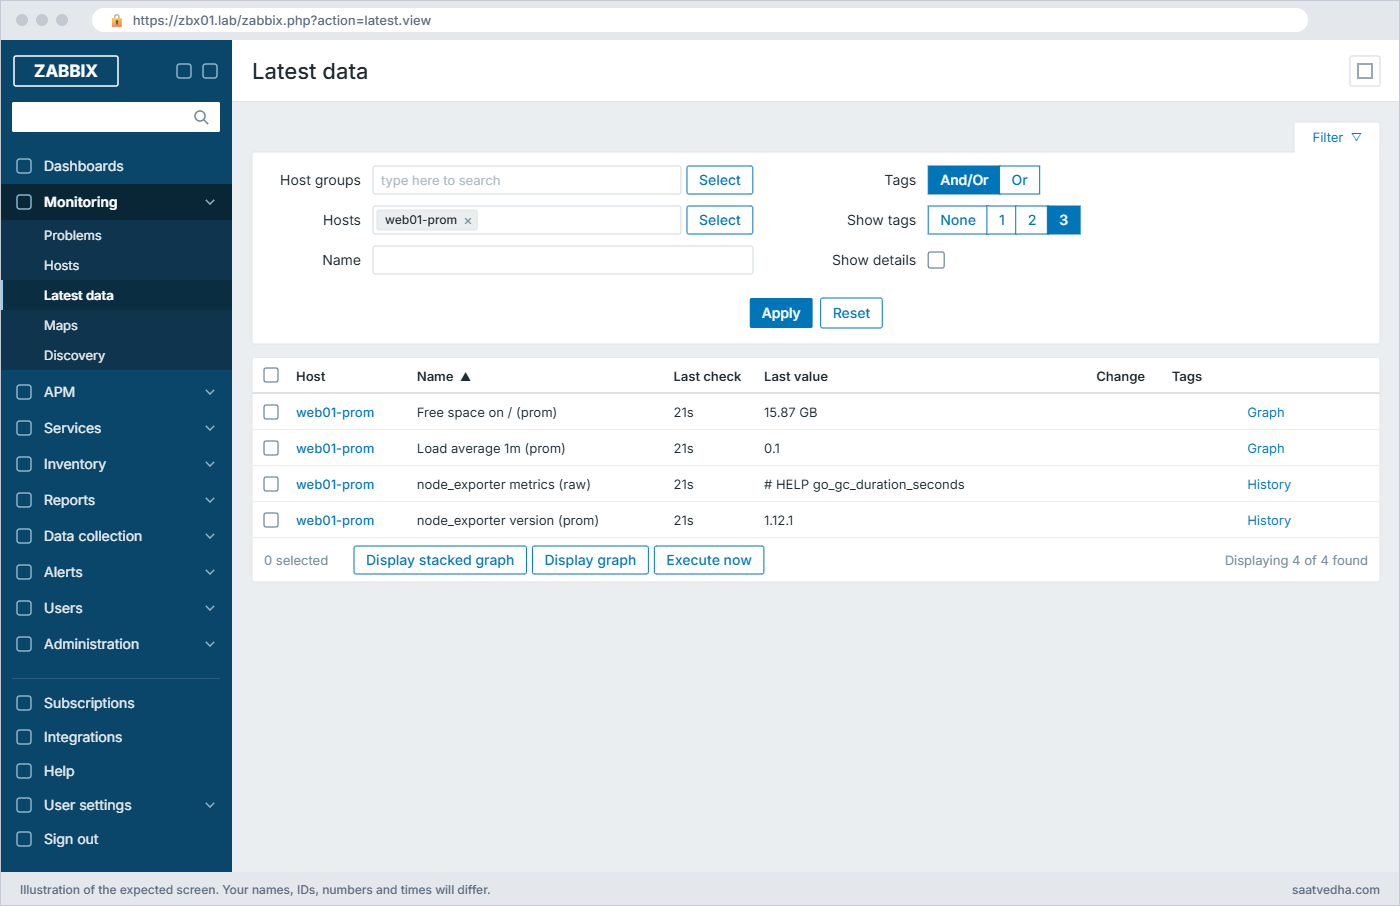
One HTTP request per minute feeds all three items, the same master-and-dependent idea as Lesson 11 and SNMP walk[] in Lesson 20. Keep the raw item’s history short (1h), because the page is big text.
✅ Checkpoint: Latest data shows Free space on / and Load average 1m for web01-prom.
9Discover filesystems with Prometheus to JSON
On web01-prom create a Discovery rule: Name Filesystems (prom), Type Dependent item, Key lab.fs.discovery, Master item the raw item. Preprocessing: Prometheus to JSON with node_filesystem_avail_bytes{fstype=~"ext4|xfs"}. On the LLD macros tab add {#MOUNT} = $.labels.mountpoint and {#FSTYPE} = $.labels.fstype.
Test the preprocessing:
[{"name":"node_filesystem_avail_bytes","value":"1.7041027072e+10","line_raw":"node_filesystem_avail_bytes{device=\"/dev/sda2\",device_error=\"\",fstype=\"ext4\",mountpoint=\"/\"} 1.7041027072e+10","labels":{"device":"/dev/sda2","device_error":"","fstype":"ext4","mountpoint":"/"},"type":"gauge","help":"Filesystem space available to non-root users in bytes."}, ...]Each matching line becomes an object with its name, value, labels, type and help text, and the LLD macro paths pick labels out of it. Add an item prototype: Name Free space on {#MOUNT}, Key lab.fs.avail[{#MOUNT}], Dependent item on the raw item, Numeric (unsigned), units B, preprocessing Prometheus pattern node_filesystem_avail_bytes{mountpoint="{#MOUNT}"}, value.
After the next discovery, Latest data shows one item per ext4 or xfs mount (your sizes will differ):
Free space on / 15.87 GB
Free space on /boot 1.62 GBThe shipped template “Linux by Prom” does all of this (and much more) with the same two macros, so at work you’d link it instead of building items by hand. Building one yourself is how you learn to adapt it to an application exporter that has no template.
✅ Checkpoint: web01-prom has discovered “Free space on” items for each ext4 or xfs mount.
Break It, Then Fix It
Three problems you’ll meet when joining Grafana, Zabbix and Prometheus. Snapshot the Grafana machine first (call it “zabbix-plugin”).
1Plugin installed but not enabled, or not trusted
In Grafana go to the Zabbix plugin page and click Disable, then try Connections > Add new connection and search Zabbix. It isn’t there, and existing panels show an error that the data source plugin can’t be found. Enable it again.
Now simulate a tampered or half-copied plugin, which is what happens when someone copies plugin folders between servers by hand:
Run this on the Grafana machine:
echo '// edit' | sudo tee -a /var/lib/grafana/plugins/alexanderzobnin-zabbix-app/module.js
sudo systemctl restart grafana-server
sudo grep -i 'validation failed' /var/log/grafana/grafana.log | tail -1You’ll get this (your time will differ):
logger=plugins.validation t=2026-11-08T16:20:11.402518413+05:30 level=error msg="Plugin validation failed" pluginId=alexanderzobnin-zabbix-app error="plugin 'alexanderzobnin-zabbix-app' has an modified signature"Grafana checks every file against the plugin’s signed MANIFEST and refuses to load a plugin whose files changed. A plugin with no MANIFEST at all (a source build or a fork) gives has no signature instead. You could allow it with allow_loading_unsigned_plugins in grafana.ini, but for a public plugin the right fix is a clean reinstall.
Fix:
sudo grafana cli plugins remove alexanderzobnin-zabbix-app
sudo grafana cli plugins install alexanderzobnin-zabbix-app
sudo systemctl restart grafana-server✅ Checkpoint: The plugin page shows the Zabbix app enabled and the dashboard loads again.
2Token can log in but can’t read history
Edit the data source and replace the token with the api-bot token from Lesson 22 (role “API read-only”, no history.get). Click Save & test, then open the dashboard.
You’ll get this:
Save & test : Zabbix API version 8.0.0
CPU panel : Application error. No permissions to call "history.get".The test only calls hostgroup.get and apiinfo.version, which that role allows, so it passes, and then every Metrics panel fails. The same message with another method (trend.get on long ranges, valuemap.get with value mapping on) points to the same allow list. Empty group and host drop-downs mean the opposite problem: the method is allowed but the user group has no Read on those host groups.
Fix:
Put the grafana-bot token back (role "Grafana read-only"), or add the missing
method to the role's allow list in Users > User roles.✅ Checkpoint: Save & test passes and the CPU panel draws lines again with the grafana-bot token.
3Prometheus pattern that matches nothing
Add a dependent item on web01-prom with pattern node_load_1 (an extra underscore), then try node_filesystem_avail_bytes{mountpoint=/} (no quotes).
You’ll get these:
Item lab.wrong: Not supported
cannot apply Prometheus pattern: data extraction error: no matching metrics found
Saving the second item:
Invalid parameter "/1/preprocessing/1/params/1": invalid Prometheus pattern.A pattern with valid syntax that matches no line makes the item unsupported; a pattern with broken syntax is refused when you save. The same “no matching metrics found” appears when a label value is wrong (mountpoint="/home" on a server without /home) or when an exporter upgrade renames a metric, which happened to many node_exporter metrics over the years.
Fix:
curl -s 192.168.56.81:9100/metrics | grep -E '^node_load|^node_filesystem_avail_bytes'
# copy the exact metric name and label values from the output into the pattern✅ Checkpoint: Your test items are deleted or fixed and no web01-prom item is Not supported.
This happened at work
One NOC, two tools and a wall of TVs
At a telecom operator in Kolkata the network team lived in Zabbix (SNMP on 4,000 devices) and the platform team lived in Grafana with Prometheus. During a big outage in the monsoon, each team stared at its own screens, and it took forty minutes to notice that the core router’s CPU spike and the API latency jump started at the same minute.
The first fix someone proposed was exporting all Zabbix data into Prometheus, which would have meant rebuilding thousands of SNMP checks and alerts. A colleague of mine suggested the Zabbix plugin instead, and the team built a shared Grafana dashboard with Zabbix router panels next to Prometheus service panels.
The first version used the Admin user’s password in the data source, and a week later Admin got temporarily blocked after a password change because forty panels retried the old one. They moved to a dedicated read-only API user with a token, the allow-list approach of this lesson, and set trends for ranges older than seven days so the TV wall stopped hammering history.
Later the platform team’s new payment service exposed only Prometheus metrics, and the NOC wanted Zabbix escalations on it, so they added an HTTP agent item with Prometheus pattern steps rather than a second alerting system.
Common mistakes and troubleshooting
| Mistake | What happens | What to do instead |
|---|---|---|
| Installing the plugin and not enabling the app | Zabbix is missing from Add new connection | Enable it on Administration > Plugins and data > Plugins > Zabbix |
| Running a plugin older than 6.10.0 against Zabbix 8.0 | Long-range panels fail with unexpected parameter “sortfield” | Update the plugin with grafana cli plugins update alexanderzobnin-zabbix-app |
| Using Admin’s password in the data source | Password changes lock Admin out after panel retries, and Grafana gets full rights | A dedicated user, role with an allow list, and an API token |
| Turning on Skip TLS certificate validation | The token can be stolen by anyone in the middle | Add the Zabbix CA with “Add self-signed certificate” or use a real certificate |
| Using Prometheus pattern on a metric name copied from an old guide | “no matching metrics found” | curl the exporter and copy the current name and labels |
| Keeping long history on the raw /metrics item | Huge text values fill the database | Keep 1h of history (or none) on the master item |
| Scraping exporters through a proxy without opening the port from the proxy | HTTP agent timeouts | HTTP agent runs where the host is monitored; allow the port from that server or proxy |
Interview questions
Click a question to open it. Each one is written the way an interviewer would ask it. Under it you will see why they ask it and one way you could answer, in your own words.
Fresher level
1. How do you show Zabbix data in Grafana?
Why they ask this: They want the plugin, the enable step and the API connection.
How you might answer: I install the Zabbix app plugin with grafana cli, enable it in Administration > Plugins and data, and add a Zabbix data source with the URL to api_jsonrpc.php and an API token. Then panels use query types like Metrics, Problems or Text, with group, host and item filters.
Zabbix keeps collecting and alerting; Grafana only reads through the API.
2. What is the difference between the Metrics and Problems query types in the plugin?
Why they ask this: A check they have used the plugin.
How you might answer: Metrics returns time series from numeric items, using history or trends depending on the time range, for graphs. Problems returns current or recent Zabbix problems with severity, host, tags and age, which the Zabbix Problems panel shows like the Zabbix problems page.
2–5 years experience
3. Save & test is green but every graph says “No permissions to call history.get”. Explain.
Why they ask this: They want to see you understand roles, allow lists and what Save & test checks.
How you might answer: Save & test only checks that the token works for hostgroup.get and apiinfo.version. The token’s role in Zabbix has API access with an allow list that doesn’t include history.get, so data queries fail.
I add the read methods Grafana needs to the role, history.get, trend.get, item.get, host.get, problem.get and so on, or use a dedicated Grafana role, and test again.
4. How would you monitor an application that only exposes Prometheus metrics, using Zabbix?
Why they ask this: They want HTTP agent plus Prometheus preprocessing and LLD.
How you might answer: I create an HTTP agent item that fetches the /metrics page once per interval with short history, then dependent items with the Prometheus pattern step for each value I need, and a discovery rule with Prometheus to JSON plus LLD macro paths on labels for repeated things like endpoints or queues.
Triggers and escalations then work like any other Zabbix item, and if a shipped template like Linux by Prom exists I link that instead.
Senior level
5. Your company runs both Zabbix and Prometheus. How do you decide where new monitoring goes?
Why they ask this: They are checking architecture judgement, not tool loyalty.
How you might answer: I keep alerting for a service in one system to avoid double pages: network, SNMP and classic servers in Zabbix, cloud-native and Kubernetes workloads in Prometheus. Grafana with both data sources gives one view for people.
Where a team needs Zabbix escalations on a Prometheus-only app, Zabbix can scrape the exporter directly; where Prometheus users need Zabbix data, the Grafana plugin is cheaper than exporting it.
6. Grafana dashboards on Zabbix are slow for 30-day ranges. What can you tune?
Why they ask this: They want trends, direct DB and query design.
How you might answer: First I make sure trends are enabled in the data source with After set to the history retention, so long ranges read hourly trends. Then I narrow item regex filters, add a Limit to Problems queries and avoid one panel per host with dozens of items.
For very large setups the plugin’s Direct DB Connection can read history and trends from a read-only database user, but that bypasses Zabbix permissions, so I use it carefully.
Quick quiz
Q1. After installing alexanderzobnin-zabbix-app, what else must you do before adding the data source?
- Restart Zabbix
- Enable the app in Grafana
- Install PHP
- Create a Prometheus job
Show answer
B — It is an app plugin, so it must be enabled after installation.
Q2. Which minimum plugin version fixes trend queries on Zabbix 8.0?
- 5.0.0
- 6.3.1
- 6.10.0
- 7.0.0
Show answer
C — 6.10.0 stopped sending sortfield to trend.get, which 8.0 rejects.
Q3. What does the Prometheus pattern step return for node_exporter_build_info with “label” and “version”?
- 1
- The version label value, such as 1.12.1
- The whole line
- A JSON array
Show answer
B — Label mode returns the value of the named label.
Q4. An item with pattern node_load_1 becomes Not supported. Why?
- Syntax error
- No metric with that name exists on the page
- Port 9100 closed
- Wrong value type
Show answer
B — “no matching metrics found” means the selector matched no line.
Q5. Which preprocessing step turns matching Prometheus lines into rows for low-level discovery?
- JSONPath
- Prometheus pattern
- Prometheus to JSON
- SNMP walk to JSON
Show answer
C — Prometheus to JSON returns an array of objects with name, value and labels.
Quick recap
- The Zabbix app plugin (6.10.x) must be installed and enabled, then the data source needs the API URL, TLS trust and an API token.
- Give Grafana its own Zabbix role with an allow list including history.get and trend.get; Save & test alone doesn’t prove data access.
- Use plugin 6.10.0 or later with Zabbix 8.0, because older versions break trend queries.
- Zabbix reads Prometheus exporters with one HTTP agent master item, Prometheus pattern dependent items and Prometheus to JSON discovery.
- Copy metric names and labels from the live /metrics page; a wrong selector gives “no matching metrics found”.
Next lesson
Lesson 24: Zabbix health, housekeeping, upgrades and troubleshooting → You learn to read the server’s own health, tune pollers and caches, plan housekeeping and an upgrade, and troubleshoot the three most common Zabbix problems.
Further reading: Zabbix Grafana plugin
Want to go deeper into Zabbix Grafana plugin? The plugin’s documentation covers configuration, query types and troubleshooting, and the Zabbix manual explains Prometheus checks. node_exporter itself is covered in the Prometheus course lesson Prometheus node exporter, and Grafana basics in the Grafana Dashboards course. API tokens and roles came from Lesson 22.
You can also see the full plan for this course on the Zabbix Monitoring course page.
