Zabbix health, housekeeping, upgrades and troubleshooting

Zabbix troubleshooting starts with Zabbix watching itself. The server measures how busy its own processes are, how full its caches are and how many checks are late, and it ships a template that raises a problem before you notice slow alerts.

In this last lesson you’ll read those health numbers, talk to the running server with zabbix_server -R, plan housekeeping and database growth, take a backup and rehearse the 7.0 LTS to 8.0 LTS upgrade. Then you’ll overload a poller, fill the history cache and break a database version check on purpose, and finish with a fixed order for the three questions you’ll hear every week: why is this host red, why is this item grey, why did nobody get the alert.

Where this lesson fits

Lesson 24 of 24 in Zabbix Monitoring · Phase 3: Alerts, proxies, SNMP and automation · Before this: Lesson 23, Grafana and Prometheus · Next: The course page and your final project

TimeYou needBy the end you can
About 2 hours 30 minuteszbx01, web01 and zbxprx01 from Lessons 1 to 23, with the Python venv and write token from Lesson 22A Zabbix server you can read and tune, a tested backup, an upgrade checklist and a troubleshooting order you can use at work

What it is, in one line

Zabbix health and troubleshooting means reading the server’s own internal items (process busy %, cache use, queue), tuning the matching settings in zabbix_server.conf, keeping the database in shape with housekeeping and backups, and checking problems in a fixed order: collection, item, trigger, action.

In Simple Words

The railway ticket counter

Think of the reservation counter at Lucknow Charbagh station in the summer rush. There are five windows, and each clerk can serve one passenger at a time. If thirty people arrive every minute and each takes ten seconds, the five clerks are busy most of the minute and the line still moves.

Now one passenger at window 2 argues for five minutes. The line behind window 2 stops, people move to other windows, and soon every clerk is busy all the time and the queue reaches the gate. The station master doesn’t shout at the passengers; he looks at how busy each window is and opens two more.

Zabbix pollers are the clerks, items are the passengers, and the health template is the station master’s notebook. Slow checks are the arguing passenger, and the history cache is the waiting room where tickets wait before they go into the big register, the database.

Engineer's View

What the server measures about itself

The Zabbix server health template is linked to the host “Zabbix server” on a fresh install. Its items are Zabbix internal items with keys like zabbix[process,poller,avg,busy], collected by the server itself with no agent. The triggers compare averages over 10 minutes with the macro {$ZABBIX.SERVER.UTIL.MAX} (75) and recover below {$ZABBIX.SERVER.UTIL.MIN} (65).

Item (name in 8.0)KeyWhat a bad value means
Utilization of poller data collector processes, in %zabbix[process,poller,avg,busy]Simple, external, SSH, Telnet and Script checks wait; raise StartPollers or fix slow checks
Utilization of agent poller data collector processes, in %zabbix[process,agent poller,avg,busy]Passive agent checks wait; StartAgentPollers or MaxConcurrentChecksPerPoller
History write cache, % usedzabbix[wcache,history,pused]Values can’t reach the database fast enough; HistoryCacheSize or a slow DB
Configuration cache, % usedzabbix[rcache,buffer,pused]Too little CacheSize for hosts, items and triggers
Value cache, % usedzabbix[vcache,buffer,pused]Trigger functions read the DB instead of memory; ValueCacheSize
Queue over 10 minuteszabbix[queue,10m]Checks are more than 10 minutes late

Since 7.0 the server has separate pollers per check type. Passive agent, HTTP agent and SNMP get/walk items use asynchronous pollers (default 1 each, up to 1000 checks in flight per poller), while the classic synchronous poller (StartPollers, default 5) runs simple checks, external checks, SSH, Telnet, Script items and old-style SNMP OIDs one at a time.

Setting in zabbix_server.confDefaultRange
StartPollers50-1000
StartAgentPollers / StartHTTPAgentPollers / StartSNMPPollers1 each0-1000
StartPreprocessors161-1000
StartDBSyncers41-100
CacheSize32M128K-64G
HistoryCacheSize / HistoryIndexCacheSize16M / 4M128K-16G
TrendCacheSize4M128K-16G
ValueCacheSize8M0, 128K-64G
HousekeepingFrequency / MaxHousekeeperDelete1 hour / 50000-24 / 0-1000000

How it works, step by step

1Follow one value through the server

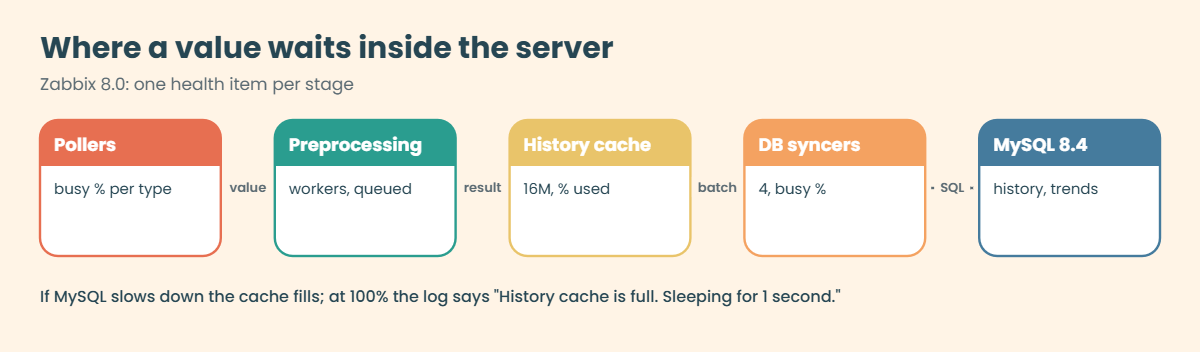
A poller gets a value, the preprocessing manager hands it to a worker for steps like JSONPath or “Change per second”, and the result lands in the history cache in shared memory. Four history syncers (StartDBSyncers) take values from the cache, calculate triggers and write history and trends to the database in batches.

Every stage has a matching health item, so when alerts are slow you can see which stage is the bottleneck. The diagram below shows the path and where it backs up.

Zabbix troubleshooting: value path through pollers, preprocessing, history cache, DB syncers and MySQL

2Read busy %, caches and housekeeping together

A process type at 100% busy means checks wait; a cache near 100% means memory is too small or the next stage is slow. Don’t raise numbers blindly: more pollers help when checks wait on the network, but if MySQL is slow, more pollers only fill the history cache faster.

The housekeeper deletes old history, trends, events and sessions every hour (HousekeepingFrequency=1), at most 5000 rows per item per run. Item settings decide retention (31 days history, 365 days trends by default), unless Administration > Housekeeping has “Override item history period” switched on.

3How an upgrade runs

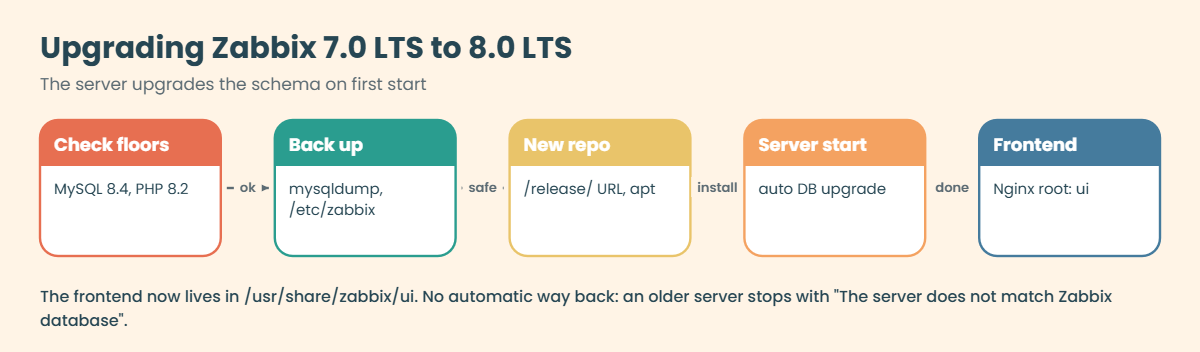
Zabbix upgrades the database schema itself. When the new server binary starts, it compares its required version with the dbversion table, runs every patch in order and logs each step, and the frontend refuses to work until both match. There is no automatic way back, so the backup before the upgrade is the only rollback you have; the diagram below shows the order.

Zabbix troubleshooting the 7.0 LTS to 8.0 LTS upgrade: checks, backup, repository, DB upgrade, frontend

4A fixed order for troubleshooting

Most tickets are one of three: a host with a red availability icon, an item marked “Not supported”, or a problem that nobody was told about. Check them in the order data flows: can Zabbix reach the host, can it get the item, does the trigger fire, does the action send.

SymptomFirst place to lookTypical cause
Host availability red (ZBX)Hover the icon on Data collection > Hosts; server or proxy logFirewall, Server= list, PSK mismatch, wrong proxy
Item “Not supported”Info icon on the item, or Test > Get valueWrong key or parameter, permissions, missing plugin, preprocessing error
Problem shown but no messageReports > Action log, then the problem’s Actions columnAction conditions, maintenance, user media severity, media type error
Values arrive lateAdministration > Queue, health templateBusy pollers, unreachable hosts, proxy link down

Hands-on lab: server health, runtime control, backup and upgrade checks

Before you run any command, double-check it

Read every command twice before you press Enter. Check the target: the server name, the user, the disk or device name, the path and the sizes. These commands are for learning and were tested in our lab, not on your system. At work, run the read-only commands first, follow your change process, make sure a backup exists, and ask a second person to check anything that changes or deletes data. You run them at your own risk.

Everything runs on zbx01 (192.168.56.80) unless a step says otherwise. web01 is monitored through zbxprx01 (192.168.56.82) since Lesson 19, which matters in step 9. The zabbix_server -R outputs, log lines and error messages were captured on a real Zabbix 8.0.0 server.

1Read the server’s health numbers

Open Monitoring > Latest data, set Hosts to Zabbix server and type Utilization in Name. Then repeat with cache and Queue.

You should see these items (your values will differ):

Zabbix troubleshooting: Latest data with Zabbix server health utilization, cache and queue items
Zabbix server health in Latest data: utilization, cache and queue items near zero on the lab

On a lab this small everything is close to zero, which is your baseline. If “Zabbix server health” isn’t linked, add it on Data collection > Hosts > Zabbix server > Templates.

✅ Checkpoint: Latest data shows the Utilization, cache and Queue items for Zabbix server with fresh values.

2Ask the running server for its status

Run this on zbx01:

sudo zabbix_server -R status
ps -eo args | grep 'zabbix_server: poller #' | grep -v grep

You should see this (your timings will differ, and ps lists all five pollers):

configuration syncer #1 [synced configuration in 0.013639 sec, idle 10 sec]
event manager #1 [assessed:9 processed:0 discarded:0 events, idle 5.0s, during 5.0s]
preprocessing manager #1 [queued 1, processed 1 values, idle 5.009264 sec during 5.009377 sec]
service manager #1 [processed 0 events, updated 0 event tags, deleted 0 problems, synced 0 service updates, idle 5.004933 sec during 5.004973 sec]
/usr/sbin/zabbix_server: poller #1 [got 0 values in 0.000010 sec, idle 5 sec]
/usr/sbin/zabbix_server: poller #2 [got 0 values in 0.000040 sec, idle 5 sec]

-R status is new in 8.0 and asks the manager processes what they did in their last cycle. The ps line shows the title every Zabbix process sets for itself, which is the fastest way to see a poller stuck on “getting values”.

✅ Checkpoint: Both commands print process lines, and you can see five poller processes in ps.
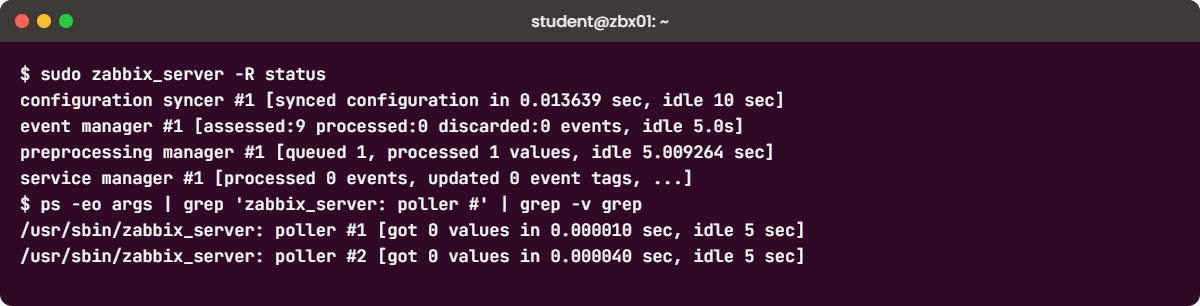
Zabbix troubleshooting lab: zabbix_server -R status and poller process titles
Terminal output: zabbix_server -R status and the poller process titles on zbx01

3Look inside the history cache

Run this on zbx01:

sudo zabbix_server -R diaginfo=historycache

You should see:

Runtime control command was forwarded successfully

Then read the log:

sudo grep -A6 'history cache diagnostic' /var/log/zabbix/zabbix_server.log | tail -7
== history cache diagnostic information ==
Items:10 values:1 time:0.000007
Memory.data:
  size: free:16776760 used:48
  chunks: free:1 used:1 min:16776760 max:16776760
    buckets:
      256+:1

“values:1” means one value is waiting to be written, and “free:16776760” of the default 16M is unused. On a healthy server this number stays near the full size; in break 2 you’ll see it drop to zero.

✅ Checkpoint: The log shows “history cache diagnostic information” with a large free value.

4Change logging and reload the cache without a restart

Run this on zbx01:

sudo zabbix_server -R log_level_increase=poller
sudo zabbix_server -R log_level_decrease=poller
sudo zabbix_server -R config_cache_reload
sudo grep -E 'log level has been|forced reloading' /var/log/zabbix/zabbix_server.log | tail -4

You should see this (your PIDs and times will differ):

Runtime control command was forwarded successfully
 14926:20261108:101404.834 log level has been increased to 4 (debug)
 14926:20261108:101406.841 log level has been decreased to 3 (warning)
 14879:20261108:101410.112 forced reloading of the configuration cache
 14879:20261108:101410.130 finished forced reloading of the configuration cache

A target such as poller, "agent poller" or "history syncer,2" raises the level for those processes only, so the log doesn’t explode. A wrong name is refused with invalid process type: "nosuch", and you should always decrease again after collecting what you need.

✅ Checkpoint: The log shows the level going to 4 and back to 3, and a forced configuration cache reload.

5Set housekeeping and run it once

Open Administration > Housekeeping. In the History section keep “Enable internal housekeeping” on, switch on “Override item history period” and set Data storage period to 14d; in Trends keep 365d. Click Update.

Run this on zbx01:

sudo zabbix_server -R housekeeper_execute
sleep 5; sudo grep 'housekeeper \[' /var/log/zabbix/zabbix_server.log | tail -1

You should see this (your counts and times will differ):

Runtime control command was forwarded successfully
 14890:20261108:101408.048 housekeeper [deleted 203 hist/trends, 0 events, 0 problems, 0 sessions, 0 alarms, 0 audit, 0 autoreg_host, 0 records, 0 sets, 0 expired device authentication records in 0.054674 sec, idle for 1 hour(s)]

The line tells you how many rows each run removed and how long it took. If one run starts taking minutes on a big server, that’s the sign to look at partitioning the history tables (MySQL partitions, or TimescaleDB on PostgreSQL) and switching internal housekeeping off for history and trends.

Zabbix troubleshooting: Administration > Housekeeping with item history override 14d” class=”wp-image-10151″ width=”1400″ height=”996″ style=”width:100%;height:auto;border-radius:10px;” /><figcaption style=Administration > Housekeeping: history override switched on with a 14d storage period

✅ Checkpoint: Housekeeping shows the 14d override, and the log has a “housekeeper [deleted …” line.

6Measure the database

Run this on zbx01:

sudo mysql -e "SELECT table_name, ROUND((data_length+index_length)/1024/1024,1) AS size_mb
  FROM information_schema.tables WHERE table_schema='zabbix'
  ORDER BY (data_length+index_length) DESC LIMIT 5;"
sudo du -sh /var/lib/mysql/zabbix

You should see this (your sizes will differ):

TABLE_NAME      size_mb
history_uint    48.5
history         31.2
trends_uint     12.8
items           10.4
history_text    6.1
182M    /var/lib/mysql/zabbix

The history tables are almost always at the top. Write this number down every month; a rough formula for planning is new values per second × bytes per value (about 90 on MySQL) × seconds of retention, so 1000 NVPS kept for 14 days is around 100 GB of history.

✅ Checkpoint: You know the size of your zabbix schema and which tables are the largest.

7Back up the database and configuration

Paste this whole block on zbx01:

mkdir -p ~/backup && cd ~/backup
sudo mysqldump --single-transaction --quick zabbix | gzip > zabbix-db-$(date +%F).sql.gz
sudo tar czf zabbix-etc-$(date +%F).tgz /etc/zabbix /etc/nginx/conf.d/zabbix.conf \
  /etc/ssl/certs/zbx01.lab.crt /etc/ssl/private/zbx01.lab.key
ls -lh ~/backup
gunzip -c zabbix-db-$(date +%F).sql.gz | grep -c 'CREATE TABLE'

You should see this (your dump size and dates will differ):

tar: Removing leading `/' from member names
tar: Removing leading `/' from hard link targets
total 41M
-rw-rw-r-- 1 student student 41M Nov  8 10:32 zabbix-db-2026-11-08.sql.gz
-rw-r--r-- 1 root    root    21K Nov  8 10:32 zabbix-etc-2026-11-08.tgz
230

The two tar lines are normal. tar stores the paths without the leading slash, so a later tar xzf unpacks into the folder you’re in instead of writing straight over /etc. The configuration archive comes to about 21K because zabbix_server.conf alone is about 35 KB of comments and defaults, and gzip shrinks that well. /etc/nginx/conf.d/zabbix.conf is only a symlink to /etc/zabbix/nginx.conf, created by the zabbix-nginx-conf package, so the real Nginx file is already inside /etc/zabbix.
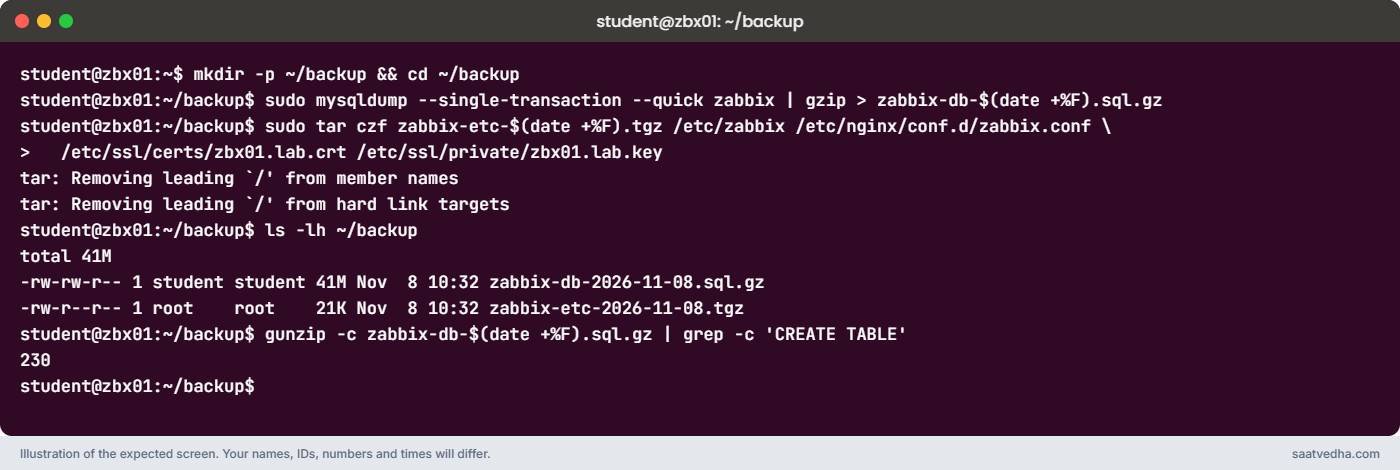
Zabbix troubleshooting backup on zbx01: tar of /etc/zabbix and the certificate, ls -lh shows the 21K tgz and 230 CREATE TABLE lines
The backup step on zbx01: the two tar notices, the 21K configuration archive next to the database dump, and 230 tables in the dump

--single-transaction takes a consistent copy of InnoDB tables without stopping the server. The second file holds the server, agent, frontend (/etc/zabbix/web/zabbix.conf.php) and Nginx configuration, plus the certificate. Copy both files off the VM, because a backup on the same disk isn’t a backup.

✅ Checkpoint: ~/backup has a .sql.gz with about 230 CREATE TABLE lines and a .tgz of the configuration.

8Rehearse the upgrade checks

Run this on zbx01:

zabbix_server -V | head -1
mysql -V
php -r 'echo PHP_VERSION, PHP_EOL;'
sudo mysql zabbix -e "SELECT mandatory, optional FROM dbversion;"

You should see:

zabbix_server (Zabbix) 8.0.0
mysql  Ver 8.4.11-0ubuntu0.26.04.1 for Linux on x86_64 ((Ubuntu))
8.5.4
mandatory  optional
8000000    8000000

Your lab is already on 8.0, so you can’t upgrade it, but these four checks are what you run first on a 7.0 server at work. Zabbix 8.0 needs MySQL 8.4 or newer (MariaDB 10.11, PostgreSQL 15) and PHP 8.2 or newer, and a 7.0 database shows 7000000 here.

The upgrade on Ubuntu, after a backup, is short:

sudo systemctl stop zabbix-server
wget https://repo.zabbix.com/zabbix/8.0/release/ubuntu/pool/main/z/zabbix-release/zabbix-release_latest_8.0+ubuntu26.04_all.deb
sudo dpkg -i zabbix-release_latest_8.0+ubuntu26.04_all.deb
sudo apt update
sudo apt install --only-upgrade zabbix-server-mysql zabbix-frontend-php zabbix-nginx-conf zabbix-sql-scripts zabbix-agent2
grep -n 'root' /etc/zabbix/nginx.conf        # must be /usr/share/zabbix/ui
sudo systemctl start zabbix-server
sudo tail -f /var/log/zabbix/zabbix_server.log

The server log during the database upgrade looks like this:

current database version (mandatory/optional): 07000000/07000030
required mandatory version: 07050196
starting automatic database upgrade
completed 1% of database upgrade
...
database upgrade fully completed

Note the new /release/ part of the repository URL, and that the frontend moved to /usr/share/zabbix/ui in 7.2, so an old Nginx root line gives a 404. Templates and media types are not upgraded for you: import the new versions afterwards, and upgrade proxies to the same major version soon after the server.

✅ Checkpoint: You have the four version numbers of your lab written next to the 8.0 minimums.

9Drill the troubleshooting order

Run the three checks on your own lab. First the host: open Data collection > Hosts, note that web01 shows “remote-proxy” under Monitored by, so any test must come from zbxprx01.

Run this on zbxprx01 (copy web01’s key from /etc/zabbix/zabbix_agent2.d/web01.psk first):

sudo apt install -y zabbix-get
echo 'PASTE_THE_64_HEX_KEY' > /tmp/web01.psk && chmod 600 /tmp/web01.psk
zabbix_get -s 192.168.56.81 -k agent.ping \
  --tls-connect psk --tls-psk-identity "PSK web01" --tls-psk-file /tmp/web01.psk

You should see:

1

Then the item: on web01 open Items, filter State Not supported and hover the red info icon; the text is the agent’s own reason. Then the alert: open Reports > Action log for the last day and check each sent, failed or missing message against Lesson 16’s action and the user’s media severity.

1. Collection : availability icon, zabbix_get from the server OR proxy that polls the host
2. Item       : item error text, Test > Get value, zabbix_agent2 -t KEY on the host
3. Trigger    : Monitoring > Problems (show suppressed), trigger expression on latest values
4. Action     : Reports > Action log, action conditions, maintenance, user media and severity

✅ Checkpoint: zabbix_get from zbxprx01 returns 1 for web01, and you know where each of the four checks lives.

10Final project: monitor a new service end to end

Pick a service on web01 you haven’t monitored yet, for example Mailpit on zbx01 or a second Nginx site, and use everything from the course in one go. Treat it like a real request from a team lead.

PartFrom lessonDone when
Host, template and macros4 to 9Data arrives in Latest data
Two triggers with severity and tags10 to 12A test failure opens a problem
Action with escalation to email or webhook16, 17The message arrives and Action log shows Sent
Dashboard and a Grafana panel15, 23One screen shows the service
Maintenance and an API report22A Python script lists the service’s problems
Health check24Busy % and queue stay low after the change

✅ Checkpoint: Your new service has data, triggers, an alert that reaches you, a dashboard and a backup taken after the change.

Break It, Then Fix It

Three failures every Zabbix admin meets sooner or later. Take a VirtualBox snapshot of zbx01 first and name it “before-l24-breaks”.

1“Utilization of poller processes is high”

Make one slow external check and give the server only one poller for it.

Run this on zbx01:

sudo tee /usr/lib/zabbix/externalscripts/slow_check.sh >/dev/null <<'EOF'
#!/bin/sh
sleep 2
echo 1
EOF
sudo chmod 755 /usr/lib/zabbix/externalscripts/slow_check.sh
sudo sed -i 's/^# StartPollers=5/StartPollers=1/' /etc/zabbix/zabbix_server.conf
sudo systemctl restart zabbix-server

Create host slowlab (group Linux servers, agent interface 127.0.0.1) with an item: Type External check, Key slow_check.sh[1], Numeric (unsigned), interval 10s. Clone it five times with keys slow_check.sh[2] to slow_check.sh[6]. After a few minutes look at Latest data and ps:

Utilization of poller data collector processes, in %    100 %
/usr/sbin/zabbix_server: poller #1 [got 3 values in 6.015147 sec, getting values]

Six checks of two seconds every ten seconds need twelve seconds of work, and one poller has only ten. After ten minutes the template opens “Zabbix server: Utilization of poller processes is high” (event name “…over 75%”), and Administration > Queue shows slowlab’s items getting later.

Fix:

sudo sed -i 's/^StartPollers=1/StartPollers=5/' /etc/zabbix/zabbix_server.conf
sudo systemctl restart zabbix-server
Utilization of poller data collector processes, in %    26.5 %

With five pollers the same work uses about a quarter of their time. At work, fix the slow check first (a two-second script is a smell), then add pollers; and if the slow items are many simple checks to a far site, move them to a proxy there.

✅ Checkpoint: Poller utilization is under 65% and the problem has resolved. Delete host slowlab.

2History cache is full

Shrink the history cache to the minimum, freeze the database writes for a minute and push values in with zabbix_sender.

Run this on zbx01:

echo 'HistoryCacheSize=128K' | sudo tee -a /etc/zabbix/zabbix_server.conf
sudo systemctl restart zabbix-server

Create host floodlab with a Zabbix trapper item, Key lab.flood, type Text (Allowed hosts stays {$TRAPPER.ALLOWED_HOSTS}, which allows 127.0.0.1). Wait one minute for the configuration cache, then:

python3 -c "
for i in range(20000): print('floodlab lab.flood', 'x'*200)" > /tmp/flood.txt
sudo apt install -y zabbix-sender
(sudo mysql -e "FLUSH TABLES WITH READ LOCK; SELECT SLEEP(75);" >/dev/null &)
sleep 3; zabbix_sender -z 127.0.0.1 -i /tmp/flood.txt | tail -2
sudo zabbix_server -R diaginfo=historycache
sudo grep -A2 'History cache is full' /var/log/zabbix/zabbix_server.log | tail -3

You’ll get this (your numbers will differ):

Response from "127.0.0.1:10051": "processed: 250; failed: 0; total: 250; seconds spent: 0.000738"
Sending failed. Use option -vv for more detailed output.
== history cache diagnostic information ==
Items:139 values:256 time:0.000015
Memory.data:
  size: free:0 used:116088
 13751:20261108:101024.964 History cache is full. Sleeping for 1 second.
 13751:20261108:101024.964 items with most values in history cache:
  itemid:72507 values:452

With writes blocked, the syncers can’t empty the cache, it reaches free:0, and the process that wants to add values sleeps. That’s why the sender stops being answered. The log helpfully lists the items with the most waiting values, which at work points to the item or host flooding you.

Fix:

sudo sed -i '/^HistoryCacheSize=128K/d' /etc/zabbix/zabbix_server.conf
sudo systemctl restart zabbix-server
sudo zabbix_server -R diaginfo=historycache

At work the cause is rarely the cache size itself. Check the database first (slow disk, locks, a long backup without --single-transaction), then the busy % of history syncers, and only then raise HistoryCacheSize.

✅ Checkpoint: diaginfo shows a large free value again and no new “History cache is full” lines. Delete host floodlab.

3Server and database versions don’t match

This is what you see after rolling packages back to an older server once the database was already upgraded to a newer version. Make a fresh backup (step 7) before this one.

Run this on zbx01:

sudo systemctl stop zabbix-server
sudo mysql zabbix -e "UPDATE dbversion SET mandatory=8020005, optional=8020005;"
sudo systemctl start zabbix-server
sudo tail -2 /var/log/zabbix/zabbix_server.log

You’ll get this:

 14609:20261108:101110.854 The server does not match Zabbix database. Current database version (mandatory/optional): 08020005/08020005. Required mandatory version: 08000000.
 14609:20261108:101110.854 Zabbix Server stopped. Zabbix 8.0.0 (revision c81e276e505).

The frontend shows “Database error: The Zabbix database version does not match current requirements. Your database version: 8020005. Required version: 8000000.” Zabbix never downgrades a schema, so the only real fix after a failed upgrade is restoring the backup taken before it.

Fix (put the real version back):

sudo mysql zabbix -e "UPDATE dbversion SET mandatory=8000000, optional=8000000;"
sudo systemctl start zabbix-server

The other version error you’ll meet is the database server itself. Upgrading Zabbix on Ubuntu 24.04 with its MySQL 8.0 stops at start with this real message:

Unable to start Zabbix server due to unsupported MySQL database version (8.0.46).
Should be at least (8.4.0).
Use of supported database version is highly recommended.
Override by setting AllowUnsupportedDBVersions=1 in Zabbix server configuration file at your own risk.

The override exists, but on a server you care about, upgrade MySQL to 8.4 (or move to 26.04) before Zabbix, not after.

✅ Checkpoint: The server is running again, the frontend loads, and dbversion shows 8000000.

This happened at work

Late alerts in the Lucknow summer

One June afternoon at a state power distribution company in Lucknow, the control room called our team: a feeder trip had shown up in Zabbix eleven minutes late. My team lead opened the Zabbix server host and saw “Utilization of poller processes is high” open since morning, and Administration > Queue had thousands of items in the over-5-minutes column.

The first fix was to give the VM two more CPUs and 8 GB more RAM. Nothing changed, because the pollers weren’t short of CPU; they were waiting. A week earlier someone had added TCP port checks for 1,200 substation RTUs as simple checks with a 30-second interval, and in the heat many sites were on generator with their links down, so each check sat for the full timeout.

We moved the substation checks to two proxies in the regional offices, set the interval to 2 minutes and raised StartPollers from 5 to 20 on the proxies, not the server. The queue was empty by evening.

The lasting change was a habit: anyone adding more than a hundred items now looks at the health template before and after, and the poller and history cache triggers send to the Zabbix admins’ group with their own escalation.

Common mistakes and troubleshooting

MistakeWhat happensWhat to do instead
Unlinking or ignoring the Zabbix server health templateYou learn about overload from angry usersKeep it linked and route its problems to the admins
Raising every Start* value to 100More DB connections and memory, same slow DBRaise the process type that is busy, after fixing slow checks
Raising HistoryCacheSize when the DB is slowThe bigger cache fills later and the data loss risk growsFix database speed first, then size caches
Keeping 90 days of history on every itemDatabase grows past the disk and housekeeping runs for hoursShort history plus trends; override in Administration > Housekeeping
Upgrading without a tested database backupA failed schema patch leaves no way backmysqldump with single-transaction, copied off the VM and restored once as a test
Upgrading Zabbix before MySQL on Ubuntu 24.04“unsupported MySQL database version (8.0.x)” and the server won’t startMove to MySQL 8.4 or Ubuntu 26.04 first
Testing a proxied host with zabbix_get from the serverRefused, and you chase a problem that isn’t thereTest from the proxy that monitors the host

Interview questions

Click a question to open it. Each one is written the way an interviewer would ask it. Under it you will see why they ask it and one way you could answer, in your own words.

Fresher level

1. A host shows a red ZBX icon. Walk me through what you check.

Why they ask this: They want an order, not random guesses.

How you might answer: I hover the icon to read the error, then check which server or proxy monitors the host. From that machine I run zabbix_get with the same encryption settings, and if it fails I look at the agent’s Server list, the firewall and the agent log, which says whether it rejected the connection or never saw it.

2. What does the Zabbix server health template tell you?

Why they ask this: A check that you know Zabbix monitors itself.

How you might answer: It uses internal items to show how busy each process type is, how full the configuration, history and value caches are, and how many items are late in the queue. Its triggers fire when a process type is over 75% busy for 10 minutes or the history cache is filling, so I hear about overload before users do.

2–5 years experience

3. Poller utilization is 100% but CPU on the server is low. Why, and what do you do?

Why they ask this: They are checking that you understand pollers wait on I/O.

How you might answer: Synchronous pollers run one check at a time, so slow external scripts or simple checks to unreachable hosts keep them busy without CPU. I find the slow items in the queue details, shorten their timeout or interval, move far-away checks to a proxy, and then raise StartPollers if it is still above 75%.

For agent, HTTP and SNMP checks in 8.0 I look at the asynchronous pollers and MaxConcurrentChecksPerPoller instead.

4. You see “History cache is full. Sleeping for 1 second.” in the log. What is your next step?

Why they ask this: They want you to find the cause behind the cache.

How you might answer: That means history syncers can’t write values as fast as they arrive. I check database health first: slow disk, locks, a backup holding tables, long housekeeper runs. The log lists the items with the most values in the cache, so I also look for one host flooding the server, and I raise HistoryCacheSize only after that.

Senior level

5. Plan an upgrade from Zabbix 7.0 LTS to 8.0 LTS for a large installation.

Why they ask this: They are checking risk control and the real prerequisites.

How you might answer: I check the floors first: MySQL 8.4, MariaDB 10.11 or PostgreSQL 15, and PHP 8.2, because 8.0 refuses older database versions. I rehearse on a copy of the production database to time the schema upgrade, take a consistent backup, stop the server and proxies, switch to the 8.0 repository with the /release/ URL, upgrade packages, fix the Nginx root to /usr/share/zabbix/ui and start the server while watching the log.

Afterwards I upgrade proxies to 8.0, import new templates and media types, and keep the backup until the team is sure.

6. The Zabbix database is 2 TB and housekeeping can’t keep up. What are your options?

Why they ask this: They want partitioning, retention and storage design.

How you might answer: First I cut retention: shorter history on high-frequency items and trends for long ranges. Then I partition history and trends by day on MySQL, or use TimescaleDB on PostgreSQL, and turn internal housekeeping off for those tables so old data is dropped a whole partition at a time.

For very high volumes 8.0 can also send history to Elasticsearch or ClickHouse through HistoryProvider, but I treat that as a separate project.

Quick quiz

Q1. Which internal item key shows how busy the synchronous pollers are?

  1. zabbix[queue]
  2. zabbix[process,poller,avg,busy]
  3. zabbix[wcache,history,pused]
  4. agent.ping
Show answer

B — The process key with type poller and avg,busy gives the busy percentage.

Q2. At what default level does the health template raise a utilization problem?

  1. 50%
  2. 65%
  3. 75%
  4. 95%
Show answer

C — {$ZABBIX.SERVER.UTIL.MAX} is 75, and it recovers below 65.

Q3. Which command reloads the configuration cache without restarting the server?

  1. zabbix_server -R config_cache_reload
  2. systemctl reload zabbix-server
  3. zabbix_server -t
  4. zabbix_get -k reload
Show answer

A — Runtime control commands go to the running server through -R.

Q4. The log says “The server does not match Zabbix database”. What is the safe fix after a failed upgrade?

  1. Edit dbversion by hand
  2. Restore the backup taken before the upgrade
  3. Delete the history tables
  4. Set AllowUnsupportedDBVersions=1
Show answer

B — Zabbix doesn’t downgrade schemas; the pre-upgrade backup is the rollback.

Q5. Where should you run zabbix_get to test web01 in this lab?

  1. On zbx01
  2. On your laptop
  3. On zbxprx01, the proxy that monitors web01
  4. On web01 against 127.0.0.1 only
Show answer

C — web01 accepts passive checks only from the proxy since Lesson 19.

Quick recap

  • The Zabbix server health template measures busy % per process type, cache use and the queue; its triggers fire over 75% for 10 minutes.
  • Fix slow checks first, then raise the matching Start* setting; fix the database before raising HistoryCacheSize.
  • zabbix_server -R gives you status, diaginfo, log levels per process, cache reloads and a forced housekeeper run without restarts.
  • Housekeeping, retention and a monthly look at table sizes keep the database healthy; partition when one housekeeper run takes too long.
  • For 7.0 to 8.0: check MySQL 8.4 and PHP 8.2, back up, switch to the /release/ repository, upgrade, fix the Nginx root and watch the log.
  • Troubleshoot in data order: collection, item, trigger, action.

What’s next

That’s the end of the Zabbix Monitoring course, and well done for building all of it by hand. Go back to the Zabbix Monitoring course page to review any lesson, then try the Prometheus Monitoring course to compare a pull-based system, and the Grafana Dashboards course to put Zabbix and Prometheus on one screen.

Further reading: Zabbix troubleshooting

Want to go deeper into Zabbix troubleshooting? The Zabbix manual covers internal items, server runtime control and upgrade procedures, and the requirements page lists the supported database versions. For the Linux side of slow servers see Linux performance monitoring, and for proxies revisit Lesson 19.

You can also see the full plan for this course on the Zabbix Monitoring course page.

Scroll to Top

This website uses cookies

We use a few cookies to keep this site working. If you allow it, we also use Google Analytics to count visits so we can improve our lessons. You can accept all, deny the optional ones, or choose what to allow.