Low-level discovery: custom LLD rules and prototypes

Zabbix low-level discovery (LLD) lets Zabbix find things on a host by itself (file systems, network interfaces, disks, services, websites) and create items, triggers and graphs for each one from a set of prototypes. Without it you’d add “free space on /var” by hand on every server, and forget it on the one where someone mounted /data last week.

In this lesson you look inside the built-in file system discovery you already have from the Linux template, filter and override it, and set per-mount disk thresholds with user macros that have context. Then you write your own discovery rule with a small script that returns JSON for a list of services, build item and trigger prototypes on it, and break discovery in the three ways that silently create nothing.

Where this lesson fits

Lesson 15 of 24 in Zabbix Monitoring · Phase 2: Items, triggers, templates and dashboards · Before this: Lesson 14, custom checks · Next: Lesson 16, email alerts

TimeYou needBy the end you can
About 85 minuteszbx01 and web01 from Lessons 1 to 14, Linux by Zabbix agent active linked to web01Read LLD JSON, build discovery rules with filters, overrides and prototypes, use macros with context for thresholds, and fix rules that discover nothing

What it is, in one line

Zabbix low-level discovery is a special item (a discovery rule) that returns a JSON list of things on a host; for each entry Zabbix fills LLD macros such as {#FSNAME} and creates real items, triggers and graphs from prototypes.

In Simple Words

The school attendance register

At the start of each term, the class teacher doesn’t write a new register by hand. The office sends her a list of the students admitted to her section, and she copies the same columns (name, roll number, attendance for each day) for every name on the list.

When a new child joins mid-term, the next list from the office includes him and a new row appears. When a child leaves, his row is kept for a while for the records and then removed.

The office list is the discovery JSON, the columns are the prototypes, and keeping a row for a while before removing it is what Zabbix calls lost resources.

Engineer's View

The pieces of a discovery rule

A discovery rule is an item that returns JSON: an array of objects, one per discovered thing. Each object has fields, and the rule maps them to LLD macros, either because the field names already look like {#FSNAME} or through LLD macro paths such as {#FSNAME} = $.fsname. The server then creates one real object per entry from each prototype, replacing the macros.

PartWhat it doesExample
Discovery ruleCollects the JSON list on an interval (often 1h)vfs.fs.get[short] on web01
LLD macrosNames for fields in each entry{#FSNAME}, {#FSTYPE}, {#SERVICE}
FiltersKeep or drop entries by regex on a macro{#FSTYPE} matches ^(ext4|xfs)$
Item, trigger, graph prototypesTemplates for objects per entryvfs.fs.dependent.size[{#FSNAME},pused]
OverridesChange prototypes for some entries onlyDo not create the trigger for /boot
Lost resourcesWhat to do when an entry disappearsDisable immediately, delete after 7 days

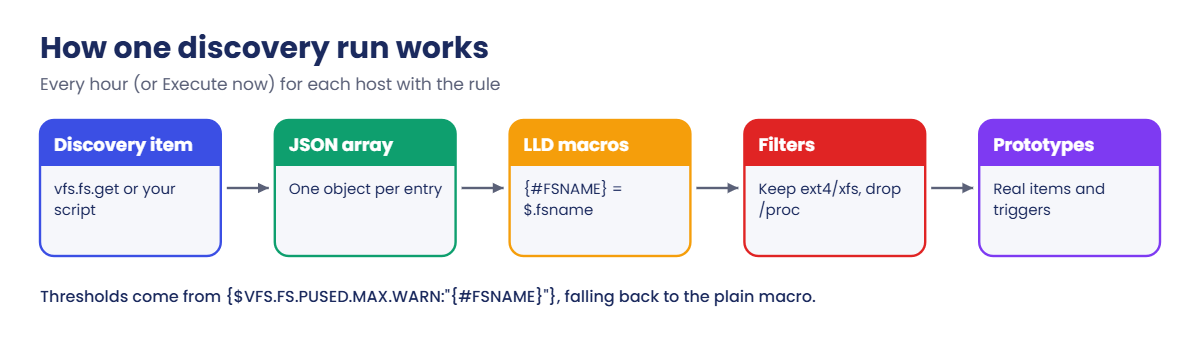
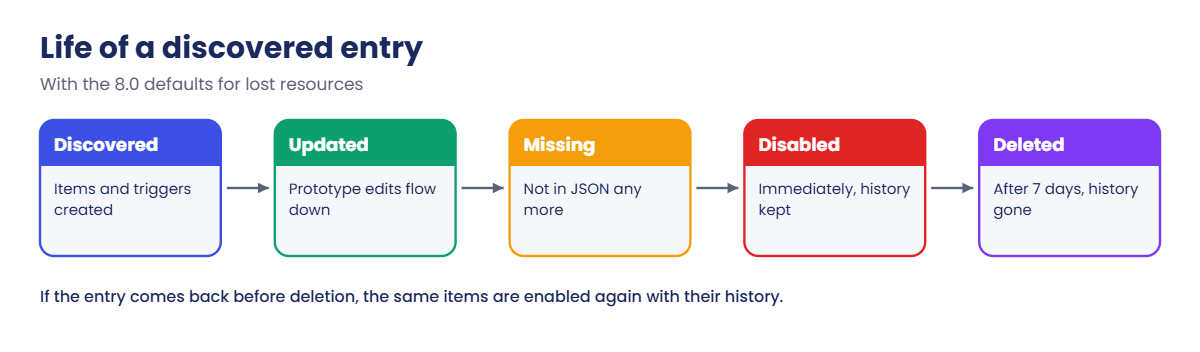
Thresholds per entry use user macros with context: {$VFS.FS.PUSED.MAX.WARN:"{#FSNAME}"} looks for a macro for that exact file system first, for example {$VFS.FS.PUSED.MAX.WARN:"/var"}, and falls back to plain {$VFS.FS.PUSED.MAX.WARN} (80 in the Linux template). In 8.0 the defaults for lost resources are Delete after 7d and Disable immediately, and nested discovery (discovery prototypes, added in 7.4) is there for advanced cases; plain discovery works the same as in 7.0 LTS.

How it works, step by step

1The rule returns JSON

On web01 the Linux template’s rule “Mounted filesystem discovery” runs vfs.fs.get[short] every hour, which returns a JSON array with fsname, fstype and usage for every mount. The rule’s LLD macros tab maps {#FSNAME} to $.fsname and {#FSTYPE} to $.fstype.

2Filters decide which entries count

The template’s filter keeps file system types like ext4 and xfs and drops paths like /dev, /sys, /run and /proc, all through macros such as {$VFS.FS.FSTYPE.MATCHES}. Only entries that pass every condition go on to prototypes. The diagram below follows one entry through the rule.

Zabbix low-level discovery run: JSON array, LLD macros, filters and prototypes

3Prototypes become real objects

For each remaining entry the server creates items such as “FS [/]: Space: Used, in %” with key vfs.fs.dependent.size[/,pused], plus triggers like “FS [/]: Space is low”. Created objects are read-only on the host; you change them by editing the prototype, and the next discovery run updates them all.

4Lost resources are cleaned up later

If a file system disappears from the JSON (unmounted, or filtered out), its items aren’t deleted at once. With the 8.0 defaults they are disabled immediately and deleted after 7 days, so a short unmount doesn’t wipe history. The second diagram shows the lifecycle of one discovered entry.

Zabbix low-level discovery lifecycle of a discovered entry and lost resources

5Built-in or custom discovery

You want to discoverUseLLD macros
Mounted file systemsvfs.fs.get or vfs.fs.discovery{#FSNAME}, {#FSTYPE}
Network interfacesnet.if.get (8.0) or net.if.discovery{#IFNAME}
systemd servicesagent 2 systemd.unit.discovery[service]{#UNIT.NAME}, {#UNIT.ACTIVESTATE}
Anything else (sites, queues, app instances)A UserParameter or script that prints JSONYour own, like {#SERVICE}
Items inside a JSON reply you already collectDependent discovery rule on that itemMapped with LLD macro paths

The JSON format is the same everywhere: an array of objects. Old-style output wrapped it as {"data":[...]}, which Zabbix still accepts, but a plain array is the current form.

Hands-on lab: discover file systems and watched services on web01

Before you run any command, double-check it

Read every command twice before you press Enter. Check the target: the server name, the user, the disk or device name, the path and the sizes. These commands are for learning and were tested in our lab, not on your system. At work, run the read-only commands first, follow your change process, make sure a backup exists, and ask a second person to check anything that changes or deletes data. You run them at your own risk.

Agent work happens on web01 and frontend work at https://zbx01.lab. web01 must be linked to Linux by Zabbix agent active (Lesson 4). You’ll add a second disk-like mount with a loop file so discovery has something new to find.

1Look at the raw discovery JSON

Run this on web01:

sudo zabbix_agent2 -t 'vfs.fs.discovery' | head -c 400; echo

You should see the start of the JSON (your mount list will differ):

vfs.fs.discovery                              [s|[{"{#FSNAME}":"/proc","{#FSTYPE}":"proc","{#FSOPTIONS}":"rw,relatime"},{"{#FSNAME}":"/sys","{#FSTYPE}":"sysfs","{#FSOPTIONS}":"rw,relatime"},{"{#FSNAME}":"/dev","{#FSTYPE}":"devtmpfs","{#FSOPTIONS}":"rw,relatime,size=4097460k,nr_inodes=1024365,mode=755"},

That’s real agent 2 output: one object per mount, with field names already in LLD macro form. The template uses the newer vfs.fs.get, whose objects have plain field names (fsname, fstype, bytes, inodes) and need LLD macro paths, but the idea is the same.

✅ Checkpoint: You can see the JSON array of mounts and recognise {#FSNAME} and {#FSTYPE}.

2Add a new mount and let discovery find it

Run this on web01:

sudo fallocate -l 200M /srv/data.img
sudo mkfs.ext4 -q /srv/data.img
sudo mkdir -p /data && sudo mount -o loop /srv/data.img /data
df -h /data

You should see:

Filesystem      Size  Used Avail Use% Mounted on
/dev/loop0      172M   24K  158M   1% /data

Discovery runs every hour, so speed it up: in Data collection > Hosts > web01 > Discovery, tick “Mounted filesystem discovery” and press Execute now. Within a minute or two, Latest data for web01 shows new items for /data.

Latest data (filter “FS [/data]”) then shows the new items:
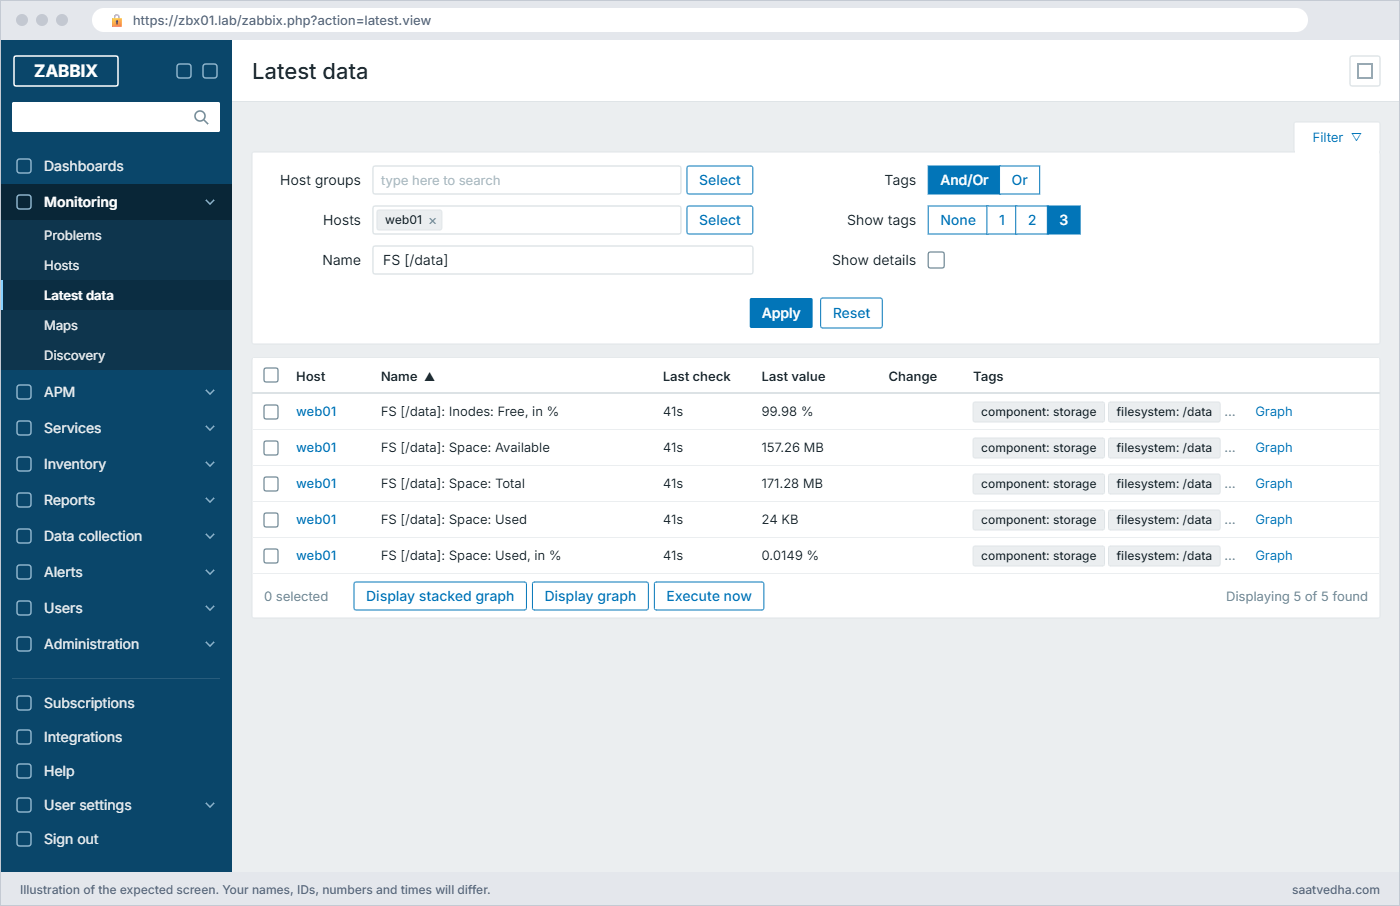
Zabbix low-level discovery: Latest data with the discovered FS [/data] items on web01
Latest data filtered on “FS [/data]”: items created by discovery, not by you

✅ Checkpoint: Items for FS [/data] appear on web01 without you creating any of them.

3Set a per-mount threshold with a macro context

Say /data may run fuller than the rest. On web01 open the Macros tab and add two host macros: {$VFS.FS.PUSED.MAX.WARN:"/data"} with value 95 and {$VFS.FS.PUSED.MAX.CRIT:"/data"} with value 98.

You need both, because the template’s “Space is critically low” trigger fires above 90% by default and the “Space is low” warning depends on it. Then fill /data past 80% and watch which trigger fires:

Run this on web01:

sudo fallocate -l 140M /data/fill.bin
df -h /data

You should see:

Filesystem      Size  Used Avail Use% Mounted on
/dev/loop0      172M  141M   18M  90% /data

Zabbix calculates about 89% here (df rounds up).

The general rule would fire “Space is low” (warn at 80), but /data’s own macro says 95, so no problem opens for /data while / still uses 80. Write a little more (sudo fallocate -l 10M /data/more.bin) to reach about 95.4%, and after five minutes (the trigger uses min(...,5m)) the warning appears for /data only. Context macros are how one template serves hundreds of mounts with different limits.

✅ Checkpoint: At about 90% no “Space is low” problem exists for /data; above 95% it does.

4Write a custom discovery script

Now your own rule: discover the services listed in a file and check each one is running. The script prints LLD JSON.

Run this on web01:

printf 'nginx\ncron\nssh\nzabbix-agent2\n' | sudo tee /etc/zabbix/watch-services.txt
sudo tee /etc/zabbix/scripts/svc_discovery.sh >/dev/null <<'EOF'
#!/bin/bash
# LLD: one entry per service name in watch-services.txt
LIST=/etc/zabbix/watch-services.txt
first=1
printf '['
while read -r svc; do
    [ -z "$svc" ] && continue
    case "$svc" in \#*) continue ;; esac
    [ $first -eq 0 ] && printf ','
    printf '{"{#SERVICE}":"%s"}' "$svc"
    first=0
done < "$LIST"
printf ']\n'
EOF
sudo chmod 755 /etc/zabbix/scripts/svc_discovery.sh
sudo -u zabbix /etc/zabbix/scripts/svc_discovery.sh

You should see:

nginx
cron
ssh
zabbix-agent2
[{"{#SERVICE}":"nginx"},{"{#SERVICE}":"cron"},{"{#SERVICE}":"ssh"},{"{#SERVICE}":"zabbix-agent2"}]

The first four lines are tee echoing the list; the last line is the discovery JSON, which I checked with Zabbix 8.0’s own JSON parser. Now register two keys, one for discovery and one flexible key to check a service:

Run this on web01:

sudo tee /etc/zabbix/zabbix_agent2.d/userparameter_lld.conf >/dev/null <<'EOF'
UserParameter=svc.discovery,/etc/zabbix/scripts/svc_discovery.sh
UserParameter=svc.active[*],systemctl is-active --quiet "$1" && echo 1 || echo 0
EOF
sudo zabbix_agent2 -R userparameter_reload
sudo zabbix_agent2 -t 'svc.active[nginx]'

You should see:

User parameters reloaded
svc.active[nginx]                             [s|1]

✅ Checkpoint: svc_discovery.sh prints valid JSON as the zabbix user, and svc.active[nginx] returns 1.
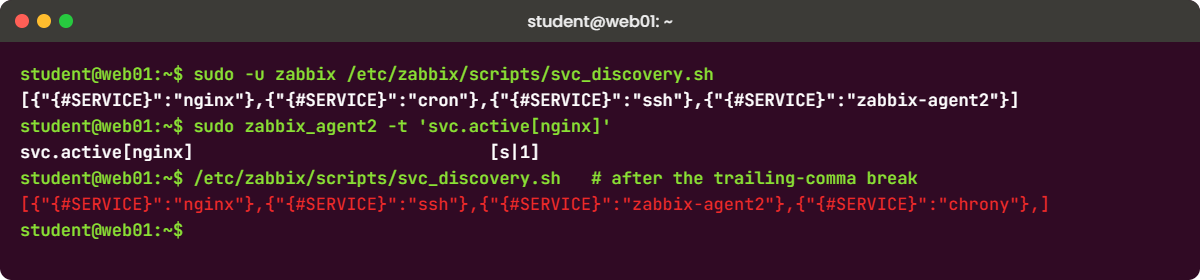
Zabbix low-level discovery lab: custom service discovery script output and a broken JSON example
Terminal output: the discovery script prints LLD JSON, and the same script after the trailing-comma break

5Create the discovery rule and prototypes

On web01 (or better, in the SaatVedha Nginx web template) open Discovery > Create discovery rule: Name Watched services, Type Zabbix agent (active), Key svc.discovery, Update interval 10m, Delete lost resources After 1d, Disable lost resources Immediately. Then add prototypes:

PrototypeNameKey or expressionOther
ItemService {#SERVICE}: runningsvc.active[{#SERVICE}]Zabbix agent (active), Numeric (unsigned), 1m, tag service = {#SERVICE}
TriggerService {#SERVICE} is not running on {HOST.NAME}max(/web01/svc.active[{#SERVICE}],3m)=0High

Press Execute now on the rule. The trigger uses max(...,3m)=0 so a service must be down for three minutes in a row, which ignores a quick restart.

Latest data, filtered by the tag service, shows:

Zabbix low-level discovery: four discovered Service running items on web01
Latest data with the four “Service …: running” items from your own discovery rule

✅ Checkpoint: Four “Service …: running” items exist on web01, all created by discovery.

6Add and remove entries, watch lost resources

Run this on web01:

echo 'chrony' | sudo tee -a /etc/zabbix/watch-services.txt
sudo sed -i '/^cron$/d' /etc/zabbix/watch-services.txt
/etc/zabbix/scripts/svc_discovery.sh

You should see:

chrony
[{"{#SERVICE}":"nginx"},{"{#SERVICE}":"ssh"},{"{#SERVICE}":"zabbix-agent2"},{"{#SERVICE}":"chrony"}]

Execute the rule again. A new item for chrony appears, and the cron item shows a yellow info icon in the item list saying it’s no longer discovered and will be deleted in about a day; with “Disable immediately” it also stops collecting at once. If chrony isn’t installed, its item reports 0 and its trigger fires after three minutes, which is correct.

✅ Checkpoint: chrony has an item, and the cron item is disabled with a “no longer discovered” note.

7Use an override to skip a trigger for one service

Suppose ssh is managed by another team and you only want its item, not its trigger. In the rule’s Overrides tab add an override named No trigger for ssh: Filter {#SERVICE} matches ^ssh$, Operation: Object Trigger prototype, Condition name contains is not running, action Create enabled: No (or Discover: No). Execute the rule.

The ssh item stays, but its trigger is removed or created disabled. Overrides keep one discovery rule for everything instead of copying rules per team.

Zabbix low-level discovery: override No trigger for ssh with a filter and a trigger prototype operation
The override “No trigger for ssh”: filter on {#SERVICE} and a trigger prototype operation

✅ Checkpoint: After execution, web01 has no enabled “Service ssh is not running” trigger, but still has the ssh item.

Break It, Then Fix It

Discovery rarely fails loudly; usually it creates nothing and you wonder why. Here are the three main causes.

1Invalid JSON: the rule goes Not supported

Break the script so it prints a trailing comma, a common mistake when building JSON in shell:

Run this on web01:

sudo sed -i "s/^printf ']/printf ',]/" /etc/zabbix/scripts/svc_discovery.sh
/etc/zabbix/scripts/svc_discovery.sh

You’ll get this output, and then on the rule after Execute now:

[{"{#SERVICE}":"nginx"},{"{#SERVICE}":"ssh"},{"{#SERVICE}":"zabbix-agent2"},{"{#SERVICE}":"chrony"},]
invalid JSON object value starting character at: ']'

That second line is the real message from Zabbix 8.0’s JSON parser for this input; the rule goes Not supported with it. Other inputs give other real messages: single quotes give invalid object name at: ..., plain text gives invalid object format, expected opening character '{' or '[' at: ..., and a missing bracket gives invalid array format, expected closing character ']'. Existing discovered items keep their data, but nothing new is created.

Fix:

Put the script back with sudo sed -i "s/^printf ',]/printf ']/" /etc/zabbix/scripts/svc_discovery.sh and test its output with python3 -m json.tool before trusting it. For anything bigger than a list of names, build the JSON with Python’s json module or jq rather than printf.

✅ Checkpoint: The script output passes python3 -m json.tool and the rule is supported again.

2Macro name mismatch: rule OK, nothing created

Edit the item prototype key to svc.active[{#SERVICES}] (an extra S) and execute the rule.

You’ll get this (info icon on the rule):

Cannot create item "svc.active[{#SERVICES}]": item with the same key already exists.

{#SERVICES} doesn’t exist in the JSON, so it stays as literal text: the first entry creates one useless item with that literal key, and every other entry produces the same key and fails with this message, once per entry. The real items for each service are now lost resources and start to be disabled. The same thing happens when the JSON says {#SERVICE_NAME} but prototypes use {#SERVICE}, or when LLD macro paths point at a field that isn’t there.

Fix:

Copy macro names from the real JSON, not from memory. Open the rule, press Test (or run the script), and compare names character by character; LLD macros are case sensitive.

✅ Checkpoint: With {#SERVICE} back in the key, items are created for every service again.

3A filter that excludes everything

On the rule’s Filters tab add {#SERVICE} matches ^Nginx$ (capital N) and execute.

You’ll get this:

Rule state: Normal, no error
Items: all "Service ...: running" items show the yellow "no longer discovered" icon

The rule works, the JSON is fine, and the filter dropped every entry because regex matching is case sensitive and the service is “nginx”. Lost resource rules then start disabling and later deleting items, which is the dangerous part: a careless filter change on a template can disable monitoring across hundreds of hosts.

Fix:

Use ^nginx$, or (?i)^nginx$ if case varies. Test filters on one host before changing a template, and keep “Delete lost resources” at a few days or more so a mistake is recoverable.

✅ Checkpoint: After fixing the filter, the nginx item is discovered again and the others behave as you intended.

This happened at work

The mount point nobody added

This one is from a data centre operator in Navi Mumbai, told by the engineer who was on shift. A customer’s storage team mounted a new 4 TB volume at /backup on twelve database servers on a Tuesday. On Saturday night it filled up, the nightly dumps failed, and the customer found out on Monday.

The servers were in Zabbix with an old hand-made template that had fixed items for /, /var and /home. Nobody had added /backup, because nobody knew it existed. The on-call engineer first checked whether alerts were muted, and then whether the disk triggers had the wrong thresholds.

The fix was to move those servers to the standard Linux template, whose file system discovery found /backup within an hour, plus a context macro {$VFS.FS.PUSED.MAX.WARN:"/backup"} = 90 because backup volumes run fuller on purpose. They also set “Delete lost resources” to 30 days, so temporary unmounts during maintenance don’t erase history.

Common mistakes and troubleshooting

MistakeWhat happensWhat to do instead
Building JSON with printf and string joinsA stray comma or quote makes the rule Not supportedUse python3 json or jq, and check with python3 -m json.tool
Typing LLD macro names from memoryNothing is created, or items clashCopy the names from the real JSON; they are case sensitive
Delete lost resources: ImmediatelyA short unmount or a filter mistake wipes historyDisable immediately, delete after several days
Copying the whole rule to change one thresholdTwo rules discovering the same things, duplicate keysUse a macro with context or an override
Discovery interval of 1 minuteExtra load for lists that rarely change1h is normal; use Execute now when testing
Editing discovered items on the hostChanges are refused or lost on the next runEdit the prototype instead
Filters tested on a template firstA wrong regex disables items on every linked hostTest on one host, then move to the template

Interview questions

Click a question to open it. Each one is written the way an interviewer would ask it. Under it you will see why they ask it and one way you could answer, in your own words.

Fresher level

1. What is low-level discovery in Zabbix, in one minute?

Why they ask this: They want the concept and the moving parts.

How you might answer: A discovery rule is an item that returns a JSON list of things on a host, like file systems or services. For each entry Zabbix fills LLD macros such as {#FSNAME} and creates items, triggers and graphs from prototypes.

When an entry disappears, lost resource settings disable and later delete the objects, so the monitoring follows the host without manual work.

2. How would you set a different disk threshold for /backup than for the rest of the file systems?

Why they ask this: Checks knowledge of macros with context.

How you might answer: I’d use a user macro with context, like {$VFS.FS.PUSED.MAX.WARN:”/backup”} = 90, on the host or template. The trigger prototype uses {$VFS.FS.PUSED.MAX.WARN:”{#FSNAME}”}, so Zabbix uses the context value for /backup and the default macro for others.

I wouldn’t copy the discovery rule or edit discovered triggers by hand.

2–5 years experience

3. Your custom discovery rule shows no error but creates no items. Walk me through your checks.

Why they ask this: Troubleshooting order for silent LLD failures.

How you might answer: First I run the script or key myself as the zabbix user and check the JSON with python3 -m json.tool. Then I compare the macro names in the JSON with the ones in the prototypes, because a typo means nothing resolves.

Then I check the Filters tab, since a filter that matches nothing gives a healthy rule with zero entries, and finally the info icons on the rule and items, which show messages like duplicate keys.

4. What do the lost resources settings do and how would you set them?

Why they ask this: Operational judgement about history and cleanup.

How you might answer: Disable lost resources stops collecting for items whose entry disappeared, and Delete lost resources removes them later with their history. In 8.0 the defaults are disable immediately and delete after 7 days.

For volumes and services that may come back after maintenance I keep delete at a week or more, so a short outage or a filter mistake doesn’t erase history.

Senior level

5. How would you monitor 400 microservice instances that come and go every hour?

Why they ask this: Senior design: discovery at scale and churn.

How you might answer: I’d avoid host-level items per instance and use discovery from a central source, for example an HTTP agent master item that reads the service registry or an exporter endpoint, with a dependent discovery rule and dependent item prototypes from the same reply. That keeps it to one request per cycle.

I’d set short lost resource times since instances are short-lived, aggregate at the service level for alerting, and consider Prometheus for very high churn, bringing only service-level health into Zabbix.

6. A filter change on a template disabled monitoring for half your fleet. How do you prevent that?

Why they ask this: Change control around LLD.

How you might answer: Discovery filters and overrides live in templates, so I version templates in Git and review the YAML diff before import, test on a single host first, and keep Delete lost resources long enough to recover. A trigger on the internal item for the number of unsupported items per host also helps catch it early.

After an incident I’d fix the filter, execute the rule, and items come back with their history if they were only disabled.

Quick quiz

Q1. What does a discovery rule return?

  1. A single number
  2. A JSON array of entries
  3. A list of triggers
  4. A YAML template
Show answer

B — Each object in the JSON array is one discovered entry with fields mapped to LLD macros.

Q2. Which macro form gives /data its own threshold?

  1. {$VFS.FS.PUSED.MAX.WARN}
  2. {#VFS.FS.PUSED.MAX.WARN:/data}
  3. {$VFS.FS.PUSED.MAX.WARN:”/data”}
  4. {VFS.FS.PUSED.MAX.WARN[/data]}
Show answer

C — User macros with context use {$MACRO:”context”} and fall back to the plain macro.

Q3. A script prints [{“{#SERVICE}”:”nginx”},]. What happens?

  1. Zabbix ignores the comma
  2. The rule goes Not supported with a JSON parse error
  3. Only nginx is discovered
  4. A service named “,” is created
Show answer

B — A trailing comma is invalid JSON, and the rule reports the parser error.

Q4. What are the 8.0 defaults for lost resources?

  1. Delete immediately
  2. Never delete
  3. Disable immediately, delete after 7 days
  4. Disable after 30 days
Show answer

C — The schema defaults are lifetime 7d and disable immediately.

Q5. Prototypes use {#SERVICES} but the JSON has {#SERVICE}. What do you see?

  1. Everything works
  2. Items cannot be created because the macro is not resolved
  3. The rule deletes the host
  4. Zabbix renames the macro
Show answer

B — LLD macros must match character for character; an unresolved macro produces errors or duplicate keys.

Quick recap

  • A discovery rule returns a JSON array; LLD macros name its fields and prototypes turn each entry into real items, triggers and graphs.
  • Filters choose which entries count, overrides change prototypes for some entries, and lost resource settings handle entries that disappear.
  • Macros with context, like {$VFS.FS.PUSED.MAX.WARN:”/data”}, give per-entry thresholds without copying rules.
  • Custom discovery is a script or UserParameter that prints valid JSON; test it as the zabbix user and with a JSON checker.
  • When nothing is created, check JSON validity, macro names and filters, in that order.

Next lesson

Lesson 16: Zabbix alerts by email: media types, actions and message macros → You send problem and recovery emails through Mailpit on zbx01, with actions, escalations and message templates.

Further reading: Zabbix low-level discovery

Want to go deeper into Zabbix low-level discovery? The official Low-level discovery, Custom LLD rules and User macros with context pages cover every option. For the agent side of custom keys, see Zabbix UserParameter, and for how templates carry discovery rules, Zabbix templates.

You can also see the full plan for this course on the Zabbix Monitoring course page.

Scroll to Top

This website uses cookies

We use a few cookies to keep this site working. If you allow it, we also use Google Analytics to count visits so we can improve our lessons. You can accept all, deny the optional ones, or choose what to allow.