Zabbix graphs, dashboards and network maps
-
Phase 1: Zabbix server and agents
-
Phase 2: Items, triggers, templates and dashboards
-
Phase 3: Alerts, proxies, SNMP and automation
A Zabbix dashboard is the screen your team keeps open on the big monitor: open problems at the top, a few graphs, the busiest hosts, and maybe a map that turns red when something breaks. So far you have collected values (Lesson 7) and turned them into problems (Lesson 8), but you’ve mostly looked at them in Latest data and the Problems page, one row at a time.
In this lesson you’ll learn the difference between the graphs Zabbix draws for free and the ones you build, then put together a global dashboard with two pages, share it with a read-only user, open the host dashboard that comes with a template, and draw a network map whose link goes red when web01 is in trouble. At the end you’ll load web01’s CPU on purpose and watch every widget react.
Where this lesson fits
Lesson 9 of 24 in Zabbix Monitoring · Phase 2: Items, triggers, templates and dashboards · Before this: Lesson 8, triggers and problem expressions · Next: Lesson 10, templates
| Time | You need | By the end you can |
|---|---|---|
| About 80 minutes | zbx01 and web01 from Lessons 1 to 8 (web01 linked to Linux by Zabbix agent active and sending data), the frontend at https://zbx01.lab | Build a shared Zabbix dashboard and network map, explain who can see what on it, and fix the three common “why is my widget empty” problems |
What it is, in one line
A Zabbix dashboard is a page of widgets (problems, graphs, gauges, maps and more) that reads live data from Zabbix, so a whole team can see the health of many hosts at a glance.
In Simple Words
The railway station display board
Think of the big display board at Mumbai CST. Nobody reads the railway’s timetable database, which has thousands of rows; people look at one board that shows only what matters right now: which train, which platform, late or on time, and a red line when a train is cancelled.
The board doesn’t run the trains. It reads from the same system the station master uses, and different boards show different things: the suburban board, the outstation board, and the small one at the ticket counter.
A Zabbix dashboard works the same way: the data and triggers already exist, and each widget is one small board showing one slice of it to whoever is allowed to see it.
Engineer's View
What a dashboard reads, and as whom
Every widget is a small frontend module that asks the Zabbix API for data on its own refresh interval (1 minute for most widgets, 15 minutes for slow-changing ones such as Clock and Map, and you can change it per widget). Values come from the history tables for recent periods and from trends (hourly min, avg and max) for long periods, which is why a one-year graph is smoother than a one-hour graph.
A dashboard has an owner, one or more pages, and sharing rules (Private or Public, plus user and user group shares with Read-only or Read-write). Sharing a dashboard never gives anyone access to hosts: each widget still checks the viewer’s host group permissions, and a widget pointing at a host the viewer can’t read shows No permissions to referred object or it does not exist!.
| Kind | Where you find it | Good for |
|---|---|---|
| Simple graph | Monitoring > Latest data, the Graph link next to any numeric item | A quick look at one item; nothing to configure |
| Custom (classic) graph | Data collection > Hosts or Templates > Graphs > Create graph | A fixed set of items drawn together, stacked or as a pie; reused in templates |
| Graph widget | Dashboard > Add widget > Graph | Modern SVG graph with host and item patterns, overrides and problem bars |
| Global dashboard | Dashboards > All dashboards | A team screen across many hosts, with pages and a slideshow |
| Host (template) dashboard | Monitoring > Hosts > Dashboards link | A ready-made page per host, defined once in the template |
| Network map | Monitoring > Maps | Hosts, links and their problem state on a drawing |
Zabbix 8.0 ships these widgets among others: Problems, Problems by severity, Graph, Graph (classic), Top hosts, Top items, Item value, Item history, Gauge, Honeycomb, Pie chart, Scatter plot (new in 8.0), Map, Clock, Host availability, Host card and Geomap. If you work on 7.0 LTS, the list is nearly the same, but dashboard import and export and the Scatter plot widget arrived with 8.0.
How it works, step by step
1Values become history, then trends
When the server receives a value it writes it to the history table for that value type and keeps it for the item’s history period (31 days by default). Once an hour the server also writes one trend row per numeric item with the minimum, average and maximum for that hour, and keeps trends much longer (365 days by default). Text and log items have history only, so they can’t be graphed.
2Widgets ask the API, the API checks permissions
When your browser loads a dashboard, each widget sends its own request to the frontend, which calls the API as you. The API returns only hosts and items your user group can read, and then picks history or trends depending on the time period you chose. The diagram below shows the whole path from the agent to the widget.
3Simple graph, custom graph or Graph widget
You never create a simple graph: Zabbix offers one for every numeric item. A custom graph is saved on a host or template with a fixed item list, a type (Normal, Stacked, Pie or Exploded) and colours, so every host that gets the template gets the graph. The Graph widget lives only on a dashboard and selects items by host and item patterns, so one data set like “all hosts in Lab/Web, item CPU utilization” grows on its own as you add hosts.
4Maps colour themselves from triggers
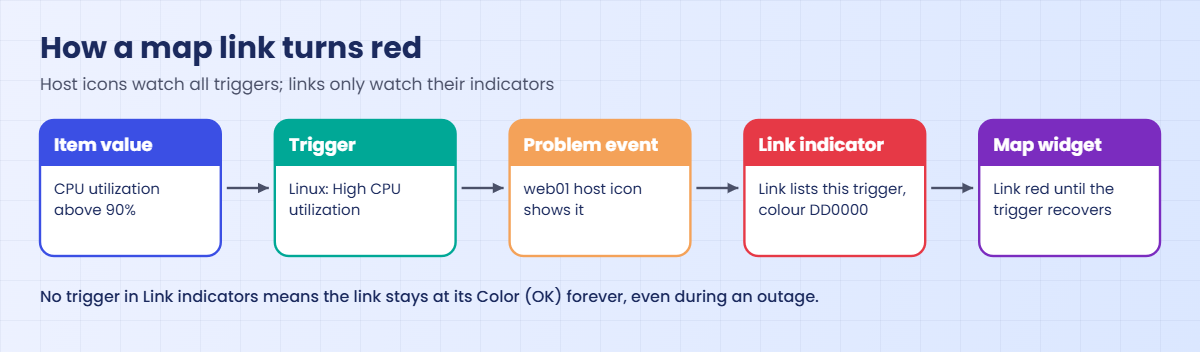
A map element can be a host, a host group, a trigger, another map or a plain image. A host element shows a problem icon and the problem name when any trigger on that host is in PROBLEM state. A link between two elements has a default colour, and it changes colour only when one of the triggers listed in its Link indicators is firing (8.0 also lets an indicator use an item value with thresholds).
The second diagram shows how a trigger reaches the map.
5Global dashboards and host dashboards
A global dashboard is built in the frontend and shows any hosts you pick. A host dashboard is defined inside a template, it has no host fields of its own, and it shows up for each host linked to that template under Monitoring > Hosts, in the Dashboards column. The template “Linux by Zabbix agent active” ships one called Linux Dashboard with two pages, Overview and Problems.
| Question | Global dashboard | Host dashboard (from a template) |
|---|---|---|
| Who creates it | Any user allowed to create dashboards | Whoever edits the template |
| Which hosts it shows | The hosts and groups you choose in each widget | Only the host you opened it from |
| Sharing | Owner, Private/Public, user and group shares | Visible to anyone who can read the host |
| Moves with export | Dashboards can be exported and imported (8.0) | Exported inside the template YAML |
Hands-on lab: build the Lab NOC dashboard and network map
Before you run any command, double-check it
Read every command twice before you press Enter. Check the target: the server name, the user, the disk or device name, the path and the sizes. These commands are for learning and were tested in our lab, not on your system. At work, run the read-only commands first, follow your change process, make sure a backup exists, and ask a second person to check anything that changes or deletes data. You run them at your own risk.
Everything happens in the frontend at https://zbx01.lab as Admin, except the CPU load in step 9, which runs on web01. web01 must be linked to Linux by Zabbix agent active and in the host group Lab/Web, as in Lessons 4 and 6. The Zabbix server’s own host is called zbx01 here and sits in the built-in group Zabbix servers; if you kept the default name “Zabbix server”, read zbx01 as that.
1Look at a simple graph
Open Monitoring > Latest data, type web01 in the Hosts filter and press Apply. In the Name filter type CPU utilization, then click the Graph link at the end of the row.
The graph opens for the last hour with one line, and the legend under it lists CPU utilization with its last, min, avg and max values. On an idle web01 the line stays at a few percent.
That’s a simple graph, made on the fly from history. Change the time selector at the top to Last 7 days and the line gets smoother, because periods longer than the history window and big ranges read hourly trends. Tick two items in Latest data and use Display graph at the bottom to see them together.
✅ Checkpoint: You opened a simple graph for web01 CPU utilization and changed its time period.
2Build a custom stacked graph on web01
Go to Data collection > Hosts, click Graphs in the web01 row, then Create graph. Fill in the form like this and press Add:
| Field | Value |
|---|---|
| Name | web01: CPU user vs system |
| Width / Height | 900 / 200 |
| Graph type | Stacked |
| Items (Add) | web01: CPU user time (colour 1A7C11), web01: CPU system time (colour F63100), web01: CPU iowait time (colour 2774A4) |
| Y axis MIN value | Fixed, 0 |
Now open Monitoring > Hosts, click Graphs in the web01 row and pick the new graph from the list.
The graph shows three coloured bands stacked on top of each other: green for user time, red for system time and blue for iowait. The legend under it lists each item with its values, and on an idle web01 the top edge stays at a few percent.
Stacked means each item sits on top of the one below it, so the top edge is the total. This graph is saved on web01 only; in Lesson 10 you’ll move graphs like this into a template so every web server gets one.
✅ Checkpoint: The graph “web01: CPU user vs system” shows three stacked colours under Monitoring > Hosts > Graphs.
3Create the “Lab NOC” global dashboard
Click Dashboards in the menu, then the All dashboards link at the top, then Create dashboard. In the Dashboard properties window set Name to Lab NOC, leave Owner as Admin and Default slideshow interval at 30 seconds, and press Apply. You’re now in edit mode with an empty grid.
Click Add widget (or click an empty spot on the grid), choose type Problems, name it Open problems, put Lab/Web and Zabbix servers in Host groups, tick Show operational data: With problem name and press Add. Stretch it across the top of the grid.
The widget titled Open problems shows the text No data found.
“No data found” is good news here: no open problems on those groups. If you still have problems open from Lesson 8, you’ll see them listed with severity colours.
✅ Checkpoint: The dashboard Lab NOC exists in edit mode with a Problems widget across the top.
4Add a Graph widget with patterns
Add another widget, type Graph, name CPU, all lab hosts. On the Data set tab type * in Host patterns (or pick web01 and zbx01) and CPU utilization in Item patterns. On the Displaying options tab leave History data selection at Auto, and on Legend tick Display min/avg/max.
Press Add.
The widget draws one line per host, web01 and zbx01, and because you ticked Display min/avg/max, the legend shows min, avg and max next to each host’s CPU utilization.
Because you used patterns, a new Linux host with the same item name will appear on this graph by itself. If zbx01 is missing, check that the zbx01 host has the item “CPU utilization” (it comes from the Linux template linked to it).
✅ Checkpoint: The Graph widget draws one line per host for CPU utilization.
5Add Top hosts, Item value, Gauge, Honeycomb and Clock
Add these five widgets the same way. Keep each small and arrange them in a row under the graph.
| Widget type | Name | Main settings |
|---|---|---|
| Top hosts | Busiest hosts | Host groups: Lab/Web, Zabbix servers. Columns: Add, Name “CPU %”, Data “Item value”, Item name “CPU utilization”; Add a second column “Memory %” with “Memory utilization”. Order by: CPU % |
| Item value | web01 load | Item: web01: Load average (1m avg), Decimal places 2 |
| Gauge | web01 memory | Item: web01: Memory utilization, Min 0, Max 100, Thresholds 70 (yellow) and 90 (red) |
| Honeycomb | CPU honeycomb | Host groups: Lab/Web, Zabbix servers. Item patterns: CPU utilization. Thresholds 50 (yellow) and 90 (red) |
| Clock | Time | Time type: Local time |
Press Save changes at the top right. Edits are not stored until you do this, and closing the tab before saving throws them away.

✅ Checkpoint: Lab NOC has seven widgets and you saved it.
6Add a second page and share the dashboard
Click Edit dashboard, then the arrow next to Add and choose Add page. Name it Maps and press Apply; you’ll put the map here in step 8. Save changes, then open the Actions menu (top right) and choose Sharing.
Before you share, create a viewer to share with. Lesson 18 covers users properly, so keep this one simple:
| Where | What to create |
|---|---|
| Users > User groups > Create user group | Group name “Lab viewers”; Host permissions tab: Lab/Web = Read; Add |
| Users > Users > Create user | Username “viewer01”, Groups “Lab viewers”, Password Zbx@View2026 (lab only); Permissions tab: Role “User role”; Add |
Back in Sharing, leave Type as Private, add “Lab viewers” to the List of user group shares with Read-only, and press Update.
✅ Checkpoint: Lab NOC has two pages (the first plus Maps) and is shared read-only with Lab viewers.
7Open the host dashboard that came with the template
Go to Monitoring > Hosts and click Dashboards in the web01 row. You land on Linux Dashboard, which belongs to the template Linux by Zabbix agent active. Use the page tabs at the bottom to move between Overview and Problems.
The Overview page has gauges for CPU and memory utilization, graphs named CPU, Memory, Disk and Network, a Used storage pie chart and small value widgets such as uptime, load average, number of CPUs and the agent version. The Problems page holds a Problems widget and a Top triggers widget for this host only.
You didn’t build this; it appeared because the template carries it, and every host linked to that template gets the same page with its own data. You can’t edit it here, only in the template, which is what Lesson 10 does.
✅ Checkpoint: Monitoring > Hosts > web01 > Dashboards opens Linux Dashboard with two pages.
8Draw the “Lab network” map
Open Monitoring > Maps, click Create map, set Name Lab network, Width 800, Height 450, and press Add. Click Edit next to the new map to open the map editor.
Next to Map element click Add three times. Click each new icon and set it like this, pressing Apply each time:
| Element | Type | Settings |
|---|---|---|
| 1 | Image | Label “Laptop / users”, Icon (default) Cloud_(96) |
| 2 | Host | Host zbx01, Label {HOST.NAME}, Icon (default) Server_(96) |
| 3 | Host | Host web01, Label {HOST.NAME}, Icon (default) Server_(96) |
Drag them into a line. Hold Ctrl, click zbx01 and web01, and next to Link click Add. Click the line between them, and under Link indicators click Add, choose the web01 trigger Linux: High CPU utilization and give it colour DD0000.
Set the link’s own Color (OK) to 00CC00, press Apply, and then Update at the top right to save the map.
Finally add a Map widget showing “Lab network” to the Maps page of Lab NOC and save the dashboard.
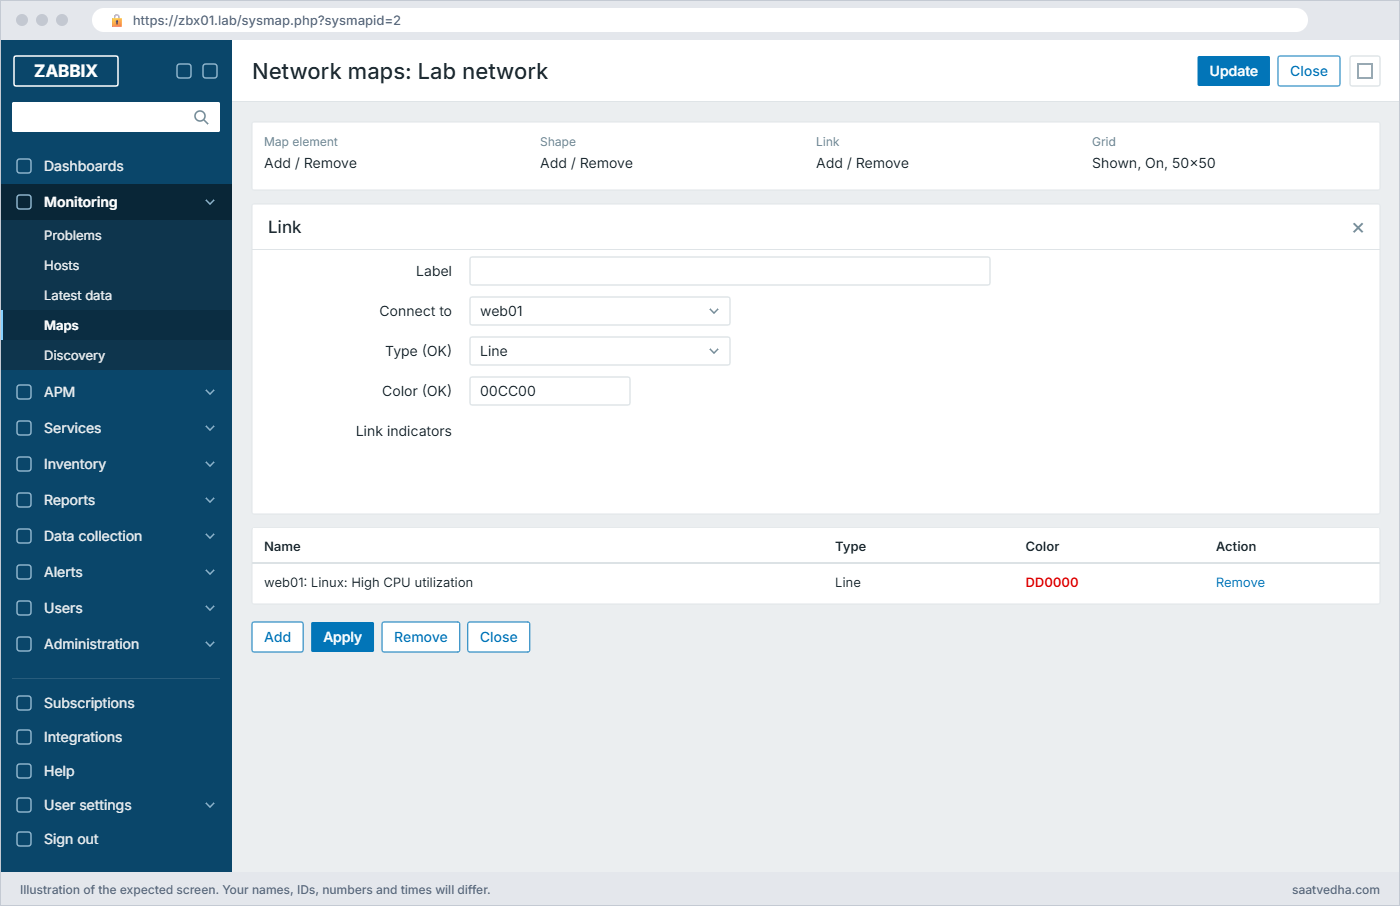
✅ Checkpoint: The map shows three elements and a green link between zbx01 and web01, and it sits on the Maps page of Lab NOC.
9Load web01 and watch everything react
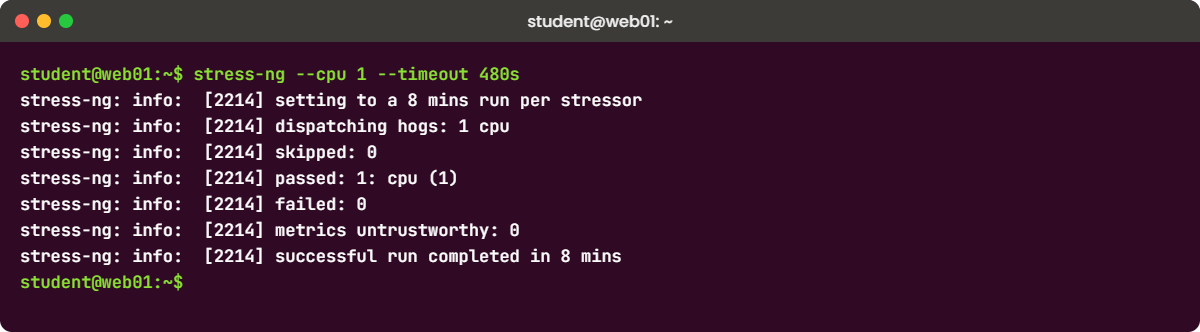
The template trigger fires when CPU utilization stays above 90% for 5 minutes (min(...,5m)>{$CPU.UTIL.CRIT}), so you need about six minutes of load on web01’s single vCPU. Install stress-ng and run it for eight minutes:
Run this on web01:
sudo apt install -y stress-ng
stress-ng --cpu 1 --timeout 480sYou should see this after eight minutes (your PID will differ):
stress-ng: info: [2214] setting to a 8 mins run per stressor
stress-ng: info: [2214] dispatching hogs: 1 cpu
stress-ng: info: [2214] skipped: 0
stress-ng: info: [2214] passed: 1: cpu (1)
stress-ng: info: [2214] failed: 0
stress-ng: info: [2214] metrics untrustworthy: 0
stress-ng: info: [2214] successful run completed in 8 minsWhile it runs, keep Lab NOC open. Within a minute or two the honeycomb cell for web01 goes red and Top hosts puts web01 first; after about five to six minutes the problem “Linux: High CPU utilization” appears in Open problems and on the Maps page the web01 icon shows the problem and the link turns red. When stress-ng stops, the trigger recovers and the link goes back to green.
✅ Checkpoint: During the load the web01 honeycomb cell and the map link turned red, and both returned to normal after the run.
Break It, Then Fix It
Three ways a dashboard or map looks broken while Zabbix itself is fine. None of these needs a snapshot.
1Widget says “No permissions to referred object”
Sign out and sign in as viewer01. Open Lab NOC from Dashboards > All dashboards.
You’ll get this error in two widgets:
web01 load (fine, web01 is in Lab/Web)
Busiest hosts shows web01 only, zbx01 is missing
CPU, all lab hosts shows web01 only
web01 memory (fine)
A widget that points at a zbx01 item:
No permissions to referred object or it does not exist!To see the last message, sign back in as Admin, add an Item value widget for zbx01: CPU utilization, save, and open the dashboard as viewer01 again. Sharing let viewer01 open the dashboard, but host permissions still decide which data each widget may show, and Lab viewers can only read Lab/Web. Widgets with patterns quietly drop the hosts the user can’t see, while widgets bound to one item show this error.
Fix (as Admin):
Either give the group read access to the group that holds zbx01 (Users > User groups > Lab viewers > Host permissions, add Zabbix servers = Read), or remove the zbx01 widget from a dashboard meant for this team. Decide which hosts a team should see first, and then build the dashboard to match.
✅ Checkpoint: As viewer01 the zbx01 widget either shows data (permission added) or is gone.
2The graph is empty because the item has no history yet
As Admin, create a new item on web01: Data collection > Hosts > Items > Create item, Name Root FS used %, Type Zabbix agent (active), Key vfs.fs.size[/,pused], Type of information Numeric (float), Units %, Update interval 1h. Add it to the CPU graph widget’s data set as a second data set and save.
You’ll get this in the widget legend:
web01: Root FS used % [no data]A graph can only draw values that exist in history. A new item gets its first value only after the agent picks up the new check (a few seconds to a minute with active checks) and then waits for the update interval, so with 1h you can stare at an empty line for an hour. The same happens forever if someone set History to Do not store, or if the item is disabled or unsupported.
Fix:
For testing, set the update interval to 1m and press Update. Then check Monitoring > Latest data for web01: once a value shows in the Last value column, the graph draws a line. If Latest data shows nothing after a few minutes, look at the item’s state in Data collection > Hosts > Items (a red i icon gives the reason).
✅ Checkpoint: Latest data shows a value for Root FS used % and the legend no longer says [no data].
3The map link never turns red
Open the Lab network map in the editor, click the link, delete the row under Link indicators, press Apply and Update. Run the load again on web01:
Run this on web01:
stress-ng --cpu 1 --timeout 480sYou’ll get this on the map:
web01 icon: problem shown, "Linux: High CPU utilization"
link zbx01 - web01: still green (Color (OK) 00CC00)The host icon reacts to any problem on that host because the host element looks at all its triggers. A link has no idea about hosts; it only changes colour for the triggers (or item thresholds) listed in its Link indicators, so with an empty list it stays at its OK colour forever. At work this shows up when someone copies a map from another site and the indicators still point at the old site’s triggers, or at triggers that were deleted with a template.
Fix:
Open the link again, add Linux: High CPU utilization for web01 under Link indicators with colour DD0000, Apply and Update. For real network maps, use the trigger that means “this path is broken”, such as an interface down or ICMP loss trigger, not a CPU trigger.
✅ Checkpoint: With the indicator back, the link turns red during the next load test.
This happened at work
The wall screen that stayed green
My team lead tells this one from a broadcaster in Mumbai, where the playout team had a big NOC screen showing a Zabbix map of the studios, encoders and the uplink to the satellite earth station. One evening during a live cricket match, viewers on two DTH platforms lost the HD feed for about four minutes, and the map on the wall stayed green the whole time.
The on-call engineer first assumed Zabbix was down, but the encoder host icons had in fact shown a problem, small and easy to miss from across the room. The thick link between the encoder rack and the uplink router, the thing everyone watched, had been copied from an older map and its link indicator still pointed at a trigger on an encoder that had been decommissioned months earlier.
The fix took ten minutes: point the link at the current “interface down” and “packet loss” triggers on both ends. The bigger change was a rule the team still follows: every map link must have at least one indicator, they check maps after every template change, and the NOC dashboard puts a Problems widget filtered to High and Disaster above the map, so a problem shows up as text even when a drawing is out of date.
Common mistakes and troubleshooting
| Mistake | What happens | What to do instead |
|---|---|---|
| Sharing a dashboard and assuming people can now see the hosts | Viewers get empty widgets or “No permissions to referred object” | Give host group Read permission through the user group; dashboard sharing only shares the layout |
| Building one Graph widget per host | Every new server means editing the dashboard | Use host and item patterns (or a host group) so new hosts appear by themselves |
| Graphing a text or log item | The item isn’t offered or the graph is empty | Only numeric items have graphs; turn text into numbers with preprocessing (Lesson 11) |
| Forgetting Save changes after editing | Your new widgets vanish when you leave the page | Press Save changes before you navigate away |
| Map links with no Link indicators | The link stays at its OK colour while the path is down | Give every link at least one trigger that means the path is broken |
| Putting 40 widgets on one page | The page loads slowly and nobody reads it | Keep one screen to one purpose; use more pages and the slideshow for the rest |
| Setting History to “Do not store” to save space | Graphs and widgets show nothing for that item | Shorten history and keep trends instead; trends are small |
Interview questions
Click a question to open it. Each one is written the way an interviewer would ask it. Under it you will see why they ask it and one way you could answer, in your own words.
Fresher level
1. What is the difference between a simple graph and a custom graph in Zabbix?
Why they ask this: They want to see that you know where graphs come from and which one to use when.
How you might answer: A simple graph is built on the fly for any numeric item; I open it from Latest data and there’s nothing to configure. A custom graph is saved on a host or template with a fixed list of items, colours and a type such as Stacked or Pie.
For one quick look I use the simple graph. When the same picture is needed on many hosts, I build a custom graph in the template so every linked host gets it.
2. A user says your new dashboard is empty for them but fine for you. What do you check?
Why they ask this: A basic permissions question: dashboard sharing versus host access.
How you might answer: First I check that the dashboard is shared with them or their group, otherwise they couldn’t open it at all. Then I check their user group’s host permissions, because each widget still needs Read on the host groups it shows.
If a widget says “No permissions to referred object or it does not exist!”, that’s the permission problem; if it says [no data], the items probably have no history for that period.
2–5 years experience
3. Walk me through building a NOC dashboard for 200 Linux servers.
Why they ask this: They want structure and scale thinking, not a list of widgets.
How you might answer: I’d start from what the NOC acts on: a Problems widget at the top filtered to Average and above, then Problems by severity, Top hosts for CPU, memory and disk, and Honeycomb by host group so one glance shows hot spots. Graph widgets use host groups and item patterns, so new servers show up without editing.
I’d share it read-only with the NOC user group, give that group Read on the right host groups, and use a second page with the network map and the slideshow on the wall screen. In 8.0 I can also export the dashboard and keep it in Git.
4. A map link stays green during an outage while the host icon turns red. Why?
Why they ask this: Checks whether you understand that links and elements use different logic.
How you might answer: A host element shows any problem on that host, but a link changes colour only for the triggers or item thresholds in its Link indicators. So the link either has no indicator or points at the wrong trigger, often one that was deleted or belongs to another host.
I’d open the link in the map editor, add the trigger that means the path is broken, like interface down or ICMP loss, and set its colour.
Senior level
5. Your management wants every team to have its own dashboards. How do you keep this from becoming a mess?
Why they ask this: They are checking ownership, permissions and standardisation at scale.
How you might answer: I’d standardise per-host views as template dashboards, so every host of a type gets the same screen with nothing to maintain per host. Team dashboards are global dashboards owned by a service account or team lead, shared with user groups, never with individual users.
Access to data is controlled by host group permissions and tag-based permissions, not by dashboard sharing. In 8.0 I’d export the important dashboards to YAML and review changes in Git like we do for templates.
6. A one-year graph of CPU looks smooth and misses spikes you know happened. Explain.
Why they ask this: They want to know you understand history versus trends.
How you might answer: For long periods Zabbix draws from trends, which keep one row per hour with min, avg and max, instead of raw history. The default line shows the hourly average, so a five-minute spike to 100% becomes a small bump.
I’d show the max in the graph (the Graph widget can draw aggregated or max values, and the classic graph can draw all three), or narrow the period so it reads history. If spikes matter long-term, I’d keep longer history for that item or add a trigger so the spike is recorded as an event.
Quick quiz
Q1. Where do you create a custom (classic) graph?
- Monitoring > Latest data
- Data collection > Hosts (or Templates) > Graphs
- Dashboards > Add widget
- Reports > Availability report
Show answer
B — Custom graphs are saved on a host or template under Data collection; simple graphs come from Latest data.
Q2. You share a dashboard read-only with a user group. What else does that group need to see data in the widgets?
- Nothing else
- Read-write on the dashboard
- Read permission on the host groups shown
- The Super admin role
Show answer
C — Sharing gives access to the dashboard layout only; each widget checks host group permissions.
Q3. Why does a long-period graph look smoother than a one-hour graph?
- The frontend blurs it
- It reads hourly trends instead of raw history
- The agent sends fewer values at night
- Graphs drop every second value
Show answer
B — Trends store hourly min, avg and max, which hides short spikes.
Q4. A map link stays at its OK colour during a problem. What is the most likely cause?
- The map is too large
- The link has no matching trigger in Link indicators
- The host has no icon
- The dashboard is private
Show answer
B — Links change colour only for the triggers (or item thresholds) listed as indicators.
Q5. Where does the “Linux Dashboard” for web01 come from?
- You must build it by hand
- It is a global dashboard shipped with Zabbix
- It is a template dashboard in Linux by Zabbix agent active
- It comes from Grafana
Show answer
C — Template dashboards appear for every host linked to the template under Monitoring > Hosts > Dashboards.
Quick recap
- Simple graphs exist for every numeric item; custom graphs are saved on hosts or templates; the Graph widget uses host and item patterns.
- Widgets read history for short periods and hourly trends for long ones, which is why long graphs hide spikes.
- Dashboard sharing shares the layout; host group permissions still decide what each viewer sees.
- Template dashboards give every linked host a ready-made page, like Linux Dashboard for web01.
- Map host icons react to any problem on the host, but links only react to their Link indicators.
Next lesson
Lesson 10: Zabbix templates: build, link, import and export → You turn the web01 Nginx items, triggers and graphs into the template “SaatVedha Nginx web”, add a template dashboard, and learn link, unlink and import safely.
Further reading: Zabbix dashboard
Want to go deeper into Zabbix dashboard? The official Dashboards and Dashboard widgets pages list every widget field, and Configuring a network map covers elements and link indicators. Compare how Grafana does the same job in Grafana dashboards for Prometheus, and go back to Zabbix triggers if the problem logic is still fuzzy.
You can also see the full plan for this course on the Zabbix Monitoring course page.
