Zabbix triggers and problem expressions

Items collect numbers; Zabbix triggers decide when those numbers mean trouble. In this lesson you write trigger expressions with last, avg, min, max, nodata, count and change, set severities and tags, stop flapping with a recovery expression, make one trigger depend on another, and work a problem the way a NOC engineer does: acknowledge, comment, close.

Triggers are where most alert noise is born, so you’ll also break three of them on purpose: a syntax error, a trigger that never fires because its time window is wrong, and a trigger that flaps every few minutes until hysteresis calms it down.

Where this lesson fits

Lesson 8 of 24 in Zabbix Monitoring · Phase 2: Items, triggers, templates and dashboards · Before this: Lesson 7, Zabbix items · Next: Lesson 9, Zabbix dashboards

TimeYou needBy the end you can
About 90 minuteszbx01 and web01 from Lesson 7, with the Nginx items on web01Write and tune trigger expressions, use recovery expressions and dependencies, and handle problems in the frontend

What it is, in one line

A Zabbix trigger is a logical expression over item values that turns into a PROBLEM when it becomes true and back to OK when it becomes false (or when a separate recovery expression says so).

In Simple Words

The pressure cooker whistle

A pressure cooker whistles when the pressure crosses a point, and your mother doesn’t run to the kitchen at the first hiss; she waits for the third whistle. When she turns the flame off, she doesn’t call it “safe” the moment the whistling stops either. She waits until the pressure has dropped properly before opening the lid.

A good trigger works the same way: count a few whistles before raising the alarm (a time window or count), and use a lower “safe to open” level before calling it fixed (a recovery expression).

Engineer's View

Trigger expression syntax in Zabbix 8.0

A trigger expression is function(/host/key,parameters) operator constant, combined with and, or and brackets. The host and key are written as /web01/proc.num[nginx], always with a leading slash. The expression is checked again every time a new value arrives for one of its items (or on a timer for time-based functions like nodata).

FunctionExampleTrue when
lastlast(/web01/proc.num[nginx])=0The latest value is 0
avg / min / maxavg(/web01/system.cpu.util,5m)>80The average over the last 5 minutes is above 80
min with countmin(/web01/net.tcp.service[http,,80],#3)=0The last three values were all 0 (#3 means 3 values, not 3 minutes)
nodatanodata(/web01/agent.ping,3m)=1No value at all arrived for 3 minutes
countcount(/web01/proc.num[nginx],10m,”eq”,0)>=3At least three zeros in the last 10 minutes
changechange(/web01/system.uptime)<0The value went down compared to the previous one (here: a reboot)
findfind(/web01/agent.version,,”like”,”7.”)=1A text value contains a string
SettingWhat it does
SeverityNot classified, Information, Warning, Average, High, Disaster; used for colours, filters and action conditions
OK event generationExpression (OK when the expression is false), Recovery expression (OK only when a second expression is true), None (never auto-close)
PROBLEM event generation modeSingle (one open problem per trigger) or Multiple (a new problem for every true evaluation, useful for log lines)
Allow manual closeLets a user close the problem from the Problems view
TagsKey-value labels on the problem, used for filtering, permissions and routing alerts
DependenciesSuppresses this trigger’s problem while the trigger it depends on is in PROBLEM state

How it works, step by step

1A new value arrives and the trigger is evaluated

When web01 sends a new proc.num[nginx] value, the server looks up every trigger that uses that item and recalculates it, using the value cache rather than the database where it can. Functions with a time window (avg(...,5m)) look back over that period; functions with a count (#3) look at the last N values.

2State changes create events

If the result changes from false to true, the server creates a PROBLEM event. If it changes from true to false, it creates an OK event that closes the problem. If nothing changes, nothing happens: no new event, no new alert.

The blueprint below shows the state machine, including what a recovery expression changes.

Zabbix triggers state machine from OK to PROBLEM event to recovery and OK event

3Recovery expressions add hysteresis

With OK event generation set to “Recovery expression”, the trigger needs two things to close: the problem expression must be false and the recovery expression must be true. Problem at >90 and recovery at <70 means a value that wobbles between 85 and 95 opens one problem and keeps it open, instead of opening and closing it every minute.

4Dependencies, tags and names

A trigger can depend on another one. If "Nginx is down on web01" depends on "Zabbix agent is not available", you don't get both problems when the whole VM is off. Tags such as component: nginx and scope: availability let you filter the Problems view and route alerts by team.

The blueprint below shows a small dependency chain.

Macro in a trigger nameBecomes
{HOST.NAME}The visible host name, e.g. web01
{ITEM.LASTVALUE}The item's latest value when the event is created (frozen in the event name)
{ITEM.LASTVALUE1}Same, for the first item in the expression; use 2, 3... for others
{$NGINX.PROC.MIN}A user macro, set on the host, template or globally
Zabbix triggers dependency chain: Nginx down depends on agent nodata, which depends on ping

5User macros with context

Hard-coded thresholds are the reason people copy triggers. Use a user macro instead: last(/web01/vfs.fs.dependent.size[/,pused])>{$FS.PUSED.MAX.WARN}. A macro with context lets one trigger have different thresholds per mount point or service: set {$FS.PUSED.MAX.WARN:"/var"} = 70 on the host, and the trigger for /var uses 70 while every other file system uses the default from the template.

The Linux templates you linked already work this way.

In 8.0 the event name (“Event name” field) can be different from the trigger name, and “Operational data” shows live values next to the problem without changing its name, which is the better place for {ITEM.LASTVALUE} when you want the current value rather than the one at the start.

Hands-on lab: triggers for Nginx and CPU on web01

Before you run any command, double-check it

Read every command twice before you press Enter. Check the target: the server name, the user, the disk or device name, the path and the sizes. These commands are for learning and were tested in our lab, not on your system. At work, run the read-only commands first, follow your change process, make sure a backup exists, and ask a second person to check anything that changes or deletes data. You run them at your own risk.

All steps use the frontend at https://zbx01.lab and commands on web01. Open Data collection > Hosts, click Triggers next to web01, and use Create trigger for each one. If you skipped Lesson 7, create the item “Nginx: number of processes” (proc.num[nginx], Zabbix agent (active), 1m) first.

1A simple trigger: Nginx down

FieldValue
NameNginx is down on {HOST.NAME}
SeverityHigh
Expressionlast(/web01/proc.num[nginx])=0
Tagscomponent: nginx, scope: availability
Allow manual closeticked

Use the Add button next to the Expression box (the expression constructor) to pick the host, item and function, or type it directly. Click Add to save.

Then on web01:

sudo systemctl stop nginx
sleep 90
sudo systemctl start nginx

Within about a minute of stopping Nginx, Monitoring > Problems shows a red High problem:

Zabbix triggers: Monitoring > Problems with the High problem Nginx is down on web01″ class=”wp-image-10205″ width=”1400″ height=”906″ style=”width:100%;height:auto;border-radius:10px;” /><figcaption style=Monitoring > Problems a minute after Nginx stopped

When you start Nginx again, the next value is 2 or 3, the expression becomes false, and the problem moves to RESOLVED in green.

✅ Checkpoint: Stopping Nginx raised “Nginx is down on web01” (High) and starting it resolved the problem.

2Use a time window: high CPU over 5 minutes

FieldValue
NameHigh CPU on {HOST.NAME}
Event nameHigh CPU on {HOST.NAME} (5m average above {$CPU.HIGH})
Operational dataNow: {ITEM.LASTVALUE1}
SeverityAverage
Expressionavg(/web01/system.cpu.util,5m)>{$CPU.HIGH}
Tagsscope: performance

Before saving, open web01’s Macros tab and add {$CPU.HIGH} = 70. Then generate some load on web01 for six minutes:

Run this on web01:

sudo apt install -y stress-ng
stress-ng --cpu 1 --cpu-load 95 --timeout 6m &

About five minutes later Problems shows:

Average  web01  High CPU on web01 (5m average above 70)    Now: 94.8 %

The 5-minute average needs a few minutes of high values before it crosses 70, which is the point: short spikes don’t wake anyone up. The operational data keeps updating while the event name stays as it was.

✅ Checkpoint: A High CPU problem appeared after a few minutes of load and resolved after stress-ng stopped.

3Detect silence with nodata

FieldValue
NameNo data from agent on {HOST.NAME} for 3 minutes
SeverityHigh
Expressionnodata(/web01/agent.ping,3m)=1
Tagsscope: availability

nodata is checked on a timer by the server (every 30 seconds), not when values arrive, because the whole point is that nothing is arriving. It’s the right tool for active agents and trapper items, where the server can’t poll to find out the host is gone.

✅ Checkpoint: The nodata trigger is saved and shows status OK while the agent is sending data.

4Add a dependency

Edit “Nginx is down on {HOST.NAME}”, open the Dependencies tab, click Add and select “No data from agent on web01 for 3 minutes”. Click Update. Now, if the whole agent goes silent, you get one “No data” problem instead of that plus a possibly stale “Nginx is down”.

Test it on web01:

sudo systemctl stop zabbix-agent2 nginx
sleep 300
sudo systemctl start zabbix-agent2 nginx

After about 3 minutes only the “No data” problem appears. Dependencies hide the dependent problem while the parent is in PROBLEM state; they don’t delete it.

✅ Checkpoint: With the agent stopped, Problems shows “No data from agent” and not “Nginx is down”.

5Acknowledge, comment and close a problem

Stop Nginx again to raise the “Nginx is down” problem. In Monitoring > Problems click Update in the problem’s row to open the problem update dialog. Type a message (“Checking, Nginx stopped for lab test”), tick Acknowledge and click Update.
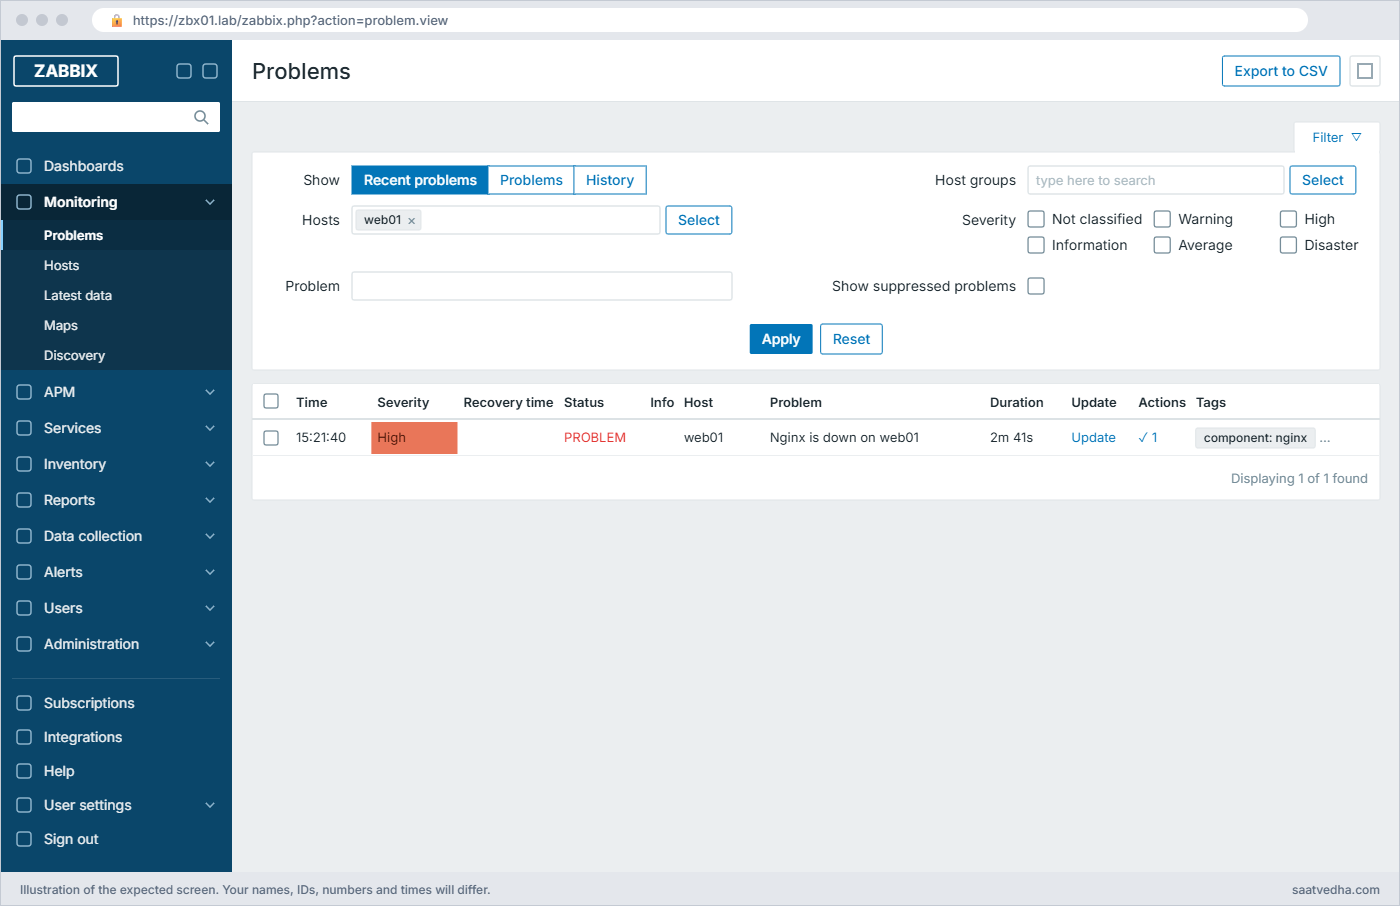
Zabbix triggers lab: the Nginx is down problem after acknowledging it with a message
After the update the Actions column shows the acknowledgement and the message count

Acknowledging tells the team someone is on it and, with escalations (Lesson 16), stops further notifications. Open the dialog again, tick Close problem and click Update. Because “Allow manual close” is ticked, the problem closes even though Nginx is still stopped; it opens again on the next value of 0, which is why manual close suits problems that can’t recover by themselves (like a log line), not this one.

Start Nginx again.

✅ Checkpoint: You acknowledged a problem with a message and closed it manually.

6Use a macro with context

The Linux template already has {$VFS.FS.PUSED.MAX.WARN} (80) and {$VFS.FS.PUSED.MAX.CRIT} (90) for file systems. On web01’s Macros tab, click Inherited and host macros to see them, then add {$VFS.FS.PUSED.MAX.WARN:"/"} = 40 and click Update.

Root is about 48% full on web01, and the template trigger uses min(...,5m), so within about five minutes Problems shows a Warning for root only, with the threshold from your macro in the event name and the live value in operational data.

Warning  web01  Linux: FS [/]: Space is low (used > 40%, total 14.6GB)    Space used: 48.5%

Remove the macro (or set it back to 80) and the problem resolves. This is how you raise or lower one threshold for one file system on one host without touching the template.

✅ Checkpoint: A context macro for “/” changed the warning threshold for the root file system only.

Break It, Then Fix It

Three trigger problems that cost real teams sleep. Make each one on web01, see the symptom, then fix it.

1Expression syntax error

Create a trigger with expression last(/web01/proc.num[nginx]=0 (a missing closing bracket) and click Add.

You’ll get this error:

Cannot add trigger
Invalid parameter "/1/expression": incorrect expression starting from "last(/web01/proc.num[nginx]=0".

The message points to where parsing failed, which is usually at or just before the real mistake. Other common versions are a missing leading slash (last(web01/...), a dangling and at the end (“starting from “””), or a key that doesn’t exist on the host, which gives Incorrect item key "no.such.key" provided for trigger expression on "web01".

Fix:

last(/web01/proc.num[nginx])=0

✅ Checkpoint: The corrected expression saves, or you cancel the duplicate trigger.

2A trigger that never fires

Create a trigger “Nginx down three times”: count(/web01/proc.num[nginx],1m,"eq",0)>=3, severity High. The idea is “Nginx was seen down three times”. Stop Nginx for five minutes and watch.

What you see:

Monitoring > Problems: no "Nginx down three times" problem
Trigger status: OK the whole time

The item is collected once a minute, so a 1-minute window never holds more than one or two values, and the count can’t reach 3. The author meant 5m. The same trap hits #3 versus 3m when someone later changes the item interval, and windows shorter than the interval in min, max and avg make a trigger depend on luck: it only sees whatever single value happens to fall inside the window.

Fix: make the window hold several collections:

count(/web01/proc.num[nginx],5m,"eq",0)>=3

A good rule is that a time window should hold at least three values of the item, so for a 1m item use 3m or more, and for “N times” checks the window must be longer than N intervals.

✅ Checkpoint: With a 5m window, stopping Nginx for about four minutes raises the problem.
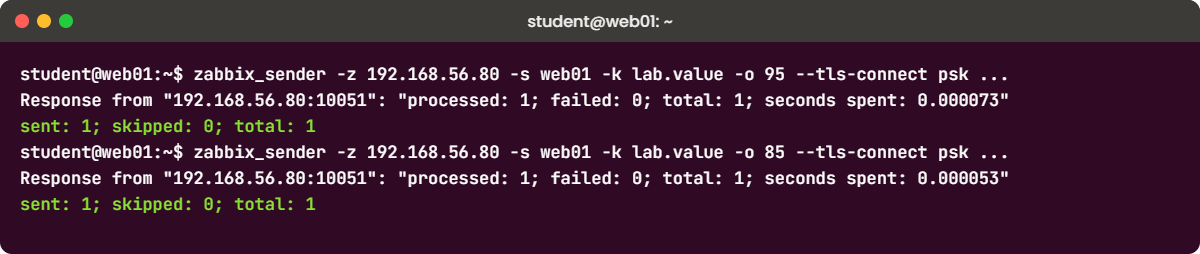
Zabbix triggers lab: zabbix_sender pushing test values over PSK to make a trigger flap
zabbix_sender sending wobbling test values from web01

3Flapping fixed with a recovery expression

Create a trapper item on web01 to feed test values: Name “Lab value”, Type Zabbix trapper, Key lab.value, Numeric (unsigned), Allowed hosts 192.168.56.81. Then a trigger “Lab value high on {HOST.NAME}: {ITEM.LASTVALUE}” with last(/web01/lab.value)>90, severity Average. Send values that wobble around 90:

Run this on web01:

sudo apt install -y zabbix-sender
for v in 95 85 93 88 96 84; do
  zabbix_sender -z 192.168.56.80 -s web01 -k lab.value -o $v --tls-connect psk \
    --tls-psk-identity "PSK web01" --tls-psk-file /etc/zabbix/zabbix_agent2.d/web01.psk
  sleep 20
done

You should see this for each value:

Response from "192.168.56.80:10051": "processed: 1; failed: 0; total: 1; seconds spent: 0.000073"
sent: 1; skipped: 0; total: 1

In Problems you’ll find three separate problems opened and closed in two minutes. With an email action that’s six emails for one wobbly value, which is how on-call engineers learn to ignore Zabbix. Note that in Zabbix 8.0 a trapper item’s Allowed hosts defaults to the macro {$TRAPPER.ALLOWED_HOSTS} (127.0.0.1 and ::1 only), which is why you set it to web01’s address.

Fix: edit the trigger and set:

OK event generation:   Recovery expression
Recovery expression:   last(/web01/lab.value)<70

Send the same values again. Now one problem opens at 95 and stays open through 85, 93 and 84, because none of them is below 70. Send -o 65 and it closes.

The event name still says 95, because macros in the name are frozen when the problem starts.

✅ Checkpoint: The wobbling values now produce one problem that only closes when the value drops below 70.

This happened at work

Four hundred emails before breakfast

My team lead tells this one from an insurance company in Kolkata. Their policy admin system ran on a cluster of application servers, and one trigger watched the database connection pool: last(/app/pool.used)>45 with a pool size of 50. Every evening during batch jobs the value bounced between 43 and 48 for hours.

The night shift got a problem-and-recovery email pair every few minutes, about 400 emails by morning, and they had set a mail filter to move them to a folder. One night the pool really did hit 50 and the application started timing out, and nobody noticed until branch staff called at 9:30 am.

The first fix someone proposed was to raise the threshold to 49, which would only have hidden the problem. What they actually did was change the trigger to min(/app/pool.used,10m)>45 with a recovery expression max(/app/pool.used,10m)<40, add a separate Disaster-level trigger for last()>=50, and tag both with the owning team.

The evening noise dropped to one or two problems a week, each one meaning something. The lesson my team lead repeats is that an alert people filter into a folder is worse than no alert at all, because it gives everyone the feeling that someone is watching.

Common mistakes and troubleshooting

MistakeWhat happensWhat to do instead
Using last() for noisy valuesProblems open and close every minute (flapping)Use avg/min/max over a window, or a recovery expression
A time window too short for the item intervalThe trigger rarely or never firesMake the window hold at least 3 values (3m for a 1m item)
Mixing #N and time#5 means 5 values, 5m means 5 minutes; the meaning changes if the interval changesUse time windows unless you really mean a number of values
Hard-coding thresholdsCopies of the same trigger with different numbers everywhereUse user macros, with context for per-object thresholds
No dependenciesOne dead host produces ten problemsMake service triggers depend on the host availability trigger
Putting {ITEM.LASTVALUE} in the name for live statusThe name shows the value at the start, not nowUse Operational data for live values
Leaving Allow manual close off for log-based triggersProblems from one-off log lines never closeUse Multiple event mode and manual close, or a nodata-based recovery

Interview questions

Click a question to open it. Each one is written the way an interviewer would ask it. Under it you will see why they ask it and one way you could answer, in your own words.

Fresher level

1. Write a trigger that fires when Nginx has no processes on web01, and explain each part.

Why they ask this: They check basic expression syntax.

How you might answer: I’d use last(/web01/proc.num[nginx])=0. last is the function, /web01/proc.num[nginx] is the host and item key with a leading slash, and =0 is the condition. With a 1m item it fires within a minute of Nginx stopping and closes when the next value is above zero.

2. What is the difference between avg(/host/key,5m) and avg(/host/key,#5)?

Why they ask this: A precise check on function parameters.

How you might answer: 5m means all values from the last five minutes, and #5 means the last five values whatever their age. With a 1m interval they’re about the same, but if someone changes the interval to 10s, #5 suddenly covers only 50 seconds, so I prefer time windows for most triggers.

2–5 years experience

3. A trigger keeps opening and closing every few minutes. How do you fix it without hiding real problems?

Why they ask this: They want to hear about hysteresis, not just raising the threshold.

How you might answer: I’d look at the item graph first to see the pattern. Then I’d use a window function like min over 5 or 10 minutes for the problem condition, and a recovery expression with a lower threshold, for example problem above 90 and recovery below 70, so it closes only when the value has clearly recovered.

If short spikes really matter, I’d keep a separate high-severity trigger on last() for the extreme value.

4. How do trigger dependencies work, and when would you use them?

Why they ask this: They check alert-noise thinking.

How you might answer: If trigger B depends on trigger A, B’s problem is suppressed while A is in problem state. I make service triggers like “Nginx down” or “port 443 unreachable” depend on the host availability or nodata trigger, and hosts behind a router depend on the router’s ping trigger, so a single failure gives one problem.

Senior level

5. Your NOC gets 2,000 problems a day and most are ignored. How would you clean up the triggers?

Why they ask this: They are testing whether you can run an alert-quality programme.

How you might answer: I’d export the problem list for a month from Reports > Top 100 triggers and the API, and group by trigger: the top 20 usually make most of the noise. For each I’d decide whether to fix the threshold with macros and context, add a window or hysteresis, add dependencies, lower the severity so it doesn’t page anyone, or delete it.

Then I’d agree with the teams that only Average and above go to people, add tags for ownership, and track the daily problem count as a metric.

6. When would you use PROBLEM event generation mode Multiple?

Why they ask this: They want to see you understand event modes beyond the default.

How you might answer: Multiple creates a new problem every time the expression evaluates to true, which suits log items and traps where each matching line is a separate incident, like each failed payment or each SNMP trap from a device. For normal metric triggers I keep Single, otherwise a constantly high value would create a new problem on every evaluation.

With Multiple I usually also allow manual close or set OK event generation to None and close them by tag correlation.

Quick quiz

Q1. Which expression is valid Zabbix 8.0 syntax?

  1. last(web01:proc.num[nginx])=0
  2. last(/web01/proc.num[nginx])=0
  3. {web01:proc.num[nginx].last()}=0
  4. last(proc.num[nginx])=0
Show answer

B — Since 5.4 the syntax is function(/host/key), with a leading slash.

Q2. What does nodata(/web01/agent.ping,3m)=1 detect?

  1. agent.ping returned 0
  2. No value arrived for 3 minutes
  3. The agent is slow
  4. Three failed pings
Show answer

B — nodata is true when no value at all has been received for the given period.

Q3. With problem expression last()>90 and recovery expression last()<70, what happens at a value of 80 during a problem?

  1. The problem closes
  2. The problem stays open
  3. A new problem opens
  4. The trigger becomes unknown
Show answer

B — The problem needs the recovery expression to be true, which requires a value below 70.

Q4. If trigger B depends on trigger A, what happens while A is in PROBLEM?

  1. B is deleted
  2. B’s problems are suppressed
  3. B fires twice
  4. A is closed
Show answer

B — Dependencies suppress the dependent trigger while its parent is a problem.

Q5. Where should you put {ITEM.LASTVALUE} if you want to see the current value next to a problem?

  1. Trigger name
  2. Event name
  3. Operational data
  4. Tags
Show answer

C — Macros in the name are frozen at event time; operational data is shown live.

Quick recap

  • Trigger expressions use function(/host/key,params) with last, avg, min, max, nodata, count, change and more.
  • A window should hold several values; a too-short window means a trigger that never fires.
  • Recovery expressions add hysteresis and stop flapping; dependencies stop one failure becoming many problems.
  • Tags, severities, event names and operational data make problems easy to filter, route and read.
  • User macros with context let one template trigger use different thresholds per host and per object.

Next lesson

Lesson 9: Zabbix graphs, dashboards and network maps → You put these items and problems on graphs, dashboards and a network map that turns red when a trigger fires.

Further reading: Zabbix triggers

Want to go deeper into Zabbix triggers? The Zabbix manual covers trigger expressions, the full list of trigger functions, dependencies and user macros with context. If you know Prometheus, compare these with Prometheus alerting rules, and go back to Zabbix items if you need the items used here.

You can also see the full plan for this course on the Zabbix Monitoring course page.

Scroll to Top

This website uses cookies

We use a few cookies to keep this site working. If you allow it, we also use Google Analytics to count visits so we can improve our lessons. You can accept all, deny the optional ones, or choose what to allow.