Zabbix items: types, keys and intervals
-
Phase 1: Zabbix server and agents
-
Phase 2: Items, triggers, templates and dashboards
-
Phase 3: Alerts, proxies, SNMP and automation
Everything Zabbix knows comes from Zabbix items. A template gives you hundreds of them, but sooner or later you need your own: is the web server port answering, how many Nginx workers are running, how fast is the home page, how many errors appeared in a log. This lesson takes items apart (type, key, value type, interval, history and trends) and then you build your own items for Nginx on web01.
You’ll also meet the three most common item errors on purpose, so that “Not supported” with a small red icon never scares you again. Lessons 8 to 11 build triggers, graphs, templates and preprocessing on top of the items you create here.
Where this lesson fits
Lesson 7 of 24 in Zabbix Monitoring · Phase 2: Items, triggers, templates and dashboards · Before this: Lesson 6, Zabbix auto-registration · Next: Lesson 8, Zabbix triggers
| Time | You need | By the end you can |
|---|---|---|
| About 85 minutes | zbx01 and web01 from Lesson 6 (web01 auto-registered with PSK) | Choose the right item type, key, value type and interval, create items for a service, and fix unsupported items |
What it is, in one line
A Zabbix item is one thing you measure on one host: it has a type (how the value is collected), a key (what exactly to collect), a value type (how to store it) and an interval (how often).
In Simple Words
The health check-up form
When you go for an annual health check-up, the clinic hands you a form with rows: blood pressure, sugar fasting, sugar after food, weight. Each row says how the reading is taken (machine, blood test, weighing scale), the unit (mmHg, mg/dL, kg) and how often (blood pressure every visit, a full blood test once a year).
The clinic keeps every reading for a few months, and after that it keeps only the monthly average, lowest and highest, because nobody needs your exact weight on a Tuesday three years ago. Each row on that form is an item; the full readings are history and the monthly summary is trends.
Engineer's View
What makes up an item
| Field | What it means | Example |
|---|---|---|
| Type | Who collects the value and how | Zabbix agent, Zabbix agent (active), Simple check, HTTP agent, Calculated, Dependent item, Script, Zabbix trapper, SNMP agent |
| Key | What to collect, with parameters in square brackets | vfs.fs.size[/,pused], net.tcp.service[http,,80], proc.num[nginx] |
| Type of information | How the value is stored | Numeric (unsigned), Numeric (float), Character, Log, Text, Binary, JSON (new in 8.0) |
| Units | Display only; B, bps, %, s and others get automatic scaling | B shows 2.5 GB instead of 2684354560 |
| Update interval | How often to collect | 1m, 30s, 1h; plus custom intervals |
| Timeout | How long to wait (per item since 7.0, defaults from Administration > General > Timeouts) | 3s by default |
| History / Trends | How long raw values and hourly aggregates are kept | 31d / 365d by default; trends only for numeric types |
The key is the heart of an item. It must be unique on a host, and it must be something the collector understands: an agent key for agent items, an SNMP OID for SNMP items, a URL for HTTP agent items. Parameters in square brackets are comma-separated, and an empty parameter means “use the default”, which is why net.tcp.service[http,,80] has two commas.
How it works, step by step
1Item types: who does the work
| Type | Who collects | Typical use |
|---|---|---|
| Zabbix agent / agent (active) | Agent on the host, polled or pushed | CPU, memory, disks, processes, files, logs (active only) |
| Simple check | Zabbix server or proxy itself | net.tcp.service, icmpping: is a port or host reachable from the monitoring side |
| HTTP agent | Server or proxy, using libcurl | REST APIs, status pages, JSON endpoints |
| Calculated | Server, from other items | Formulas like percent used from two items |
| Dependent item | Server, from a master item’s value | Many values from one JSON or text response (Lesson 11) |
| Script | Server or proxy, JavaScript | Multi-step API calls |
| Zabbix trapper | Something else pushes the value with zabbix_sender | Backup scripts, cron jobs (Lesson 14) |
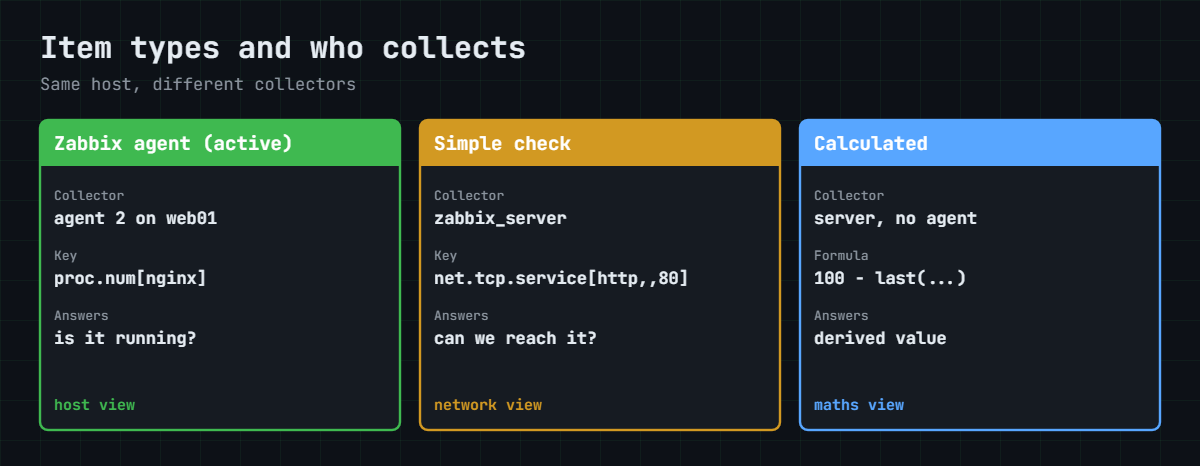
An agent check tells you how the host sees itself; a simple check tells you how the network sees it. A web server whose Nginx is running but whose port is blocked by a firewall looks fine to the agent and broken to a simple check, which is why good monitoring usually has both. The terminal below shows a few agent keys answered one by one.
2Keys and parameters
Each agent key has documented parameters. vfs.fs.size[/,pused] means file system “/” and mode “pused” (percent used). proc.num[nginx] counts processes named nginx. web.page.get[localhost,/,80] fetches a page and returns headers and body as text. Get a parameter wrong and the item becomes “Not supported” with a message that usually says exactly what’s wrong.
3Value types, history and trends
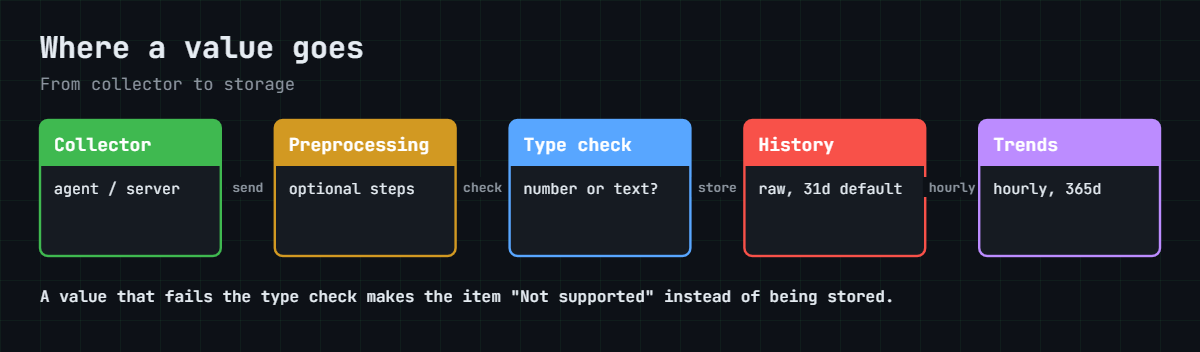
The value type decides how Zabbix stores and processes a value. Numbers can go into graphs, trends and maths; Character, Text and Log are stored as text and can be searched with trigger functions like find(). If the collector returns “vm” but the item says Numeric (unsigned), the value is rejected and the item goes unsupported, as you’ll see in Break It.
The diagram below shows where values go once they’re collected.
4Intervals: normal, flexible and scheduled
| Update interval field | Meaning |
|---|---|
| 1m | Every minute, all the time |
| 1m plus flexible 10s / 1-5,09:00-18:00 | Every 10 seconds during weekday office hours, every minute otherwise |
| 0 plus scheduling h9m0 | Only at 09:00 every day (delay 0 means “only on the schedule”) |
| 1h for inventory-style values | System name, OS version, agent version rarely change |
Every value costs database space and server work. A rough rule: 1,000 items every 60 seconds is about 17 new values per second, so if you halve every interval you double that number. Reports > System information shows “Required server performance, new values per second” for your whole installation, and it’s worth checking after big template changes.
Hands-on lab: build Nginx items on web01
Before you run any command, double-check it
Read every command twice before you press Enter. Check the target: the server name, the user, the disk or device name, the path and the sizes. These commands are for learning and were tested in our lab, not on your system. At work, run the read-only commands first, follow your change process, make sure a backup exists, and ask a second person to check anything that changes or deletes data. You run them at your own risk.
You’ll install Nginx on web01 and create items that watch it from three angles: the agent (process count, page), the server (simple TCP check) and a calculated percentage. Commands run on web01 unless marked zbx01. web01 talks to zbx01 with PSK since Lesson 6, so zabbix_get commands include the PSK options; if you skipped Lesson 6, drop them.
1Install Nginx on web01
Run this on web01:
sudo apt install -y nginx
sudo ufw allow from 192.168.56.0/24 to any port 80 proto tcp
systemctl is-active nginx
curl -sI http://localhost/ | head -1You should see this:
active
HTTP/1.1 200 OKThe ufw rule lets zbx01 reach the web server for the simple check later. Nginx starts a master process and one worker per CPU core by default, which is what the process count will show.
✅ Checkpoint: Nginx is active on web01 and returns HTTP 200 on localhost.
2Try the keys from the server first
Run this on zbx01 (put web01’s key in /tmp/web01.psk first, chmod 600):
P="--tls-connect psk --tls-psk-identity 'PSK web01' --tls-psk-file /tmp/web01.psk"
for k in 'proc.num[nginx]' 'net.tcp.service[http,,80]' 'vfs.fs.size[/,pused]' 'nginx.status'; do
echo "== $k"; eval zabbix_get -s 192.168.56.81 -k "'$k'" $P
doneYou should see this (the disk value is live and will differ):
== proc.num[nginx]
2
== net.tcp.service[http,,80]
1
== vfs.fs.size[/,pused]
48.534803
== nginx.status
ZBX_NOTSUPPORTED: Unsupported item key.Testing keys with zabbix_get before creating items saves a lot of clicking. Two processes is one master and one worker: Ubuntu’s Nginx uses worker_processes auto, which starts one worker per CPU core, and web01 has 1 vCPU. nginx.status isn’t a real agent key, which you’ll use in Break It.
✅ Checkpoint: zabbix_get returns numbers for proc.num[nginx] and net.tcp.service, and “Unsupported item key.” for nginx.status.

3Create an agent item: Nginx processes
Open Data collection > Hosts, click Items next to web01, then Create item:
| Field | Value |
|---|---|
| Name | Nginx: number of processes |
| Type | Zabbix agent (active) |
| Key | proc.num[nginx] |
| Type of information | Numeric (unsigned) |
| Update interval | 1m |
| History / Trends | 31d / 365d (defaults) |
| Tags | component: nginx |
Click Add. Use the active type because web01 runs active checks (Lesson 4); a passive “Zabbix agent” item would also work here since web01 still accepts passive PSK connections. Tags let you filter Latest data and, later, route alerts.
✅ Checkpoint: The item “Nginx: number of processes” appears in web01’s item list as Enabled.
4Use Test before you save
Create a second item and, before saving, click Test at the bottom of the form:
| Field | Value |
|---|---|
| Name | Nginx: home page |
| Type | Zabbix agent (passive, so Test can query it) |
| Key | web.page.get[localhost,/,80] |
| Type of information | Text |
| Update interval | 5m |
| History | 7d |
In the Test dialog tick Get value from host and click Get value and test. Zabbix asks the agent through the server, using the host interface 192.168.56.81:10050 and its PSK settings, and shows the result. The Test button can only fetch a value for item types the server polls itself, so for “Zabbix agent (active)” items it can test preprocessing but can’t get a value from the host.
You should see the HTTP response headers followed by the Nginx welcome page HTML. Close the dialog and click Add.

✅ Checkpoint: Test returned an HTTP 200 response, and the “Nginx: home page” item is saved with type Text and 7d history.
5Add a simple check from the server side
| Field | Value |
|---|---|
| Name | Nginx: HTTP port reachable from Zabbix |
| Type | Simple check |
| Key | net.tcp.service[http,,80] |
| Host interface | 192.168.56.81:10050 (simple checks use the IP, not the port) |
| Type of information | Numeric (unsigned) |
| Update interval | 1m |
A simple check is run by the server itself, so it tests the network path from zbx01 to web01 port 80, including web01’s firewall. It returns 1 when the TCP connection works and 0 when it doesn’t, which is not an error, just a value.
✅ Checkpoint: The simple check item is saved and, after a minute, Latest data shows 1.
6Add a calculated item
Calculated items do maths on other items. This one turns two template items into a percentage of memory used:
| Field | Value |
|---|---|
| Name | Memory used, % |
| Type | Calculated |
| Key | mem.used.pct |
| Formula | 100 – last(/web01/vm.memory.size[pavailable]) |
| Type of information | Numeric (float) |
| Units | % |
| Update interval | 1m |
The key of a calculated item is just a unique name you choose. The formula uses the same function syntax as triggers: last(/host/key). Calculated items are evaluated by the server, so they don’t put any load on the agent.
✅ Checkpoint: “Memory used, %” shows a value in Latest data that, added to Available memory in %, makes 100.
7Watch the new items in Latest data
Open Monitoring > Latest data, filter host web01 and tag component: nginx, and click Apply.
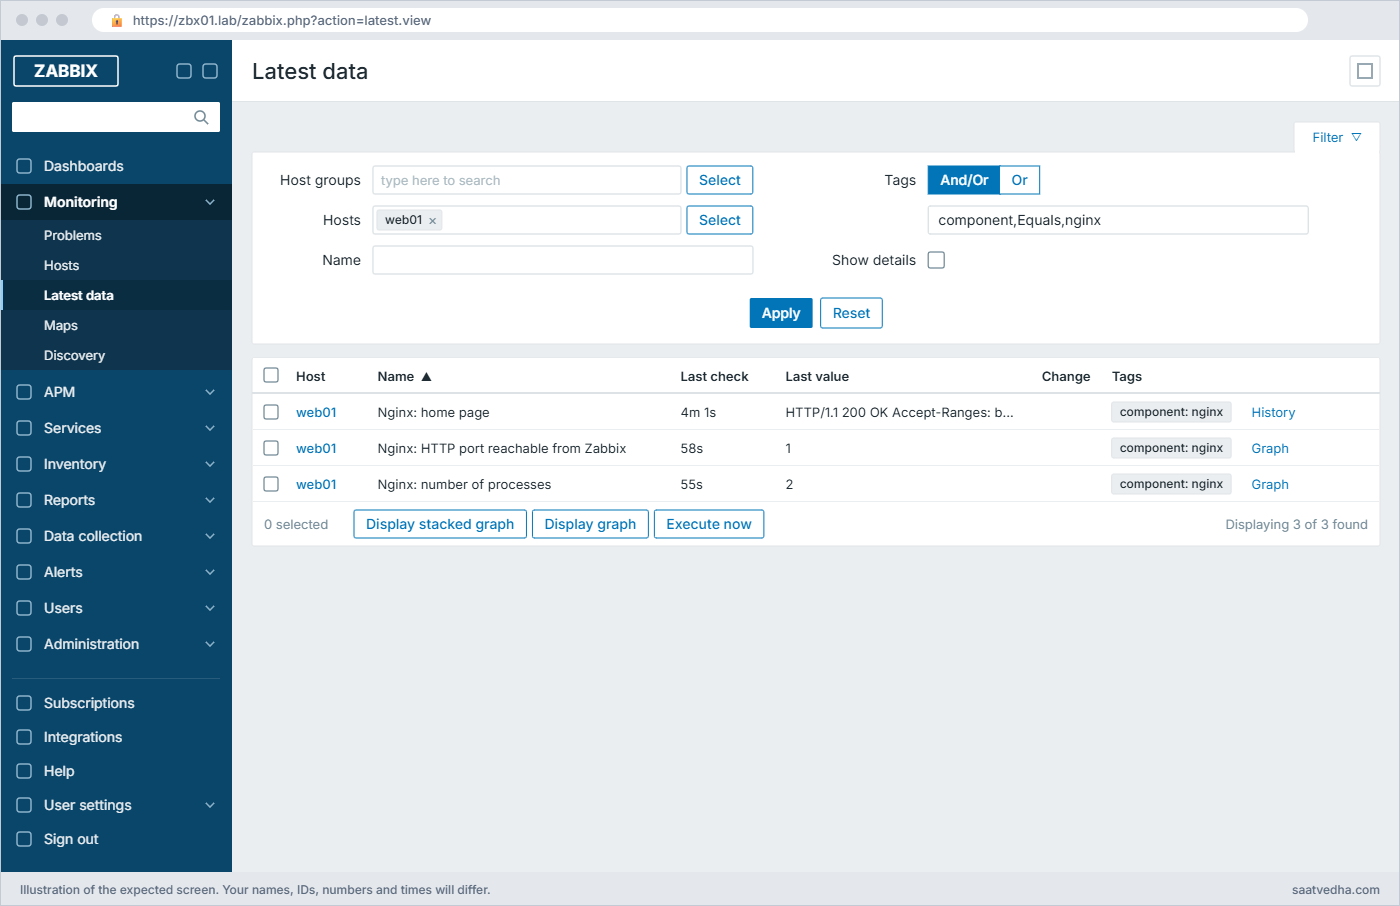
Click History on the home page item to see the full text, and Graph on a numeric item to see its values over time. Text items have no graph, only a list of values.
✅ Checkpoint: All three Nginx items show recent values in Latest data.
8Use a flexible interval
Edit “Nginx: HTTP port reachable from Zabbix” and under Custom intervals add a Flexible row: interval 10s, period 1-5,09:00-18:00. Click Update. During weekday office hours the check now runs every 10 seconds, and every minute the rest of the time.
Note that Zabbix uses the server’s time zone for these periods.
✅ Checkpoint: The item shows “1m” with a custom interval, and during 09:00 to 18:00 on weekdays Last check updates every 10 seconds.
Break It, Then Fix It
Three item errors that every Zabbix admin meets. Each one shows a red “Not supported” icon in the item list, and hovering over it shows the reason.
1“Unsupported item key.”
Create an item on web01: Name “Nginx status (wrong key)”, Type Zabbix agent (active), Key nginx.status, Numeric (unsigned), interval 30s.
After a minute, the item list shows:
Nginx status (wrong key) nginx.status 30s Not supported
Info: Unsupported item key.The agent doesn’t have a key called nginx.status. Agent 2 has plugins for many things, but not this name; the Nginx stub_status page is read with an HTTP agent item or with the “Nginx by Zabbix agent” template’s web.page.get plus preprocessing (Lesson 11). Test any key on the host itself with zabbix_agent2 -t before you create the item, and look up the real key names in the agent 2 item key list in the manual.
Fix: delete the item, and test keys on the host first:
# on web01
sudo zabbix_agent2 -t nginx.status
sudo zabbix_agent2 -t 'web.page.get[localhost,/,80]' | head -c 120nginx.status [m|ZBX_NOTSUPPORTED] [Unsupported item key.]
web.page.get[localhost,/,80] [s|HTTP/1.1 200 OK
Server: nginx/1.28.3 (Ubuntu)The [m|ZBX_NOTSUPPORTED] line is exactly what the server would get, and the second command shows a key that works.
✅ Checkpoint: The wrong item is deleted and zabbix_agent2 -t shows which keys the agent understands.
2Wrong value type
Create an item: Name “Hostname as number”, Type Zabbix agent (active), Key system.hostname, Type of information Numeric (unsigned). Zabbix refuses to save it because the Linux template already has this key:
Cannot add item
An item with key "system.hostname" already exists on the host "web01".Keys must be unique per host. Add a harmless parameter to make it unique, system.hostname[host], and save. A minute later:
Hostname as number system.hostname[host] Not supported
Info: Value of type "string" is not suitable for value type "Numeric (unsigned)". Value "web01"The agent returned text, and the item expected a number, so the server rejected it. This happens a lot with HTTP agent items that sometimes return an error page instead of a number. The fix is to choose the right type of information, or to extract the number with preprocessing.
Fix:
Edit the item, set Type of information to Character, click Update.
The next value is stored and the item becomes supported.✅ Checkpoint: The item shows “web01” as its last value and is no longer Not supported.
3ZBX_NOTSUPPORTED: permission denied
The agent runs as the zabbix user, so it can only read what that user can read. Ask it for a root-only file:
Run this on zbx01 (with the PSK file from step 2):
eval zabbix_get -s 192.168.56.81 -k "'vfs.file.contents[/etc/shadow]'" $P
eval zabbix_get -s 192.168.56.81 -k "'vfs.file.contents[/etc/hostname]'" $PYou’ll get this error, then a value:
ZBX_NOTSUPPORTED: Cannot open file: [13] Permission denied
web01Error 13 is the Linux EACCES error. Don’t fix this by running the agent as root: give the zabbix user read access to exactly what it needs (group membership like adm for /var/log files, an ACL with setfacl, or a sudo rule for a specific script in Lesson 14). Also note vfs.file.contents is limited to 16 MB, and log files should be read with log[] items (Lesson 13), which only work as active checks; a passive log[] returns “Accessible only as active check.”
Fix:
Use a file the zabbix user may read, or grant read access to that one file:
sudo setfacl -m u:zabbix:r /path/to/file✅ Checkpoint: You can explain why the zabbix user gets “Permission denied” and how to grant access safely.
This happened at work
The exam results page that “was up”
I was helping an online education platform in Bengaluru on the morning their board exam results went live. Their Zabbix showed everything green: CPU fine, Nginx processes running, port 443 answering. Meanwhile the support team had hundreds of tickets saying the results page showed a blank screen.
The team’s first move was to restart Nginx on all six web servers, because “it’s a web problem”. The page stayed blank. Someone finally opened the page in a browser and saw a 200 response with a tiny body: the PHP backend was timing out and Nginx was serving an error template with the status code still set to 200.
All their items checked whether things were running, and none checked whether the page worked. We added an HTTP agent item that fetched the results page every 30 seconds, kept the body length and response time with preprocessing, and a trigger when the body was under 2 KB or the time was over 3 seconds. Within 20 minutes of adding it they saw the same failure on a second server that nobody had reported.
The rule we wrote in their runbook: for every service, have at least one item that does what a user does, from outside the host, and checks the answer, not only the status code.
Common mistakes and troubleshooting
| Mistake | What happens | What to do instead |
|---|---|---|
| Picking Numeric for a value that can be text | The item goes Not supported whenever the source returns an error message | Use Character or Text, or extract the number with preprocessing |
| Every item at 30s “to be safe” | The database grows fast and the server needs far more new values per second | Use 1m for most metrics and 1h or more for things that rarely change |
| Duplicating a template key on the host | “An item with key … already exists” | Reuse the template item, or add a parameter to make the key unique |
| Running the agent as root to fix permissions | Any compromise of the agent gives root access | Grant the zabbix user read access to the specific files only |
| Only checking from the agent | The host looks healthy while users can’t reach it | Add a simple check or HTTP agent item from the server side |
| Keeping long history for text items | Large text values fill the database | Short history (7d) for Text and Log items, and no trends (they have none) |
| Ignoring “Not supported” items | Real problems hide among dozens of red icons | Fix or disable them; review the count in System information |
Interview questions
Click a question to open it. Each one is written the way an interviewer would ask it. Under it you will see why they ask it and one way you could answer, in your own words.
Fresher level
1. What is the difference between a Zabbix agent item and a simple check?
Why they ask this: They want to see that you know who does the collecting.
How you might answer: A Zabbix agent item is collected by the agent on the host, so it shows how the host sees itself: CPU, processes, files. A simple check like net.tcp.service is run by the Zabbix server or proxy, so it shows whether the service is reachable over the network. I usually use both for important services.
2. What are history and trends in Zabbix?
Why they ask this: A basic storage question.
How you might answer: History keeps every collected value, by default for 31 days. Trends keep one row per hour per numeric item with the minimum, average and maximum, by default for 365 days, so long-term graphs stay fast and cheap. Text, log and character items have no trends.
2–5 years experience
3. An item shows “Value of type string is not suitable for value type Numeric (unsigned)”. How do you fix it?
Why they ask this: They check you understand value types and preprocessing.
How you might answer: The collector returned text where the item expects an unsigned number, often an error message from an HTTP endpoint or a script. If the value really is text I change the type of information to Character or Text; if I want a number I add preprocessing to extract it, for example a regular expression or JSONPath step, plus a “Check for not supported value” step to handle errors cleanly.
4. How do you decide update intervals for a new template with 200 items?
Why they ask this: They want to hear about cost and usefulness, not “every 30 seconds”.
How you might answer: I match the interval to how fast the thing changes and how fast someone would act on it: 1m for CPU, memory and service checks, 5m or 15m for disk space, 1h or 1d for inventory items like OS version. I use flexible intervals where business hours matter, and I check the new values per second in System information before and after rolling it out.
Senior level
5. Your Zabbix server’s required performance jumped from 800 to 3,000 new values per second after a template change. How do you investigate and fix it?
Why they ask this: They test capacity thinking and knowledge of where to look.
How you might answer: I’d compare the template versions to find which items changed interval or which discovery rules now create many more items, and check the Zabbix server health dashboard for history syncer and preprocessing load. Usually it’s an LLD rule discovering far more entities than expected or someone setting 10s intervals.
The fix is to filter discovery, raise intervals for slow-changing values, use dependent items so one request feeds many values, and discard unchanged values with heartbeat in preprocessing.
6. When would you choose a dependent item over several separate agent items?
Why they ask this: They want to see you design for efficiency.
How you might answer: When one request already returns everything I need, like a JSON status page or a command that prints many counters. A master item fetches it once, and dependent items extract each value with preprocessing, so the agent or endpoint is hit once per interval instead of ten times and all values share the same timestamp.
Quick quiz
Q1. Which item type is collected by the Zabbix server itself, not by the agent?
- Zabbix agent (active)
- Simple check
- Zabbix trapper
- Dependent item
Show answer
B — Simple checks such as net.tcp.service run on the server or proxy.
Q2. What does the empty parameter in net.tcp.service[http,,80] mean?
- It is an error
- Use the default value for that parameter
- Check all IPs
- Disable the check
Show answer
B — An empty parameter means the default, here the default IP (127.0.0.1 from the agent, or the interface IP for a simple check).
Q3. Which value types have trends?
- All of them
- Only Text and Log
- Numeric (float) and Numeric (unsigned)
- Only JSON
Show answer
C — Trends store hourly min, average and max, which only make sense for numbers.
Q4. An item returns “ZBX_NOTSUPPORTED: Cannot open file: [13] Permission denied”. What is wrong?
- The file does not exist
- The zabbix user cannot read the file
- The key is wrong
- The agent is passive
Show answer
B — Error 13 means the agent’s user lacks read permission.
Q5. What does an update interval of 0 with scheduling h9m0 do?
- Collects every 9 minutes
- Collects only at 09:00
- Disables the item
- Collects every hour
Show answer
B — Delay 0 means collect only on the custom schedule, here 09:00 every day.
Quick recap
- An item is type + key + value type + interval, with history and trends deciding how long its values live.
- Agent items show the host’s view; simple checks and HTTP agent items show the network and user view.
- Test keys with zabbix_get or the item Test button before saving, and read the “Not supported” reason when one fails.
- Value type mismatches, unknown keys and permission errors are the three classic item failures.
- web01 now has items for Nginx processes, the home page, port 80 reachability and memory used.
Next lesson
Lesson 8: Zabbix triggers and problem expressions → You turn these items into problems with trigger expressions, severities, recovery rules, dependencies and tags.
Further reading: Zabbix items
Want to go deeper into Zabbix items? The Zabbix manual covers creating an item, all Zabbix agent item keys, custom intervals and history and trends. For the Linux side of what these keys read, see Linux performance monitoring, and compare with how Prometheus names metrics in Prometheus Node Exporter.
You can also see the full plan for this course on the Zabbix Monitoring course page.
