Log monitoring: Nginx access logs and Windows event logs
-
Phase 1: Zabbix server and agents
-
Phase 2: Items, triggers, templates and dashboards
-
Phase 3: Alerts, proxies, SNMP and automation
Zabbix log monitoring lets the agent read a log file line by line, pick out only the lines that match a pattern, and send those lines (or counts of them) to the server, where triggers turn them into problems. Metrics tell you the error rate went up; the log line tells you it was POST /api/pay returning 504 from one upstream.
In this lesson you watch web01’s Nginx access log for 5xx errors and 404 bursts, first with log[], then with logrt[] and the count keys, and you give the agent permission to read the file the right way. If you built win01 you also catch failed Windows logons (event ID 4625) with eventlog[]. All the agent outputs in this lesson were captured from a real agent 2 reading real files.
Where this lesson fits
Lesson 13 of 24 in Zabbix Monitoring · Phase 2: Items, triggers, templates and dashboards · Before this: Lesson 12, web monitoring · Next: Lesson 14, custom checks
| Time | You need | By the end you can |
|---|---|---|
| About 80 minutes | zbx01 and web01 from Lessons 1 to 12 with agent 2 in active mode, Nginx logs on web01; win01 optional | Build log, logrt and count items with sensible triggers, read Windows security events, and fix permission, passive-mode and log-rotation problems |
What it is, in one line
Zabbix log monitoring uses active-only agent items (log, logrt, log.count, logrt.count and eventlog on Windows) that read new lines from a file or event log, filter them by regular expression, and send matches to the server.
In Simple Words
The watchman with the visitor register
Every housing society has a visitor register at the gate, and hundreds of names go into it each day. The secretary doesn’t read the whole book; she asks the watchman to call her only when a name from the “do not allow” list appears, and to tell her at the end of the day how many delivery boys came.
The watchman remembers which page and line he read last, so he never reports the same entry twice. When the register is full and a new one starts, a good watchman finishes the last few lines of the old book before opening the new one.
The agent is that watchman: it remembers its position in the file, sends only matching lines or a count, and logrt is the version that handles a new register properly.
Engineer's View
How log items work inside the agent
Log items are active only: the agent gets the item from the server’s active check list, opens the file itself, reads from its last position (the lastlogsize, a byte offset), filters lines with a regular expression, and pushes results to the server. Each item remembers its position on the server too, so after an agent restart it continues where it stopped. In passive mode or with zabbix_agent2 -t these keys refuse to run.
| Key | What it sends | Use for |
|---|---|---|
| log[file,regexp,encoding,maxlines,mode,output,…] | Each matching line (or the output template, like \1) | Error lines you want to read in the problem |
| logrt[file_regexp,regexp,…] | Same, but follows rotated files whose names match file_regexp | Logs rotated by logrotate (most Linux logs) |
| log.count[…] and logrt.count[…] | How many lines matched since the last check | Rates: 5xx per minute, 404 bursts |
| eventlog[name,regexp,severity,source,eventid,…] | Matching Windows events | Failed logons (4625), service crashes |
| eventlog.count[…] | How many events matched | Brute-force detection on Windows |
The item’s Type of information must be Log for log, logrt and eventlog, and numeric for the count keys. The mode parameter skip makes a new item start at the end of the file instead of sending the whole history on day one. Agent 2 sends at most 20 new lines per second per item by default (Plugins.Log.MaxLinesPerSecond, or the maxlines key parameter), so a log storm can’t flood the server.
These keys behave the same in 7.0 LTS.
How it works, step by step
1The agent asks the server what to watch
Every RefreshActiveChecks seconds (5 by default) agent 2 fetches its active check list, which includes each log item’s key and last known position. It opens the file as the zabbix user, seeks to that byte offset and reads only what was added since.
2Lines are filtered on the agent
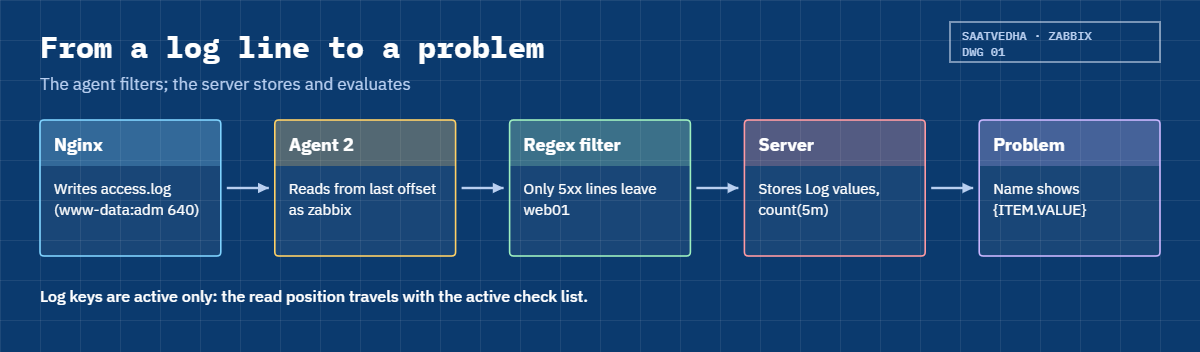
Only lines matching the item’s regular expression leave the machine, so a 2 GB access log costs you a few kilobytes of network traffic. The output parameter can cut the line down, for example \1 sends only the first capture group, such as the status code. The diagram below follows one line from Nginx to a problem.
3The server stores lines as log values
On the server each matching line becomes a value of type Log, with its own timestamp, and is stored in the log history table. Triggers can then use find(), count() or nodata() on those values, and the newest line is available as {ITEM.VALUE} in the problem name.
4Rotation: why logrt exists
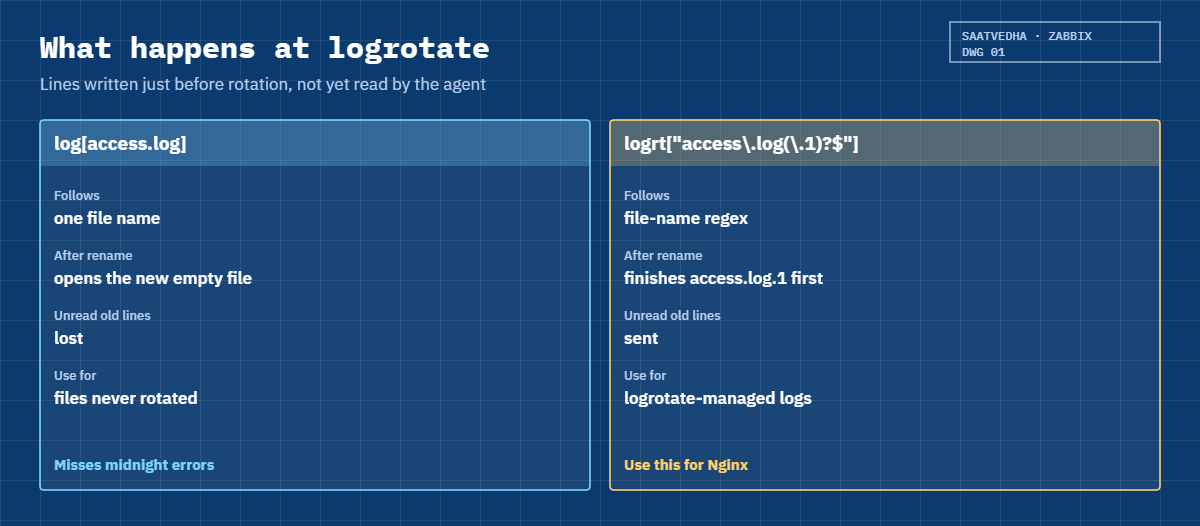
Ubuntu’s logrotate renames access.log to access.log.1 every night and creates a new empty access.log. log[] follows one file name, so lines written to the old file just before rotation, and not yet read, are never sent. logrt[] watches every file matching a regular expression, finishes the old one first and then moves on, as the second diagram shows.
5Choosing the right key
| Situation | Key | Why |
|---|---|---|
| Rotated application or web logs | logrt or logrt.count | Doesn’t lose lines at rotation |
| A file that is never rotated, or truncated in place | log or log.count | Simpler, one exact file |
| You need the line text in the alert | log / logrt with a Log item | The problem shows the line |
| You need a rate or a threshold | log.count / logrt.count | A number you can graph and compare |
| Windows security or system events | eventlog / eventlog.count | Reads the event log, not a file |
Count keys return a number per check, so logrt.count every minute gives “5xx lines per minute” without storing every line, which is lighter on the database than storing all the text.
Hands-on lab: watch Nginx 5xx and 404 lines with log and logrt items
Before you run any command, double-check it
Read every command twice before you press Enter. Check the target: the server name, the user, the disk or device name, the path and the sizes. These commands are for learning and were tested in our lab, not on your system. At work, run the read-only commands first, follow your change process, make sure a backup exists, and ask a second person to check anything that changes or deletes data. You run them at your own risk.
Commands run on web01 unless stated, and items are created in the frontend at https://zbx01.lab on host web01. The agent must have active checks working (ServerActive pointing at zbx01, Lesson 4).
1Look at the Nginx log and its permissions
Run this on web01:
ls -l /var/log/nginx/
id zabbix
sudo -u zabbix head -1 /var/log/nginx/access.logYou should see this (your sizes, dates and user IDs will differ):
total 8
-rw-r----- 1 www-data adm 1595 Nov 8 10:12 access.log
-rw-r----- 1 www-data adm 1086 Nov 8 09:59 error.log
uid=113(zabbix) gid=113(zabbix) groups=113(zabbix)
head: cannot open '/var/log/nginx/access.log' for reading: Permission deniedNginx logs belong to www-data with group adm and mode 640, and the zabbix user isn’t in adm. Any log item on this file would fail right now, and you’ll see the exact Zabbix error in the Break It section.
✅ Checkpoint: You can see the log is www-data:adm 640 and the zabbix user cannot read it yet.
2Give the zabbix user read access the right way
Run this on web01:
sudo usermod -aG adm zabbix
sudo systemctl restart zabbix-agent2
sudo -u zabbix head -1 /var/log/nginx/access.logYou should see one line in the combined log format (your client IP, time and URL will differ):
192.168.56.80 - - [08/Nov/2026:10:01:14 +0530] "GET / HTTP/1.1" 200 615 "-" "curl/8.18.0"adm is Ubuntu’s standard group for reading logs, and logrotate keeps creating new files with group adm (create 0640 www-data adm in /etc/logrotate.d/nginx), so this survives rotation. The restart matters: a running process keeps the groups it started with.
✅ Checkpoint: sudo -u zabbix can read the first line of the access log.
3Create a log[] item for server errors
On web01 in the frontend, Items > Create item:
| Field | Value |
|---|---|
| Name | Nginx: 5xx lines |
| Type | Zabbix agent (active) |
| Key | log[/var/log/nginx/access.log,” 5[0-9]{2} “,,,skip] |
| Type of information | Log |
| Update interval | 1m |
| History | 7d |
| Tags | component = nginx, component = log |
The pattern has spaces on both sides so it matches the status field (" 502 166) and not, say, a byte count containing 500. skip means the item starts at the end of the file, so you don’t import yesterday’s errors.
✅ Checkpoint: The item exists and, after a minute, shows no error icon.
4Generate errors and read them
Create a location that always fails and hit it, plus a few missing pages:
Run this on web01:
echo 'location = /broken { return 502; }' | sudo tee /etc/nginx/snippets/broken.conf >/dev/null
sudo sed -i 's|^\tserver_name _;|&\n\tinclude /etc/nginx/snippets/broken.conf;|' /etc/nginx/sites-available/default
sudo nginx -t && sudo systemctl reload nginx
for i in 1 2 3; do curl -s -o /dev/null http://127.0.0.1/broken; done
for i in 1 2 3 4 5; do curl -s -o /dev/null http://127.0.0.1/missing-$i.png; done
tail -3 /var/log/nginx/access.logYou should see:
nginx: the configuration file /etc/nginx/nginx.conf syntax is ok
nginx: configuration file /etc/nginx/nginx.conf test is successful
127.0.0.1 - - [08/Nov/2026:10:21:12 +0530] "GET /missing-3.png HTTP/1.1" 404 162 "-" "curl/8.18.0"
127.0.0.1 - - [08/Nov/2026:10:21:12 +0530] "GET /missing-4.png HTTP/1.1" 404 162 "-" "curl/8.18.0"
127.0.0.1 - - [08/Nov/2026:10:21:12 +0530] "GET /missing-5.png HTTP/1.1" 404 162 "-" "curl/8.18.0"The sed line adds an include right after server_name _; in Ubuntu’s default site, so the /broken location lives inside that server block. Within a minute, open Monitoring > Latest data, find “Nginx: 5xx lines” and click History.
History lists the three lines, newest first. Local time stays empty because the item has no log time format:
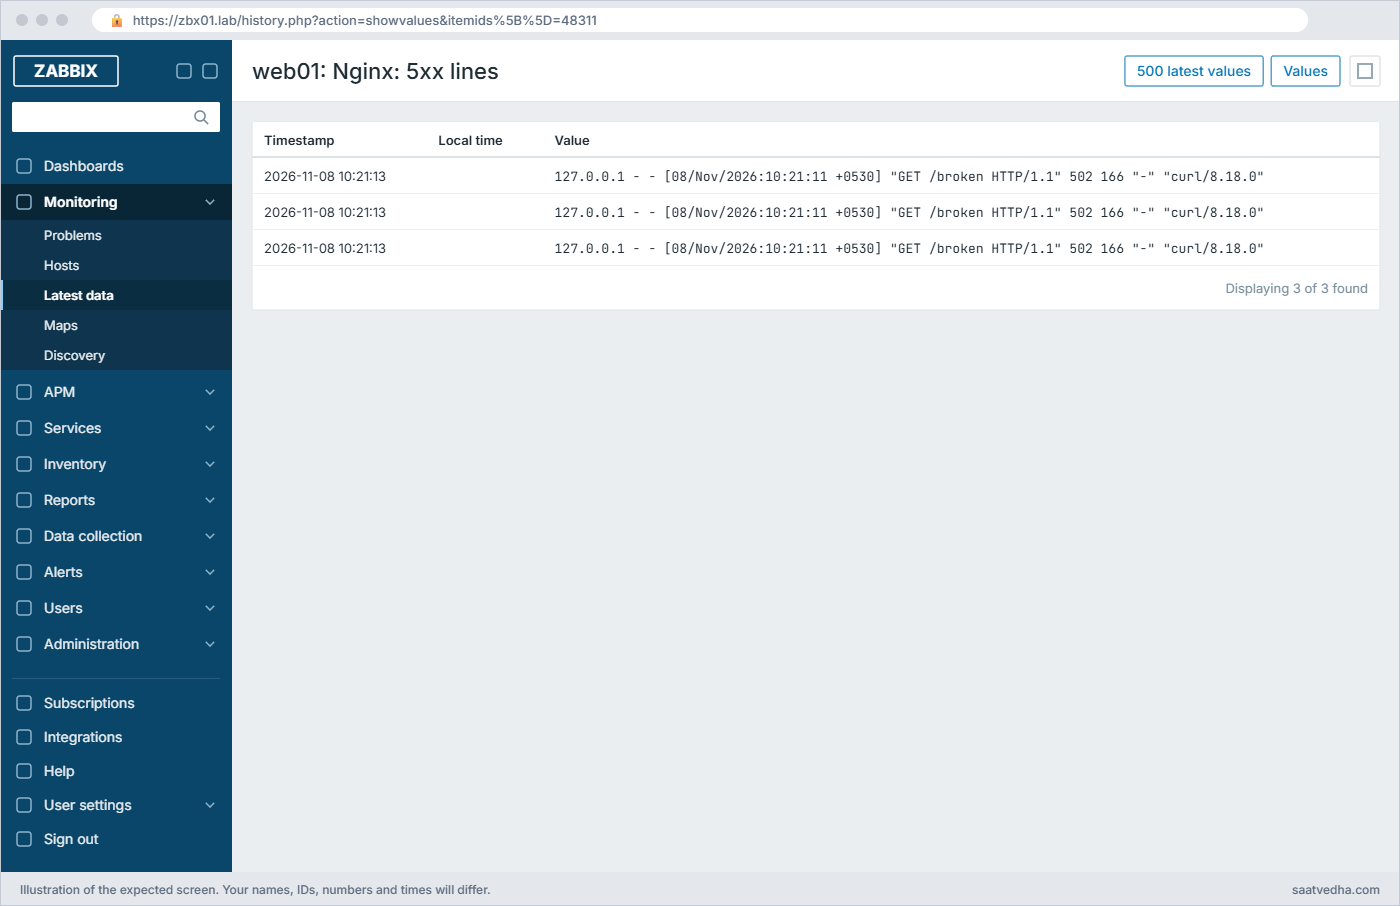
Three 502 lines and none of the 404s, because only lines matching the pattern leave web01. When I ran the same item against a test log, the agent sent only the 502 and 504 lines and skipped the 404 and 200 lines in between.
✅ Checkpoint: History of Nginx: 5xx lines shows the three /broken lines with status 502.
5Count 404s with logrt.count
Create a second item, numeric this time:
| Field | Value |
|---|---|
| Name | Nginx: 404 per minute |
| Type | Zabbix agent (active) |
| Key | logrt.count[“/var/log/nginx/access\.log(\.1)?$”,” 404 “,,,skip] |
| Type of information | Numeric (unsigned) |
| Update interval | 1m |
The first parameter is now a regular expression for the file name, not a path pattern: it matches access.log and access.log.1 (the rotated copy before compression), and the dot is escaped. Run the 404 loop from step 4 again and look at Latest data.
In Latest data, the Last value column shows:
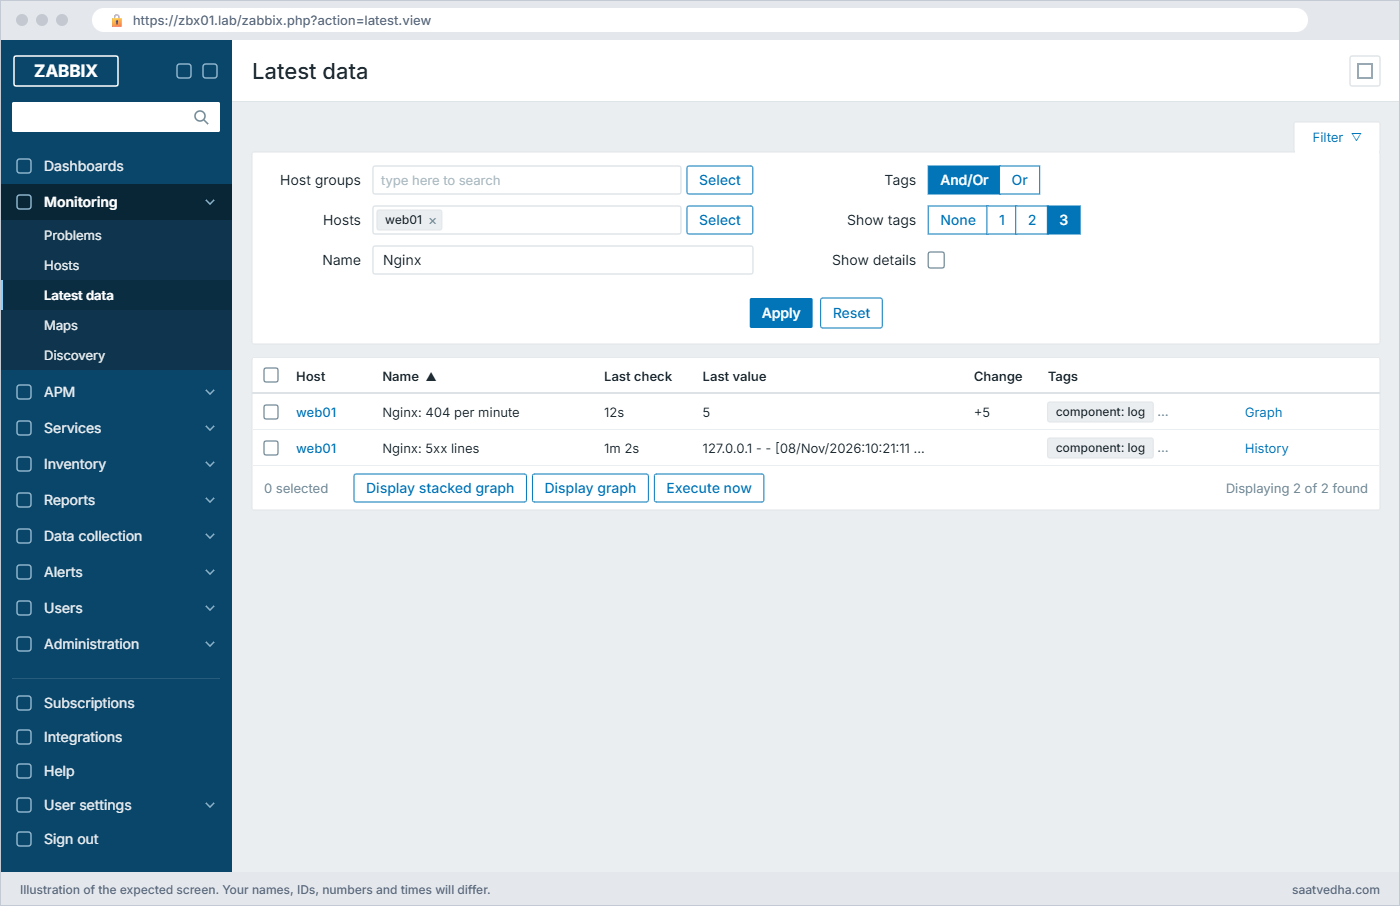
Each check sends the number of matching lines since the previous check; a minute with no 404s sends 0. That’s a number you can graph and put a threshold on.
✅ Checkpoint: Nginx: 404 per minute shows 5 after the loop and 0 a minute later.
6Turn log values into problems
Add two triggers on web01:
| Name | Expression | Severity | Notes |
|---|---|---|---|
| Nginx 5xx on {HOST.NAME}: {ITEM.VALUE} | count(/web01/log[/var/log/nginx/access.log,” 5[0-9]{2} “,,,skip],5m)>=1 | Average | Recovers by itself when 5 minutes pass with no 5xx line |
| Burst of 404s on {HOST.NAME} | last(/web01/logrt.count[“/var/log/nginx/access\.log(\.1)?$”,” 404 “,,,skip])>50 | Warning | More than 50 per minute; tune to your traffic |
Using count(...,5m) instead of last() matters for log items: a log item has no value when nothing matches, so a trigger on last() would stay in problem forever after one bad line. With a time window, the problem clears once the window has no lines.
✅ Checkpoint: Running the /broken loop opens “Nginx 5xx on web01” with the log line in its name, and it closes about 5 minutes later.
7Optional: failed Windows logons on win01
If you built win01 in Lesson 5, create this on host win01 (the agent there must run as Local System, which can read the Security log). If you skipped win01, read along and look at the output below.
| Field | Value |
|---|---|
| Name | Windows: failed logons |
| Type | Zabbix agent (active) |
| Key | eventlog[Security,,,,^4625$,,skip] |
| Type of information | Log |
| Update interval | 1m |
Then on win01 try a wrong password a few times (for example runas /user:win01\nosuch cmd in a command prompt and type anything).
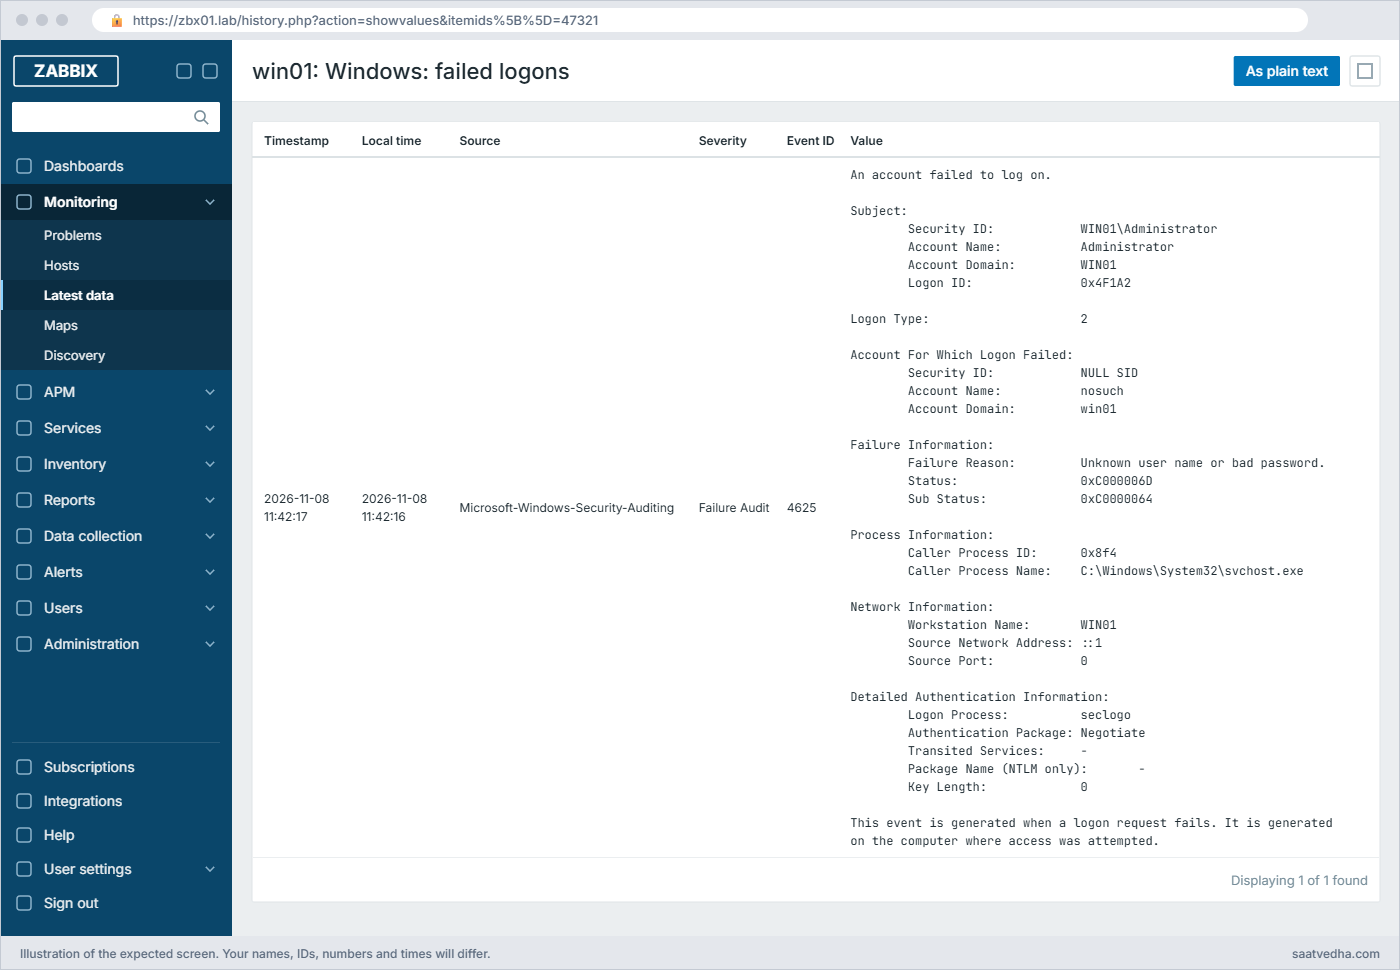
In Monitoring > Latest data, click History for “Windows: failed logons”. Each failed logon is one row: Source Microsoft-Windows-Security-Auditing, Severity Failure Audit, Event ID 4625, and the whole event text as the value.
For the runas attempt the value starts like this (your Logon ID and Caller Process ID will differ):
An account failed to log on.
Subject:
Security ID: WIN01\Administrator
Account Name: Administrator
Account Domain: WIN01
Logon ID: 0x4F1A2
Logon Type: 2
Account For Which Logon Failed:
Security ID: NULL SID
Account Name: nosuch
Account Domain: win01
Failure Information:
Failure Reason: Unknown user name or bad password.
Status: 0xC000006D
Sub Status: 0xC0000064
Process Information:
Caller Process ID: 0x8f4
Caller Process Name: C:\Windows\System32\svchost.exe
Network Information:
Workstation Name: WIN01
Source Network Address: ::1
Source Port: 0
Detailed Authentication Information:
Logon Process: seclogo
Authentication Package: Negotiate
Transited Services: -
Package Name (NTLM only): -
Key Length: 0
This event is generated when a logon request fails. It is generated on the computer where access was attempted.Windows adds a few paragraphs after that last line explaining each field, and Zabbix keeps them in the value too. Logon Type 2 is an interactive logon. Status 0xC000006D means a bad user name or password, and Sub Status 0xC0000064 says the account name itself is wrong. Password guessing over the network shows Logon Type 3 instead, with the attacker’s IP address in Source Network Address.
A trigger like count(/win01/eventlog[Security,,,,^4625$,,skip],5m)>=5 catches password guessing. The Security log needs the “Audit logon events” policy on failure, which is on by default for Windows Server.
✅ Checkpoint: On win01, failed logons appear as event 4625 lines (or you have read through the output if you skipped win01).
Break It, Then Fix It
Three classic failures, each with the real message the agent produced in my test.
1“Cannot open file … Permission denied”
Run this on web01 to undo the permission fix:
sudo gpasswd -d zabbix adm
sudo systemctl restart zabbix-agent2You’ll get this error on the log items (hover the red i):
Cannot open file "/var/log/nginx/access.log": [13] Permission deniedThat’s the exact text agent 2 sent when I pointed it at a 600 file it couldn’t read. The item goes Not supported, and nothing is lost: the position is kept, so once access is back the agent continues from where it stopped.
Fix:
sudo usermod -aG adm zabbix
sudo systemctl restart zabbix-agent2Don’t fix this with chmod 644 on the log (logrotate recreates it as 640 tonight) or by running the agent as root (a compromised agent would then own the box). For a log that isn’t in adm, use setfacl -m u:zabbix:r and a default ACL on the directory.
✅ Checkpoint: Both log items are supported again within a minute or two.
2Log item created as passive “Zabbix agent”
Clone “Nginx: 5xx lines”, change the Type to Zabbix agent (passive) and save. Or test the key by hand:
Run this on web01 (and on zbx01):
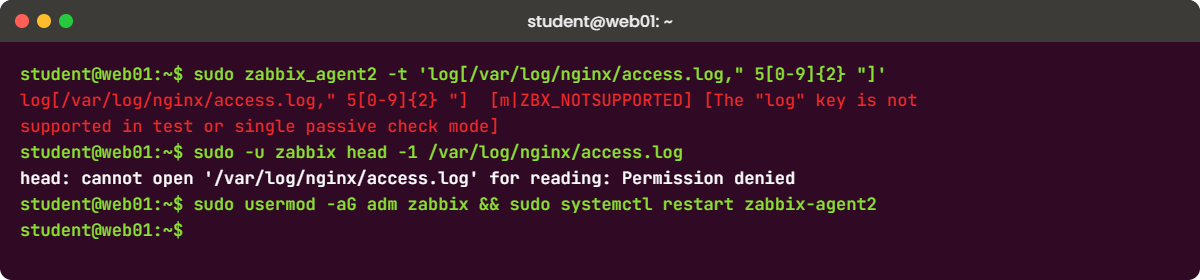
sudo zabbix_agent2 -t 'log[/var/log/nginx/access.log," 5[0-9]{2} "]'
zabbix_get -s 192.168.56.81 --tls-connect psk --tls-psk-identity "PSK web01" --tls-psk-file /tmp/web01.psk -k 'log[/var/log/nginx/access.log]' # on zbx01You’ll get this error:
log[/var/log/nginx/access.log," 5[0-9]{2} "] [m|ZBX_NOTSUPPORTED] [The "log" key is not supported in test or single passive check mode]
ZBX_NOTSUPPORTED: The "log" key is not supported in test or single passive check modeBoth lines are real agent 2 output. A log item needs memory between checks (the last position), and only the active check list carries that, so log, logrt, the count keys and eventlog work only as Zabbix agent (active). The cloned passive item shows the same message in the frontend.
Fix:
Delete the clone, or set its Type back to Zabbix agent (active). If the host has no active checks at all (ServerActive empty), add ServerActive=192.168.56.80 on the agent first, as in Lesson 4.
✅ Checkpoint: Only the active version of the item remains, and it is supported.
3logrotate makes log[] miss lines that logrt[] catches
This is the quiet one: nothing turns red, you lose alerts. Write two errors, rotate immediately, then write a normal line:
Run this on web01:
curl -s -o /dev/null http://127.0.0.1/broken; curl -s -o /dev/null http://127.0.0.1/broken
sudo logrotate -f /etc/logrotate.d/nginx
curl -s -o /dev/null http://127.0.0.1/
ls -l /var/log/nginx/access.log*You’ll get this:
-rw-r----- 1 www-data adm 90 Nov 8 10:34 /var/log/nginx/access.log
-rw-r----- 1 www-data adm 378 Nov 8 10:34 /var/log/nginx/access.log.1
-rw-r----- 1 www-data adm 217 Nov 8 10:20 /var/log/nginx/access.log.2.gzNow compare a log[] item and a logrt[] item with the same pattern (create a second item, key logrt["/var/log/nginx/access\.log(\.1)?$"," (5[0-9]{2}) ",,,skip,\1], Type of information Log). In my test the logrt item sent both 500 and 502 lines from access.log.1, and the log item sent nothing at all for them, because by its next check the lines were in a file it doesn’t watch.
Fix:
Use logrt or logrt.count for any file that logrotate handles, with a file regex that matches the live file and the first rotated copy (rotated copies that are already gzipped can’t be read). Move the 5xx item and trigger from Step 3 to logrt, and keep log[] only for files that are never renamed.
✅ Checkpoint: Your 5xx item uses logrt, and errors written just before a rotation still show up in its history.
This happened at work
The payment errors nobody saw at midnight
The on-call engineer at an online travel agency in Gurugram described this one to me. Every night around midnight, during the fare-sync batch, a small number of payment calls returned 504, and customers who tried to book in those minutes saw a generic error page. The business noticed it only through complaints on social media.
Zabbix had a log[] item on the Nginx access log with a 5xx trigger, and it worked fine all day. They first suspected the trigger expression, then the regular expression, and both tested clean. The trick was the timing: logrotate ran at 00:00, the batch errors came in the last seconds before it, and the agent checked the file once a minute.
The lines landed in access.log, the file was renamed to access.log.1 a few seconds later, and the next check opened a brand-new empty file. Switching the item to logrt["/var/log/nginx/access\.log(\.1)?$",...] made the midnight 504s appear the very next night, and the team moved logrotate to a quieter hour as well, after fixing the batch.
Common mistakes and troubleshooting
| Mistake | What happens | What to do instead |
|---|---|---|
| Creating log items as passive Zabbix agent | The key is not supported in test or single passive check mode | Always use Zabbix agent (active) for log, logrt, count and eventlog keys |
| chmod 644 on the log file | Works until tonight’s rotation recreates it as 640 | Add zabbix to adm, or use ACLs, then restart the agent |
| Using log[] on rotated files | Lines written just before rotation are lost | Use logrt or logrt.count with a file-name regex |
| Trigger with last() on a log item | The problem never closes, because no new value arrives when all is well | Use count(…,5m) or nodata() with a time window |
| Leaving mode empty on a big old file | The first check sends thousands of old lines | Use skip so the item starts at the end of the file |
| Storing every access-log line | Huge history table and a slow frontend | Match only errors, or use the count keys |
| Writing a loose pattern like 5.. | Byte counts and URLs match too | Anchor it, for example ” 5[0-9]{2} ” around the status field |
Interview questions
Click a question to open it. Each one is written the way an interviewer would ask it. Under it you will see why they ask it and one way you could answer, in your own words.
Fresher level
1. Why must Zabbix log items be active checks?
Why they ask this: Basic understanding of how log monitoring keeps state.
How you might answer: A log item has to remember where it stopped reading, the byte offset, and only reads new lines. The active check list from the server carries that position for each item, so the agent can continue after a restart without re-sending old lines.
A passive or test request has no such memory, so agent 2 refuses with “not supported in test or single passive check mode”.
2. A log item shows “Permission denied”. How do you fix it properly?
Why they ask this: They want the right fix, not chmod 777 or root.
How you might answer: On Ubuntu the web logs are owned by www-data with group adm and mode 640, so I add the zabbix user to adm with usermod and restart the agent so it picks up the new group. Logrotate keeps creating files with group adm, so the fix survives rotation.
I don’t chmod the file or run the agent as root. For logs in other groups I use ACLs, including a default ACL on the directory.
2–5 years experience
3. What is the difference between log[] and logrt[], and which would you use for Nginx?
Why they ask this: Checks rotation knowledge.
How you might answer: log[] follows one file name; logrt[] takes a regular expression for file names and follows rotation, reading the end of the renamed file before moving to the new one. For Nginx on Ubuntu, which rotates daily, I use logrt with a pattern like access\.log(\.1)?$.
With log[], lines written just before rotation and not yet read are lost, and midnight batch jobs often fail in those last seconds.
4. How would you alert on more than 50 HTTP 5xx errors per minute from access logs?
Why they ask this: They want a count-based design, not storing every line.
How you might answer: I’d create a logrt.count item matching the status field, such as ” 5[0-9]{2} “, every minute, which gives a number per minute. The trigger is last() of that item greater than 50, or avg over 5 minutes if I want to avoid spikes.
I’d keep a separate logrt item for 5xx lines with a short history so on-call can see example lines in the problem.
Senior level
5. A developer wants every application log line in Zabbix for searching. What do you say?
Why they ask this: Judgement about the right tool and database load.
How you might answer: Zabbix is good for watching logs for known patterns and counts and turning them into problems, but it’s not a log search platform. Storing every line puts big text rows in the history tables and slows the frontend.
I’d send full logs to a log system like Loki, Elasticsearch or OpenSearch, and keep Zabbix items for error patterns, counts and Windows events that should page someone.
6. Log alerts arrive minutes late during a traffic spike. Where would you look?
Why they ask this: Performance understanding of the log path.
How you might answer: First the agent side: agent 2 sends at most 20 lines per second per log item by default, set by Plugins.Log.MaxLinesPerSecond or the maxlines parameter, so a burst of matching lines queues up. Then the buffer and send settings, and on the server the history syncer and trapper load.
The fix is usually to match fewer lines, switch to count keys for rates, raise maxlines carefully for that item, and check the server’s internal process busy items.
Quick quiz
Q1. Which item type must a log[] item use?
- Zabbix agent
- Zabbix agent (active)
- Zabbix trapper
- HTTP agent
Show answer
B — Log items are active only; the agent keeps the read position from the active check list.
Q2. On Ubuntu, which group lets the zabbix user read /var/log/nginx/access.log?
- www-data
- syslog
- adm
- root
Show answer
C — Nginx logs are created as www-data:adm with mode 640.
Q3. Why use logrt[] instead of log[] for Nginx access logs?
- It reads compressed .gz files
- It follows rotated files so lines written before rotation are not lost
- It runs in passive mode
- It is faster on Windows
Show answer
B — logrt watches a file-name regex and finishes the old file after rotation.
Q4. What does the mode parameter skip do?
- Skips lines that do not match
- Starts reading at the end of the file for a new item
- Skips rotated files
- Skips the first line
Show answer
B — skip avoids sending the existing content of the file when the item is created.
Q5. Which trigger closes on its own after errors stop?
- last(/web01/log[…])<>“”
- count(/web01/log[…],5m)>=1
- change(/web01/log[…])=1
- min(/web01/log[…],5m)>0
Show answer
B — count over a time window returns 0 once no new lines arrive in that window.
Quick recap
- log, logrt, the count keys and eventlog are active-only items that read new lines from the last saved position.
- The zabbix user needs read access; on Ubuntu add it to adm and restart the agent.
- Use logrt and logrt.count for rotated files, with a file-name regex and the skip mode.
- Match narrowly, prefer count keys for rates, and use count(…,5m) in triggers so problems close.
- On Windows, eventlog[Security,,,,^4625$,,skip] catches failed logons.
Next lesson
Lesson 14: Custom checks: UserParameter, system.run, zabbix_get and zabbix_sender → You teach the agent new keys with UserParameter, test them with zabbix_get, and push values from backup scripts with zabbix_sender.
Further reading: Zabbix log monitoring
Want to go deeper into Zabbix log monitoring? The official Log file monitoring page explains every parameter of log and logrt, and the agent item keys page covers eventlog. The logrotate man page explains create, delaycompress and the other rotation options.
For the Linux side of logs and permissions, see Linux administration, and for the next step in custom data, Zabbix UserParameter. You can also see the full plan for this course on the Zabbix Monitoring course page.
