Install Zabbix agent 2 on Linux: passive and active checks
-
Phase 1: Zabbix server and agents
-
Phase 2: Items, triggers, templates and dashboards
-
Phase 3: Alerts, proxies, SNMP and automation
This lesson connects your first real host. You’ll install Zabbix agent 2 on Linux (web01), set it up for both passive and active checks, create the host in the frontend, link the official Linux template and watch CPU, memory and disk values arrive in Latest data. You’ll also test the agent from the server with zabbix_get, which is the quickest way to prove where a problem is.
Most “Zabbix isn’t collecting” tickets at work come down to three settings in one file (Server, ServerActive, Hostname) and one firewall rule. By the end of the Break It section you’ll recognise each of those failures from its exact error text.
Where this lesson fits
Lesson 4 of 24 in Zabbix Monitoring · Phase 1: Zabbix server and agents · Before this: Lesson 3, Zabbix frontend HTTPS · Next: Lesson 5, Zabbix agent on Windows
| Time | You need | By the end you can |
|---|---|---|
| About 80 minutes | zbx01 with HTTPS from Lesson 3 (snapshot https) and web01 from Lesson 1 | Install and configure agent 2, add a Linux host with a template, and fix passive and active connection errors |
What it is, in one line
Zabbix agent 2 is a small Go service on the monitored host that answers the server’s questions on port 10050 (passive) and also fetches its own list of items from the server on port 10051 and sends the values back (active).
In Simple Words
The milk survey in your colony
Your colony office wants daily figures from every house. One way is for the office boy to knock on each door and ask “how many litres today?” and note the answer (passive). The house must open the door, and the guard at the house gate must recognise the office boy, or he’s turned away.
The other way is for each house to collect the office’s question list once a day, write the answers in a diary and drop the diary at the office counter every evening (active). Now the office never needs to enter the house, but the diary must have the right house number on the cover, or the clerk says “no such house” and throws it back.
Engineer's View
Agent vs agent 2, and the three settings that matter
| Zabbix agent (classic) | Zabbix agent 2 | |
|---|---|---|
| Language | C | Go, with a plugin system |
| Package / service | zabbix-agent | zabbix-agent2 |
| Config file | /etc/zabbix/zabbix_agentd.conf | /etc/zabbix/zabbix_agent2.conf (+ zabbix_agent2.d/*.conf and plugins.d/*.conf) |
| Concurrency | Pre-forked processes (StartAgents) | Goroutines; checks run in parallel, per-plugin limits |
| Extra monitoring | UserParameter scripts, loadable C modules | Built-in plugins for Docker, MySQL, Redis, SMART, systemd, MQTT and more; loadable plugins for PostgreSQL, MongoDB, MSSQL |
| Persistent buffer | No | Yes (EnablePersistentBuffer) to keep active data across restarts |
| Item keys | Standard keys | Same standard keys, plus plugin keys |
Agent 2 is the default choice for new Linux hosts. Keep the classic agent where you have old C loadable modules or very small embedded systems. Only one of them should listen on 10050 on a host.
| Parameter | What it controls | web01 value |
|---|---|---|
| Server | Who may ask passive questions (IP, name or CIDR). Empty disables passive checks and the listener | 192.168.56.80 |
| ServerActive | Where to fetch the active item list and send values (host:port, default port 10051) | 192.168.56.80 |
| Hostname | The name the agent uses for active checks; must match the host name in the frontend exactly, including case | web01 |
| ListenPort | Port for passive checks | 10050 (default) |
| Timeout | Seconds for one check on the agent side | 3 (default) |
How it works, step by step
1Passive: the server asks, the agent answers
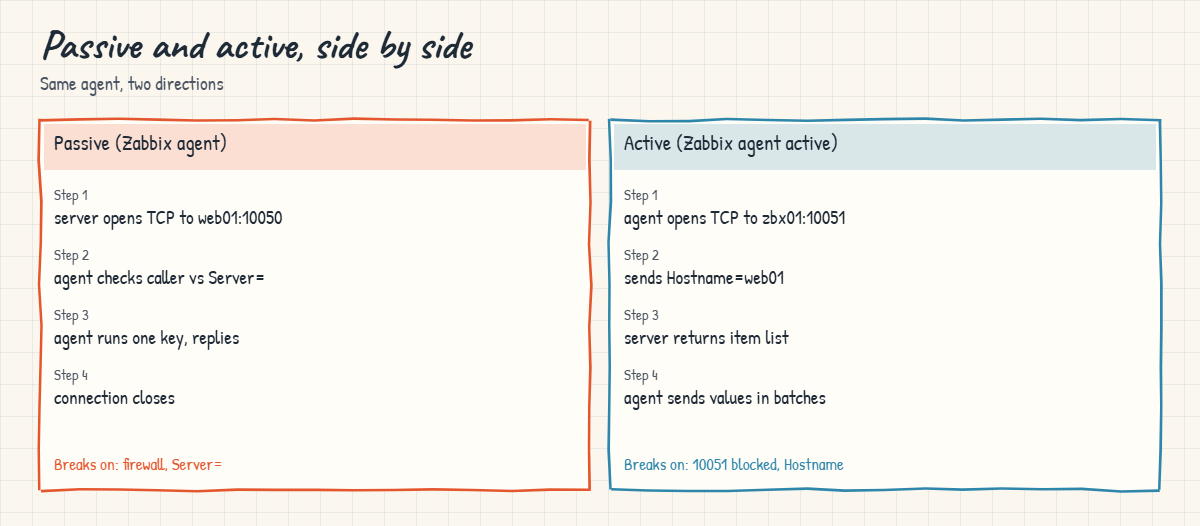
A poller process on the server opens a TCP connection to web01:10050 and sends one item key, for example system.cpu.load[all,avg1]. The agent checks that the caller’s IP is allowed by Server, runs the check and sends back the value, then the connection closes. Items of type “Zabbix agent” work this way, and the host’s interface (IP 192.168.56.81, port 10050) tells the server where to connect.
2Active: the agent asks for its list
Every few seconds agent 2 connects to ServerActive on 10051 and says “I am web01, what should I collect?”. The server looks up a host with that exact name and returns the items of type “Zabbix agent (active)” with their intervals. The agent collects them on its own schedule and sends the results in batches every second or so.
The sketch below shows both flows side by side.
3Which template to link
Zabbix ships two Linux templates: Linux by Zabbix agent (passive items) and Linux by Zabbix agent active (the same items as active). Pick one, never both. In this lab you link the passive template first so you can see the interface turn green, then switch web01 to active in step 9, which is how most teams run Linux at scale.
4How availability is shown
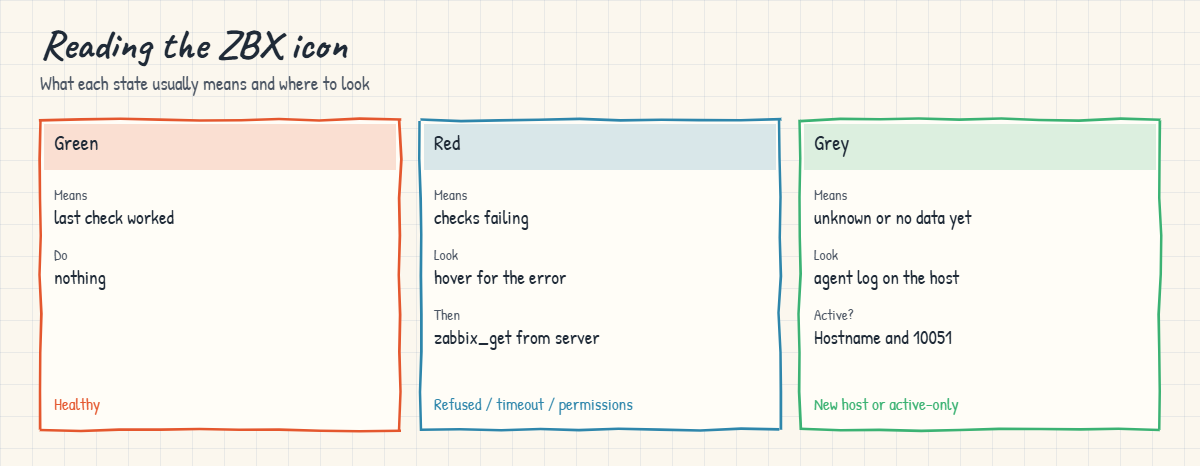
The ZBX icon next to the host in Data collection > Hosts shows the passive interface: green when the last check worked, red with an error tooltip when it failed, grey when unknown or not used. Active checks have their own status, shown when you hover over the icon. The sketch below shows what each colour means and which side to check first.
5zabbix_get: test without the frontend
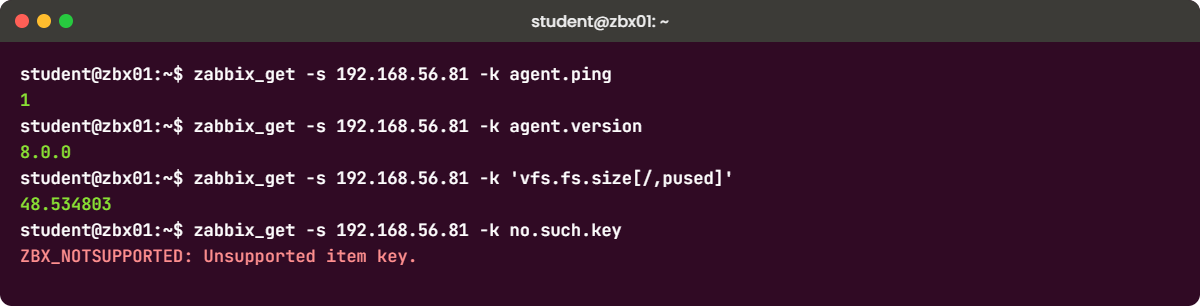
zabbix_get is a small command-line tool that does exactly what the server’s poller does for a passive check. Run from the server, it proves three things in one go: the network path, the agent’s Server setting, and whether the item key is supported.
$ zabbix_get -s 192.168.56.81 -k agent.version
8.0.0
$ zabbix_get -s 192.168.56.81 -k no.such.key
ZBX_NOTSUPPORTED: Unsupported item key.Since 7.0, zabbix_get speaks the JSON protocol to agents and falls back to plain text for 6.4 and older (--protocol auto by default). Its default timeout is 30 seconds, much longer than the server’s 3, so a slow check that works in zabbix_get can still time out in the frontend.
Hands-on lab: agent 2 on web01, passive then active
Before you run any command, double-check it
Read every command twice before you press Enter. Check the target: the server name, the user, the disk or device name, the path and the sizes. These commands are for learning and were tested in our lab, not on your system. At work, run the read-only commands first, follow your change process, make sure a backup exists, and ask a second person to check anything that changes or deletes data. You run them at your own risk.
You need both VMs running: zbx01 (192.168.56.80) and web01 (192.168.56.81). Each step says where to run the command. The frontend is at https://zbx01.lab, user Admin, password Zbx@Secure2026.
1Install agent 2 on web01
Run this on web01:
cd /tmp
wget https://repo.zabbix.com/zabbix/8.0/release/ubuntu/pool/main/z/zabbix-release/zabbix-release_latest_8.0+ubuntu26.04_all.deb
sudo dpkg -i zabbix-release_latest_8.0+ubuntu26.04_all.deb
sudo apt update
sudo apt install -y zabbix-agent2
zabbix_agent2 -V | head -1You should see:
zabbix_agent2 (Zabbix) 8.0.0Use the agent from the Zabbix repository, not Ubuntu’s own zabbix-agent2 package, so the agent version matches the server. An older agent works with a newer server, but you miss new item keys.
✅ Checkpoint: zabbix_agent2 -V reports version 8.0.0 on web01.
2Set Server, ServerActive and Hostname
Keep the shipped file as it is and put your settings in a small file in the include directory. It’s easier to read, survives package upgrades cleanly and is how config management tools usually do it. The later value wins when a parameter appears twice, so first comment out the three shipped lines.
Run this on web01:
sudo sed -i -E 's/^(Server|ServerActive|Hostname)=/# &/' /etc/zabbix/zabbix_agent2.conf
sudo tee /etc/zabbix/zabbix_agent2.d/10-lab.conf >/dev/null <<'EOF'
Server=192.168.56.80
ServerActive=192.168.56.80
Hostname=web01
EOF
sudo grep -E '^(Server|ServerActive|Hostname)=' /etc/zabbix/zabbix_agent2.conf /etc/zabbix/zabbix_agent2.d/10-lab.confYou should see only the lines from 10-lab.conf, because the shipped ones now start with #:
/etc/zabbix/zabbix_agent2.d/10-lab.conf:Server=192.168.56.80
/etc/zabbix/zabbix_agent2.d/10-lab.conf:ServerActive=192.168.56.80
/etc/zabbix/zabbix_agent2.d/10-lab.conf:Hostname=web01The shipped file had Server=127.0.0.1, ServerActive=127.0.0.1 and Hostname=Zabbix server, which is right only on the Zabbix server itself. The Include line reads every .conf file in zabbix_agent2.d, and plugin settings live one level down in plugins.d.
✅ Checkpoint: Only 10-lab.conf sets Server, ServerActive and Hostname, and the shipped lines are commented out.
3Test the config and start the agent
Run this on web01:
sudo zabbix_agent2 -T -c /etc/zabbix/zabbix_agent2.conf && echo CONFIG OK
sudo systemctl restart zabbix-agent2
sudo systemctl enable zabbix-agent2
sudo ss -ltnp | grep 10050
sudo grep -E 'Starting Zabbix Agent 2|hostname' /var/log/zabbix/zabbix_agent2.log | tail -2The test, ss and grep commands print this (your PID and times will differ):
Validating configuration file "/etc/zabbix/zabbix_agent2.conf"
Validation successful
CONFIG OK
LISTEN 0 4096 *:10050 *:* users:(("zabbix_agent2",pid=2291,fd=8))
2026/11/08 11:42:10.118342 Starting Zabbix Agent 2 (8.0.0)
2026/11/08 11:42:10.119015 Zabbix Agent2 hostname: [web01]-T validates the config without starting the service, so a typo shows up here and not as a silent restart loop. The log confirms the hostname the agent will use for active checks. Agent 2 log lines start with the date and time, unlike the server’s PID-first format.
✅ Checkpoint: zabbix-agent2 is running, listening on port 10050, and its log shows hostname [web01].
4Open port 10050 on web01 for the server only
Run this on web01:
sudo ufw allow from 192.168.56.0/24 to any port 22 proto tcp
sudo ufw allow from 192.168.56.80 to any port 10050 proto tcp comment 'Zabbix server passive checks'
sudo ufw --force enable
sudo ufw status | grep -E '22|10050'You should see:
Rules updated
Rules updated
Firewall is active and enabled on system startup
22/tcp ALLOW 192.168.56.0/24
10050/tcp ALLOW 192.168.56.80 # Zabbix server passive checksOnly zbx01 may reach the agent port. The agent’s Server parameter is a second layer: even if the firewall were open, the agent would refuse anyone else.
✅ Checkpoint: ufw on web01 allows 10050 only from 192.168.56.80.
5Test from the server with zabbix_get
Run this on zbx01:
sudo apt install -y zabbix-get
zabbix_get -s 192.168.56.81 -k agent.ping
zabbix_get -s 192.168.56.81 -k agent.version
zabbix_get -s 192.168.56.81 -k 'vfs.fs.size[/,pused]'
zabbix_get -s 192.168.56.81 -k 'system.cpu.load[all,avg1]'You should see this (the last two values are live and will differ):
1
8.0.0
48.534803
0.397949agent.ping always returns 1 when the agent answers. The other values are live: about 48% of web01’s root file system is used, and the one-minute load average is 0.4. If any of these fail, fix it here before you touch the frontend.
✅ Checkpoint: zabbix_get from zbx01 returns 1 for agent.ping and 8.0.0 for agent.version.
6Create the host in the frontend
Open Data collection > Hosts and click Create host. Fill in:
| Field | Value |
|---|---|
| Host name | web01 (must match Hostname in the agent config) |
| Templates | Linux by Zabbix agent |
| Host groups | Linux servers |
| Interfaces | Add > Agent: IP address 192.168.56.81, Connect to IP, port 10050 |
Click Add. The host appears in the list with a grey ZBX icon, which turns green within a minute or two once the first passive check succeeds.
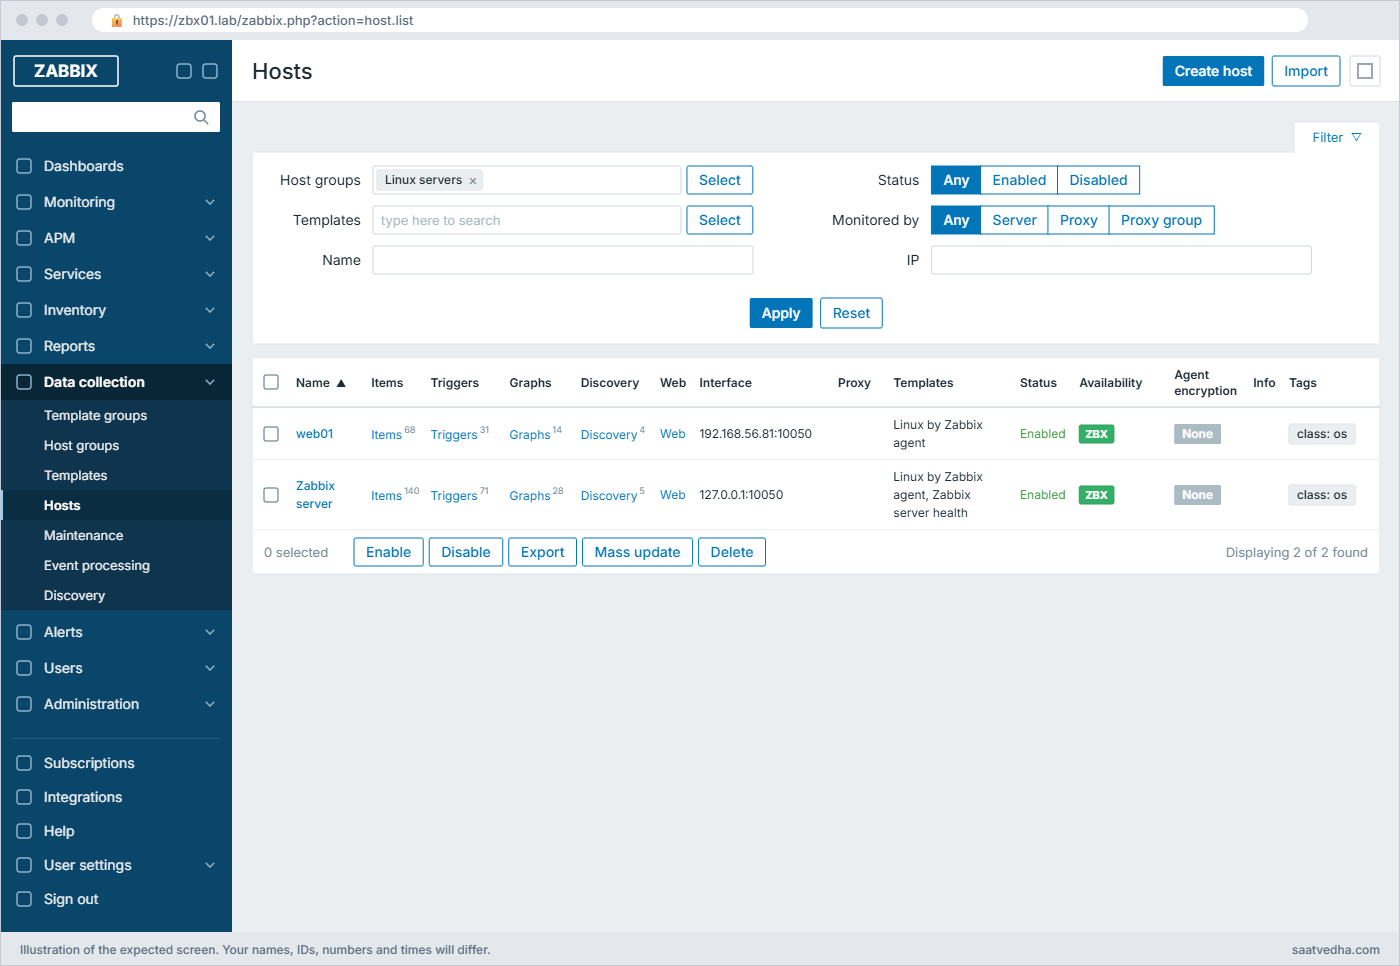
Data collection > Hosts: web01 with the Linux by Zabbix agent template and a green ZBX icon✅ Checkpoint: web01 is listed in Data collection > Hosts with a green ZBX icon.
7Look at Latest data
Open Monitoring > Latest data, set the filter to host web01 and click Apply. Within a few minutes you’ll see dozens of items with values and small graphs.
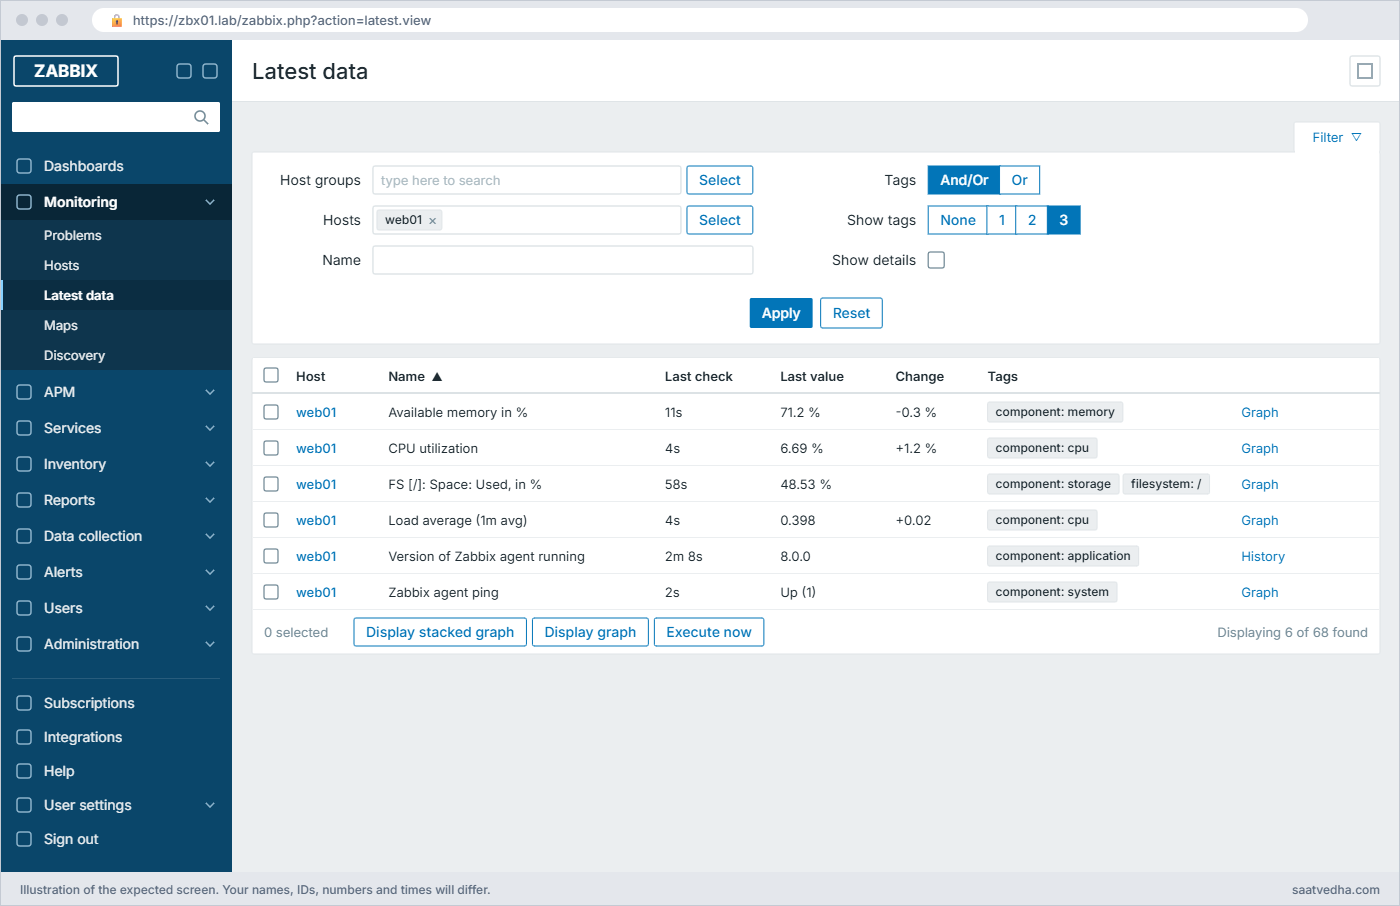
Some items in the Linux template are discovered (file systems, network interfaces, block devices), so they appear a little later than the rest, after the discovery rule’s first run. Click the graph link at the end of a row to see the item’s history.
✅ Checkpoint: Latest data for web01 shows CPU utilization, load average and FS [/] space used with recent values.
8Watch the server poll the agent
Run this on zbx01:
sudo grep web01 /var/log/zabbix/zabbix_server.log | tail -3You should see this line (your PID and time will differ), or nothing, which is also fine:
4630:20261108:114402.551 enabling Zabbix agent checks on host "web01": interface became availableThe server only logs availability changes, not every successful check, so a quiet log is a healthy log. This line appears when the interface first works or comes back after a failure.
✅ Checkpoint: You know where to find availability changes for web01 in the server log.
9Switch web01 to active checks
Open web01 in Data collection > Hosts. On the Templates line click Unlink next to Linux by Zabbix agent (not Unlink and clear, so the history stays), add Linux by Zabbix agent active, and click Update. Keep the agent interface; Zabbix uses it for the host’s IP in macros and for any passive items you add later.
Then check on web01 that the agent picked up its list:
sleep 30
sudo grep -iE 'active check|started to fail|working again' /var/log/zabbix/zabbix_agent2.log | tail -3You should see no “started to fail” lines; if there were earlier failures you’ll see:
2026/11/08 11:58:31.204871 [101] active check configuration update from [192.168.56.80:10051] is working againHover over the ZBX icon: the active check status shows available. In Latest data the same item names now show “Zabbix agent (active)” as the type. Agent 2 asks for a fresh list every 5 seconds by default (RefreshActiveChecks=5), and since 6.4 it only downloads the full list when the configuration changed, so this is cheap.
Older guides mention 120 seconds, which was the default before 6.4.
✅ Checkpoint: web01 uses Linux by Zabbix agent active, and Latest data keeps updating.
Break It, Then Fix It
Three failures you’ll meet in your first month with Zabbix. Do them in order and put each fix back before moving on.
1“Get value from agent failed: cannot connect”
Run this on web01:
sudo ufw delete allow from 192.168.56.80 to any port 10050 proto tcp
sudo ufw reject 10050/tcpThen on zbx01:
zabbix_get -s 192.168.56.81 -k agent.pingYou’ll get this error:
zabbix_get [5120]: Get value error: cannot connect to [[192.168.56.81]:10050]: [111] Connection refusedWithin about a minute the ZBX icon for web01 turns red. Hover over it (or check Data collection > Hosts) to see the interface error, and the server log tells the story in order:
Get value from agent failed: Cannot establish TCP connection to [[192.168.56.81]:10050]: [111] Connection refused
4691:20261108:120307.142 Zabbix agent item "agent.ping" on host "web01" failed: first network error, wait for 15 seconds
4691:20261108:120322.143 Zabbix agent item "system.cpu.load[all,avg5]" on host "web01" failed: another network error, wait for 15 seconds
4691:20261108:120352.145 temporarily disabling Zabbix agent checks on host "web01": interface unavailableA reject rule (or a stopped agent) answers with “Connection refused”, while a drop rule makes the server wait and then report a timeout. Either way the server stops polling the interface for a while and retries later, which is why the icon doesn’t go green the second you fix it.
Fix:
sudo ufw delete reject 10050/tcp
sudo ufw allow from 192.168.56.80 to any port 10050 proto tcp comment 'Zabbix server passive checks'✅ Checkpoint: zabbix_get from zbx01 returns 1 again and the ZBX icon turns green after the next check.
2The agent refuses the server
Now break the agent’s own allow list. Set Server to localhost only:
Run this on web01:
sudo sed -i 's/^Server=.*/Server=127.0.0.1/' /etc/zabbix/zabbix_agent2.d/10-lab.conf
sudo systemctl restart zabbix-agent2Then on zbx01:
zabbix_get -s 192.168.56.81 -k agent.pingYou’ll get this error:
ZBX_NOTSUPPORTED: Received empty response from Zabbix Agent at [192.168.56.81]. Assuming that agent dropped connection because of access permissions.The TCP connection worked (so the firewall is fine), but the agent closed it straight away because 192.168.56.80 isn’t in its Server list. The agent log on web01 says it plainly:
failed to accept an incoming connection: connection from "192.168.56.80" rejected, allowed hosts: "127.0.0.1"Fix:
sudo sed -i 's/^Server=.*/Server=192.168.56.80/' /etc/zabbix/zabbix_agent2.d/10-lab.conf
sudo systemctl restart zabbix-agent2✅ Checkpoint: zabbix_get works again and the agent log has no new “rejected” lines.
3Active checks: “host not found”
Change the agent’s Hostname to Web01 with a capital W. It looks harmless, but host names in Zabbix are case-sensitive.
Run this on web01:
sudo sed -i 's/^Hostname=.*/Hostname=Web01/' /etc/zabbix/zabbix_agent2.d/10-lab.conf
sudo systemctl restart zabbix-agent2
sleep 10; sudo tail -3 /var/log/zabbix/zabbix_agent2.logYou’ll get this error (web01 agent log):
... no active checks on server [192.168.56.80:10051]: host [Web01] not found
... active checks on server started to failAnd on zbx01 the server log shows:
4702:20261108:121131.851 cannot send list of active checks to "192.168.56.81": host [Web01] not found
4699:20261108:121131.850 cannot process heartbeat from host "Web01": host not foundPassive checks keep working, because the server connects by IP and never looks at the agent’s Hostname. Active items stop updating and, after a few minutes, the active part of the availability icon goes grey or red. This is the single most common active-check problem, usually from copying one agent config to many hosts or from HostnameItem=system.hostname returning an FQDN like web01.lab.
Fix:
sudo sed -i 's/^Hostname=.*/Hostname=web01/' /etc/zabbix/zabbix_agent2.d/10-lab.conf
sudo systemctl restart zabbix-agent2✅ Checkpoint: The agent log stops reporting “host [Web01] not found” and active items in Latest data update again.
This happened at work
Four hundred grey hosts after a template change
The on-call engineer in a telecom NOC in Hyderabad got the first ticket at 2 am: around 400 Linux hosts had gone grey in Zabbix after an evening change. Nobody had touched the agents. The change was a move from the passive Linux template to the active one, to take load off the server’s pollers.
The night shift first suspected the firewall, because grey hosts usually mean blocked traffic. They opened a ticket with the network team and checked 10051 from a few hosts with nc, which worked. An hour went on that before someone opened one agent log and saw “host [srv-hyd-app-031.noc.example] not found”.
The agents had been deployed years earlier with HostnameItem=system.hostname and no Hostname, so they introduced themselves with their full DNS names. The hosts in Zabbix had short names. Passive checks never cared, because they go by IP, so the mismatch had been invisible until the switch to active.
They rolled the template back for the night, and the next week pushed an Ansible change that set Hostname explicitly from the inventory name used in Zabbix, then moved to active in batches of 50. The post-incident note added one line to the change checklist: before switching to active checks, compare the agent Hostname with the Zabbix host name for every host.
Common mistakes and troubleshooting
| Mistake | What happens | What to do instead |
|---|---|---|
| Leaving Hostname=Zabbix server from the shipped file | Every new agent claims to be the server, active checks go to the wrong host or “not found” | Set Hostname to the exact host name used in the frontend |
| Linking both Linux templates | “Item with the same key already exists” or double data | Link either Linux by Zabbix agent or Linux by Zabbix agent active, not both |
| Opening 10050 on the Zabbix server instead of the host | Passive checks still fail | Open 10050 on the monitored host, only from the server or proxy |
| Forgetting to restart the agent after editing | Old settings stay in effect and the fix “doesn’t work” | sudo systemctl restart zabbix-agent2, then check the log |
| Installing both zabbix-agent and zabbix-agent2 | The second one fails to bind port 10050 | Run one agent per host; remove the classic agent if you move to agent 2 |
| Using Unlink and clear when switching templates | All history for those items is deleted | Use Unlink to keep the items as host items, or accept losing history on purpose |
| Testing only from the frontend | You can’t tell a network problem from an agent or key problem | Test with zabbix_get from the server first |
Interview questions
Click a question to open it. Each one is written the way an interviewer would ask it. Under it you will see why they ask it and one way you could answer, in your own words.
Fresher level
1. What are Server, ServerActive and Hostname in the agent config?
Why they ask this: A basic check that you can set up an agent without a tutorial open.
How you might answer: Server is the list of addresses allowed to ask the agent for passive checks on port 10050. ServerActive is where the agent connects on 10051 to get its active check list and send values. Hostname is the name the agent uses for active checks, and it must match the host name in the Zabbix frontend exactly, including case.
2. A host has a red ZBX icon. What do you check first?
Why they ask this: They want a quick, ordered troubleshooting approach.
How you might answer: I hover over the icon to read the error, then run zabbix_get -s with the host IP and -k agent.ping from the server. “Connection refused” or a timeout points to the agent being down or a firewall; “Received empty response … access permissions” means the agent’s Server parameter doesn’t include the server’s IP.
After that I check the agent log on the host and systemctl status zabbix-agent2.
2–5 years experience
3. Passive checks work for a host but all its active items have stopped. Walk me through the likely causes.
Why they ask this: They are checking that you know active checks have a different path and identity.
How you might answer: Active checks need the agent to reach the server on 10051 and the agent’s Hostname to match the host in Zabbix. I’d look at the agent log for “host [X] not found”, which means a name mismatch, or “cannot connect”, which means the path to 10051 is blocked.
I’d also confirm the items are of type Zabbix agent (active) and that ServerActive points to the server or proxy that actually monitors the host.
4. Why would you pick agent 2 over the classic agent for a new Linux build?
Why they ask this: They want concrete reasons, not “it’s newer”.
How you might answer: Agent 2 has built-in plugins for things like Docker, MySQL, Redis, systemd and SMART, so I don’t need UserParameter scripts for them. It runs checks concurrently, supports a persistent buffer for active data during outages, and is the agent new templates are written for.
I’d keep the classic agent only where we rely on old C loadable modules or on very small systems.
Senior level
5. You manage 2,000 Linux hosts. How do you roll out and configure agent 2 so names and access stay consistent?
Why they ask this: They are checking automation and how you avoid the Hostname problem at scale.
How you might answer: I’d deploy it with Ansible or a similar tool: the Zabbix repository, the zabbix-agent2 package, and a small drop-in file in /etc/zabbix/zabbix_agent2.d with Server, ServerActive and Hostname taken from the same inventory that creates hosts in Zabbix. Auto-registration with HostMetadata would then create the hosts and link templates without manual steps.
I’d use active checks for most hosts to reduce poller load, PSK or certificate encryption, and a dashboard of hosts with unavailable agents.
6. When would you keep passive checks instead of going fully active?
Why they ask this: They want to hear trade-offs, not a single rule.
How you might answer: Passive checks make it easy to test with zabbix_get, and the server sees a host as unreachable right away. They suit small, flat networks or devices where I can’t control the agent’s outbound connection.
Active checks scale better, work through NAT and one-way firewalls, and are required for log monitoring, so for large estates I go active and keep a passive agent.ping on critical hosts for a quick reachability signal.
Quick quiz
Q1. Which parameter must exactly match the host name in the frontend for active checks?
- Server
- ServerActive
- Hostname
- ListenPort
Show answer
C — The server finds the host for active checks by the agent’s Hostname, case-sensitive.
Q2. zabbix_get returns “Received empty response … access permissions”. What is the usual cause?
- The agent is stopped
- The item key is wrong
- The agent’s Server parameter does not include the caller
- Port 10051 is blocked
Show answer
C — The connection worked but the agent dropped it because the caller isn’t allowed.
Q3. Which port does the server use for passive checks to an agent?
- 10050
- 10051
- 443
- 10052
Show answer
A — The server connects to the agent on 10050.
Q4. What is the main config file for agent 2 on Ubuntu?
- /etc/zabbix/zabbix_agentd.conf
- /etc/zabbix/zabbix_agent2.conf
- /etc/zabbix-agent2/agent.conf
- /usr/share/zabbix/agent2.conf
Show answer
B — Agent 2 reads /etc/zabbix/zabbix_agent2.conf plus the files in zabbix_agent2.d.
Q5. Why should you not link both Linux templates to one host?
- It is not allowed by the license
- They contain the same item keys and conflict
- Active checks disable passive ones
- It doubles the frontend memory
Show answer
B — Both templates use the same item keys, so linking both clashes.
Quick recap
- Agent 2 is the Go agent with plugins; its config is /etc/zabbix/zabbix_agent2.conf plus drop-in files in zabbix_agent2.d.
- Server allows passive checks on 10050, ServerActive is where active checks go on 10051, and Hostname must match the frontend host name exactly.
- zabbix_get from the server is the fastest way to tell a network, permission or item-key problem apart.
- Link Linux by Zabbix agent or Linux by Zabbix agent active, never both; web01 now uses the active one.
- “Connection refused”, “access permissions” and “host [X] not found” each point to a different fix.
Next lesson
Lesson 5: Zabbix agent on Windows behind a firewall (active mode) → You install agent 2 on Windows Server with the MSI, run it in active-only mode, and monitor services and performance counters.
Further reading: Zabbix agent 2 Linux
Want to go deeper into Zabbix agent 2 Linux? The Zabbix manual covers agent 2, its configuration parameters and the passive and active check protocols. For the Linux metrics the template collects, see Linux performance monitoring, and compare the pull model with Prometheus Node Exporter.
You can also see the full plan for this course on the Zabbix Monitoring course page.
