What is Zabbix? Monitoring basics and your lab

What is Zabbix, and why do banks, telecom NOCs and data centres across India still run it on thousands of servers and switches? It’s an open-source monitoring system that collects numbers and text from your servers, network devices and applications, stores them in a database, decides when something has gone wrong and tells the right person. In this first lesson you’ll learn how its parts fit together, how a single value travels from a server to an alert email, and then you’ll build the two VMs you’ll use for the whole course.

Nothing gets installed today apart from Ubuntu itself. By the end you’ll have zbx01 and web01 talking to each other on fixed addresses, the clocks checked, and proof that the official Zabbix 8.0 package exists for your Ubuntu release, so Lesson 2 can go straight to the install.

Where this lesson fits

Lesson 1 of 24 in Zabbix Monitoring · Phase 1: Zabbix server and agents · Next: Lesson 2, install Zabbix on Ubuntu

TimeYou needBy the end you can
About 80 minutesA laptop with 8 GB RAM, VirtualBox 7, the Ubuntu Server 26.04 LTS ISOExplain the Zabbix data flow and passive vs active checks in an interview, and have zbx01 and web01 ready with a snapshot called base

What it is, in one line

Zabbix is a monitoring system where a central server collects values from agents, devices and checks, stores them in a SQL database, compares them with trigger rules, and sends alerts when a rule says something is wrong.

In Simple Words

The society watchman with a register

Picture the watchman at the gate of a big housing society. Every hour he walks round with a register and notes a few things for each building: is the water tank above half, is the lift working, is the generator diesel above 20 litres. Some buildings have a helper who walks down to the gate and reports these numbers to him without being asked, which saves him a lot of walking.

The register also has a page of rules written by the secretary, like “if the tank is below a quarter for two rounds, call the plumber”. When a rule is broken he marks it in red, phones the person on the list for that building, and keeps phoning the next person if nobody comes. When the tank fills up again he crosses out the red mark and writes “fixed at 4:10 pm”.

Zabbix works the same way: the server is the watchman, the agents are the helpers, the database is the register and triggers are the secretary’s rules.

Engineer's View

The parts of a Zabbix installation

Zabbix is written mostly in C (server, proxy, classic agent), Go (agent 2, web service) and PHP (the web frontend). Everything it knows lives in one SQL database: configuration, collected history, events and alerts. The frontend never talks to agents; it reads and writes the database and asks the server for a few live things such as its status and the queue.

ComponentWhat it doesDefault port
Zabbix serverThe brain. Polls agents and devices, receives active data, stores values, evaluates triggers, runs actions and escalations10051 (listens for active agents, proxies, zabbix_sender)
DatabaseMySQL, MariaDB or PostgreSQL holding configuration, history, trends, events and alerts. In 8.0: MySQL 8.4 or newer, MariaDB 10.11 or newer, PostgreSQL 15 or newer3306 (MySQL) / 5432 (PostgreSQL)
Web frontendPHP application served by Nginx or Apache. You configure hosts, templates and triggers here and look at graphs, problems and dashboards. Needs PHP 8.2 or newer in 8.080 / 443
Zabbix agent / agent 2Runs on the monitored host and reads CPU, memory, disks, logs, services. Agent 2 is the Go version with plugins (Docker, MySQL, PostgreSQL, Redis and more)10050 (passive checks)
Zabbix proxyCollects data on behalf of the server at a remote site, buffers it and forwards it. Has its own small database (often SQLite)10051
Java gatewayOptional helper that reads JMX values from Java applications such as Tomcat10052
Web serviceOptional helper that renders dashboards to PDF for scheduled reports10053

Every value Zabbix collects belongs to an item, and an item belongs to a host. The item has a key (for example system.cpu.util or vfs.fs.size[/,pused]), a type (Zabbix agent, SNMP agent, HTTP agent and so on), an update interval and a value type. Raw values go into the history tables, and once an hour Zabbix also writes min, average and max into trends so you can keep a year of graphs without keeping every sample.

Most of this configuration comes from templates. A template is a reusable bundle of items, triggers, graphs and discovery rules, so you link “Linux by Zabbix agent active” to a hundred servers once instead of creating thousands of items by hand.

How it works, step by step

1An item collects a value

Say you want to know how full the root file system on web01 is. In the frontend you create an item on host web01 with key vfs.fs.size[/,pused] and an interval of one minute. Every minute the agent on web01 reads the disk, and the value (say 48.53) reaches the server either because the server asked for it or because the agent sent it.

host: web01   item: vfs.fs.size[/,pused]   value: 48.534803   clock: 2026-11-08 10:41:00

2The server stores it in history and trends

The value goes through any preprocessing steps you defined (multiply, regex, JSONPath and so on), then into the server’s history cache and from there into the database. Zabbix also keeps the last values of each item in memory (the value cache), so triggers don’t have to read the database every time. The diagram below shows the full path one value takes, from the item all the way to an email.

What is Zabbix data flow: item, history, trigger, problem, action and email

3A trigger turns numbers into a problem

A trigger is an expression that reads item values, for example last(/web01/vfs.fs.size[/,pused])>90. Each time a new value arrives, the server recalculates the trigger. When the result goes from false to true, Zabbix creates a problem event with a severity (Information up to Disaster), and you see it under Monitoring > Problems.

A trigger action decides what happens next: which users get a message, through which media type (email, Telegram, Slack, a webhook), and what to do if nobody acknowledges it in 30 minutes. When the trigger becomes false again, Zabbix closes the problem and can send a recovery message.

4Passive and active checks

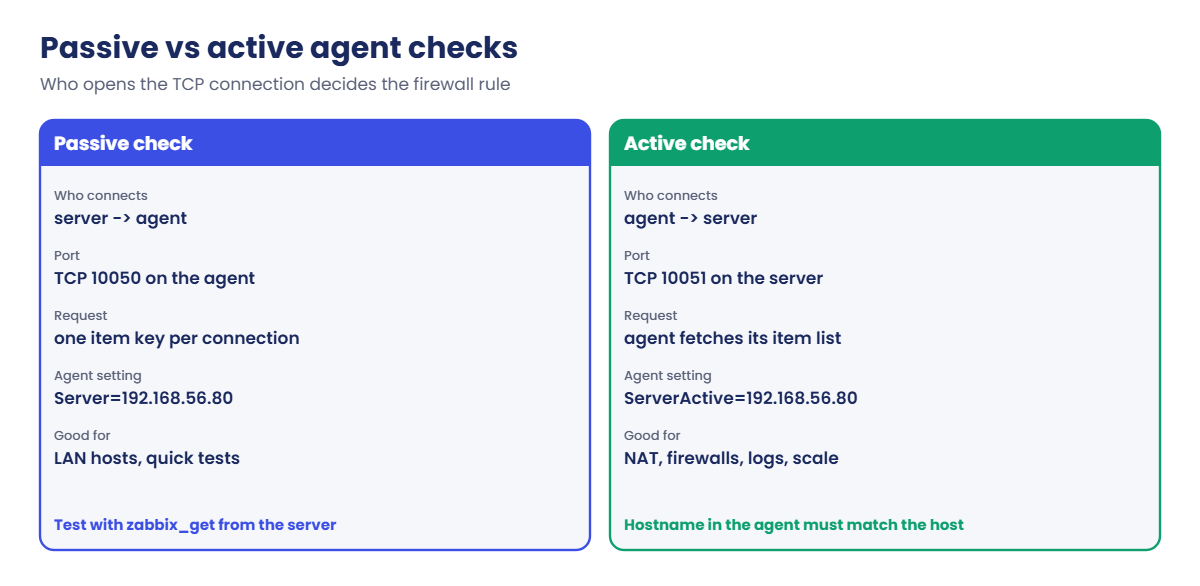
An agent can deliver values in two ways, and you’ll choose between them on almost every host. In a passive check the server (or proxy) opens a TCP connection to the agent on port 10050 and asks for one key, and the agent answers. In an active check the agent connects out to the server on port 10051, downloads the list of items it should collect, then sends the values back in batches.

Active checks are what you want when the server can’t reach the host (a branch behind NAT, a Windows box behind a strict firewall) and when you have a lot of hosts, because the server isn’t opening a connection for every item. Log monitoring only works as an active check. The diagram below compares the two.

What is Zabbix passive vs active checks: ports 10050 and 10051 and who connects

5Where Zabbix fits next to other tools

You’ll meet Zabbix, Prometheus and Nagios-style tools in interviews and often in the same company, so it helps to know what each is built for.

QuestionZabbixPrometheusNagios / Icinga
How data arrivesAgent checks (passive or active), SNMP, HTTP, IPMI, JMX, SSH, trapsPulls HTTP /metrics pages from exportersRuns check plugins that return OK, WARNING or CRITICAL
Where it is storedSQL database (history + trends)Its own time series databaseMostly state only; graphs need an add-on
How you configure itWeb frontend and templates (also API and YAML import)YAML files, often in GitText config files
Strong atServers, network and SNMP estates, Windows, a GUI for NOC teams, built-in alert escalationContainers, Kubernetes, application metrics, PromQLSimple up/down service checks
Weak atVery high-churn container metricsSNMP traps, GUI-driven setup, long history without extra toolsTrends, dashboards, large estates

Zabbix releases a Long Term Support (LTS) version every 18 months or so. An LTS gets three years of full support and two more years of security and critical fixes, while the versions in between (7.2, 7.4) get only about six months. This course uses Zabbix 8.0 LTS, released in November 2026.

Many workplaces still run 7.0 LTS (supported until June 2029), and where 8.0 behaves differently from 7.0 the lessons say so in one line.

Hands-on lab: build zbx01 and web01 in VirtualBox

Before you run any command, double-check it

Read every command twice before you press Enter. Check the target: the server name, the user, the disk or device name, the path and the sizes. These commands are for learning and were tested in our lab, not on your system. At work, run the read-only commands first, follow your change process, make sure a backup exists, and ask a second person to check anything that changes or deletes data. You run them at your own risk.

You’ll build two Ubuntu Server 26.04 VMs: zbx01 (192.168.56.80) will run the Zabbix server, MySQL and the frontend, and web01 (192.168.56.81) is the server being watched, with a website and database to monitor in later lessons. Each VM has two network cards: NAT for internet access and Host-only so your laptop and the VMs talk on fixed addresses. Zabbix 8.0 has official packages for Ubuntu 26.04, and 26.04 ships MySQL 8.4, which is the minimum MySQL that 8.0 supports, so stick to 26.04 for this course.

1Check the VirtualBox host-only network

In VirtualBox Manager open File > Tools > Network Manager, Host-only Networks tab. You should see an adapter with IPv4 address 192.168.56.1 and mask 255.255.255.0. If there is none, click Create.

Untick its DHCP server, because the VMs get static addresses.
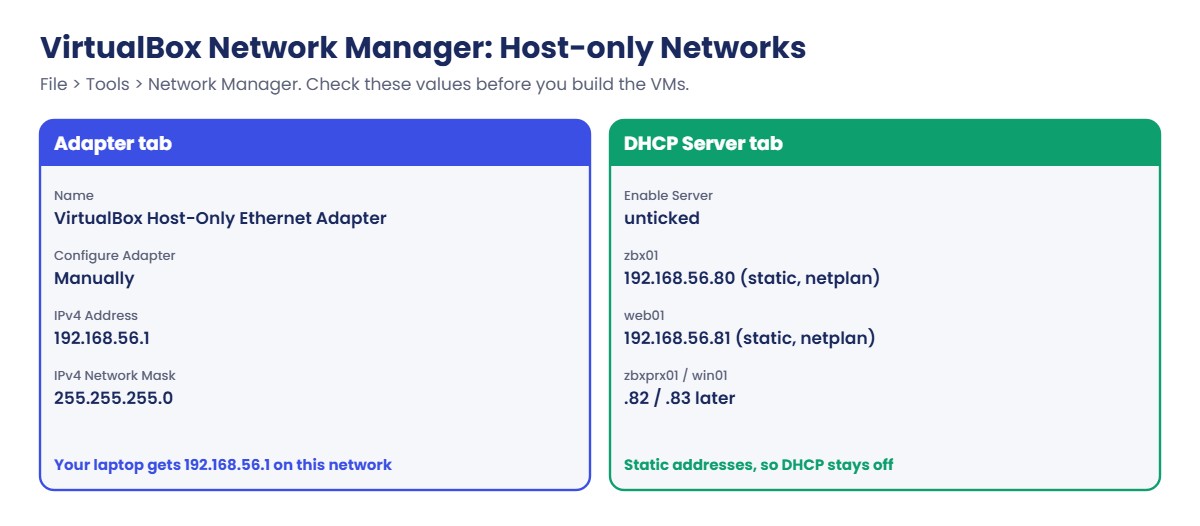
What is Zabbix lab setup: VirtualBox host-only network 192.168.56.1/24 with the DHCP server off
The host-only network settings to check in VirtualBox Network Manager

✅ Checkpoint: A host-only network 192.168.56.1/24 exists and its DHCP server is off.

2Create zbx01

Click New, name it zbx01, choose the Ubuntu Server 26.04 ISO and tick Skip Unattended Installation. Give it 3072 MB RAM, 2 CPUs and a 30 GB disk (Zabbix plus MySQL is happier with 3 GB than 2 GB). Before the first boot open Settings > Network: Adapter 1 attached to NAT, Adapter 2 enabled and attached to Host-only Adapter.

VMRAMCPUDiskAdapter 1Adapter 2Address on enp0s8
zbx013072 MB230 GBNATHost-only192.168.56.80
web011024 MB115 GBNATHost-only192.168.56.81
zbxprx01 (Lesson 19)1024 MB115 GBNATHost-only192.168.56.82
win01 (optional, Lesson 5)4096 MB240 GBNATHost-only192.168.56.83

✅ Checkpoint: zbx01 exists with 3 GB RAM, 2 CPUs and two adapters, NAT and Host-only.

3Install Ubuntu Server on zbx01

Start the VM and go through the installer with the defaults. Use hostname zbx01, user student, and tick Install OpenSSH server. Leave the second network card as it is, since netplan sets it next.

When it finishes, remove the ISO, reboot and log in.

Run this on zbx01:

hostnamectl --static
ip -br addr

You should see this (your fe80:: addresses will differ):

zbx01
lo               UNKNOWN        127.0.0.1/8 ::1/128
enp0s3           UP             10.0.2.15/24 metric 100 fe80::a00:27ff:fe3c:51d2/64
enp0s8           DOWN

enp0s3 is the NAT card with the usual VirtualBox address 10.0.2.15, which gives you internet. enp0s8 is the host-only card and has no address yet.

✅ Checkpoint: You are logged in as student on zbx01, and enp0s8 is listed.

4Give enp0s8 a static address with netplan

Paste this whole block on zbx01:

sudo tee /etc/netplan/60-hostonly.yaml >/dev/null <<'EOF'
network:
  version: 2
  ethernets:
    enp0s8:
      dhcp4: false
      addresses: [192.168.56.80/24]
EOF
sudo chmod 600 /etc/netplan/60-hostonly.yaml
sudo netplan apply
ip -br addr show enp0s8

You should see:

enp0s8           UP             192.168.56.80/24 fe80::a00:27ff:fe71:9a0e/64

Netplan files are YAML, so indentation is done with spaces and a single tab breaks the file. The chmod 600 stops netplan warning that the file is readable by everyone.

✅ Checkpoint: enp0s8 on zbx01 shows 192.168.56.80/24 and state UP.

5Update the system and check the clock

Zabbix stamps every value with the server’s time, and trigger functions like “average over the last 5 minutes” depend on it. A VM whose clock drifts gives you odd graphs and confusing alert times, so check it now.

Run this on zbx01:

sudo apt update && sudo apt full-upgrade -y
sudo timedatectl set-timezone Asia/Kolkata
timedatectl

You should see this (your times will differ):

               Local time: Sun 2026-11-08 11:12:40 IST
           Universal time: Sun 2026-11-08 05:42:40 UTC
                 RTC time: Sun 2026-11-08 05:42:39
                Time zone: Asia/Kolkata (IST, +0530)
System clock synchronized: yes
              NTP service: active
          RTC in local TZ: no

“System clock synchronized: yes” means systemd-timesyncd has reached an NTP server through the NAT card. Use your own time zone if you’re outside India; the frontend can show each user their own zone later.

✅ Checkpoint: timedatectl shows System clock synchronized: yes on zbx01.

6Clone web01 and change its identity

Shut zbx01 down (sudo poweroff), right-click it and choose Clone. Name the clone web01, choose Generate new MAC addresses for all network adapters and Full clone, then set its RAM to 1024 MB and 1 CPU. Start web01 only and run:

Run this on web01:

sudo hostnamectl set-hostname web01
sudo sed -i 's/192.168.56.80/192.168.56.81/' /etc/netplan/60-hostonly.yaml
sudo netplan apply
sudo rm -f /etc/machine-id && sudo systemd-machine-id-setup
sudo rm -f /etc/ssh/ssh_host_* && sudo dpkg-reconfigure openssh-server
hostnamectl --static; ip -br addr show enp0s8

You should see this (your fingerprints and fe80:: address will differ):

Initializing machine ID from random generator.
Creating SSH2 RSA key; this may take some time ...
3072 SHA256:p0Xc7v1mQe9RkY2sTn4bWfL8hJd3GzA6uKiN5oVrE1c root@web01 (RSA)
Creating SSH2 ECDSA key; this may take some time ...
256 SHA256:Hq2LwB7xZt0cM4nVyR8eKs1oPf6aJd9UgT3iWlN5bCk root@web01 (ECDSA)
Creating SSH2 ED25519 key; this may take some time ...
256 SHA256:Vm8sQe3rT1yU6iO0pA4dF7gH2jK9lZ5xC8vB3nM1qWe root@web01 (ED25519)
web01
enp0s8           UP             192.168.56.81/24 fe80::a00:27ff:fe0d:44b7/64

A clone carries the same machine ID and SSH host keys as the original. Regenerating them avoids duplicate DHCP leases on the NAT side and “host key changed” warnings when you SSH in later. The hostname matters a lot in Zabbix, because in Lesson 4 the agent on this VM introduces itself as web01.

✅ Checkpoint: web01 has hostname web01, address 192.168.56.81 and a new machine ID.

7Add all lab names to /etc/hosts and test

Start zbx01 again. On both VMs add the four lab names (zbxprx01 and win01 come later, but adding them now saves editing the file twice), then ping across.

Run this on zbx01 and on web01:

printf '%s\n' '192.168.56.80 zbx01 zbx01.lab' '192.168.56.81 web01 web01.lab' '192.168.56.82 zbxprx01 zbxprx01.lab' '192.168.56.83 win01 win01.lab' | sudo tee -a /etc/hosts
ping -c 2 web01

You should see this on zbx01 (your ping times will differ):

192.168.56.80 zbx01 zbx01.lab
192.168.56.81 web01 web01.lab
192.168.56.82 zbxprx01 zbxprx01.lab
192.168.56.83 win01 win01.lab
PING web01 (192.168.56.81) 56(84) bytes of data.
64 bytes from web01 (192.168.56.81): icmp_seq=1 ttl=64 time=0.583 ms
64 bytes from web01 (192.168.56.81): icmp_seq=2 ttl=64 time=0.471 ms

--- web01 ping statistics ---
2 packets transmitted, 2 received, 0% packet loss, time 1001ms
rtt min/avg/max/mdev = 0.471/0.527/0.583/0.056 ms

On your laptop, add 192.168.56.80 zbx01.lab to the hosts file too (C:\Windows\System32\drivers\etc\hosts on Windows, opened in Notepad as administrator, or /etc/hosts on Linux and macOS). Then ssh student@zbx01.lab from your laptop should work, which is much nicer than the VirtualBox console.

✅ Checkpoint: zbx01 and web01 ping each other by name, and you can SSH to zbx01.lab from your laptop.
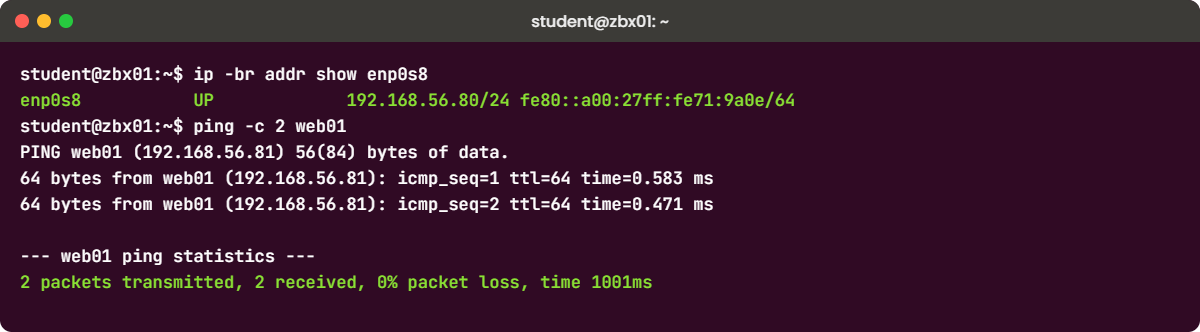
What is Zabbix lab: zbx01 on 192.168.56.80 pinging web01 over the host-only network
zbx01 has its host-only address and reaches web01 by name

8Confirm the Zabbix 8.0 package exists for your Ubuntu

Before Lesson 2, check that the Zabbix repository has a release package for your exact Ubuntu version. This one check saves a lot of confusion if you installed a different release by mistake.

Run this on zbx01:

. /etc/os-release; echo "$PRETTY_NAME ($VERSION_ID)"
URL=https://repo.zabbix.com/zabbix/8.0/release/ubuntu/pool/main/z/zabbix-release/zabbix-release_latest_8.0+ubuntu$VERSION_ID"_all.deb"
wget -q --spider "$URL" && echo "Zabbix 8.0 package found for Ubuntu $VERSION_ID"

You should see this (after the upgrade in step 5, 26.04.1 or a later point release):

Ubuntu 26.04.1 LTS (26.04)
Zabbix 8.0 package found for Ubuntu 26.04

If the last line doesn’t appear, check the version you installed and your internet access through the NAT card. Notice the /release/ part of the URL: Zabbix 7.0 used repo.zabbix.com/zabbix/7.0/ubuntu/... without it, so old guides copied for 8.0 give you a 404.

Shut both VMs down and take a VirtualBox snapshot of each one called base (select the VM, Snapshots, Take).

✅ Checkpoint: The package check prints “Zabbix 8.0 package found”, and zbx01 and web01 both have a snapshot called base.

Break It, Then Fix It

Three problems that catch almost everyone while building the lab. They’re all safe, but take the base snapshot first so you can roll back if you get lost.

1A tab in the netplan file

Open the netplan file on web01 with sudo nano /etc/netplan/60-hostonly.yaml, delete the spaces in front of dhcp4: false and press the Tab key instead. Save and apply:

Run this on web01:

sudo netplan apply

You’ll get this error:

/etc/netplan/60-hostonly.yaml:5:1: Invalid YAML: tabs are not allowed for indent:
	dhcp4: false
^

YAML allows only spaces for indentation, and netplan tells you the file, line and column (line 5, column 1). Nothing was changed on the network, because netplan refuses the whole file.

Fix: replace the tab with six spaces, then apply again:

sudo sed -i 's/^\t/      /' /etc/netplan/60-hostonly.yaml
sudo netplan apply && ip -br addr show enp0s8

✅ Checkpoint: netplan apply runs without errors and enp0s8 still shows 192.168.56.81/24.

2An address without the /24

Change the address line to addresses: [192.168.56.81] (drop the /24) and apply again.

You’ll get this error:

/etc/netplan/60-hostonly.yaml:6:18: Error in network definition: address '192.168.56.81' is missing /prefixlength
      addresses: [192.168.56.81]
                 ^

Netplan needs the prefix length to know the subnet mask. Without it the kernel wouldn’t know which addresses are on the local network and which need a router.

Fix:

sudo sed -i 's#\[192.168.56.81\]#[192.168.56.81/24]#' /etc/netplan/60-hostonly.yaml
sudo netplan apply && ip -br addr show enp0s8

✅ Checkpoint: The address line reads [192.168.56.81/24] and netplan apply is quiet.

3The VMs can’t reach each other

Take web01’s host-only card down and ping it from zbx01:

Run this on web01, then the ping on zbx01:

sudo ip link set enp0s8 down
# on zbx01:
ping -c 2 web01

You’ll get this error:

PING web01 (192.168.56.81) 56(84) bytes of data.
From zbx01 (192.168.56.80) icmp_seq=1 Destination Host Unreachable
From zbx01 (192.168.56.80) icmp_seq=2 Destination Host Unreachable

--- web01 ping statistics ---
2 packets transmitted, 0 received, +2 errors, 100% packet loss, time 1027ms

“Destination Host Unreachable” coming from your own address means ARP got no answer: nothing on the network owns 192.168.56.81. You get the same thing when Adapter 2 is unticked in VirtualBox, attached to NAT by mistake, or attached to a different host-only network. In Zabbix this exact situation later shows up as a red ZBX icon and “cannot connect” errors, so it’s worth recognising now.

Fix:

sudo ip link set enp0s8 up      # on web01
ip -br addr show enp0s8          # should show 192.168.56.81/24 UP

✅ Checkpoint: ping web01 from zbx01 works again.

This happened at work

The ATM switch that was “green”

My team lead tells this one from a cooperative bank in Nagpur, about eight years ago. The bank had a few dozen branch servers and a small data centre, and monitoring was a script that pinged every box every five minutes and sent an SMS if one stopped answering. One Monday at 10:30 am the branches started calling: ATM withdrawals were failing across the city, but every server was answering ping.

The team spent the first hour restarting the ATM switch application, because that had fixed things before. It came up, ran for a few minutes and failed again. Only when someone logged in and ran df -h did they see that the log partition on the database server was at 100%, filled by an archive job that had stopped rotating its files on Saturday night.

Clearing old logs fixed the outage by noon. The real change came after: they set up Zabbix with an agent on every server, linked the Linux template so every file system was discovered automatically, and added a trigger for “free space below 15%” with a second, higher-severity one at 5%. They also used the trends graphs to see that the partition had been growing by about 2 GB a day for a month.

The rule my team lead took away was to monitor what the service needs (disk, database connections, the application port) and to keep enough history to see slow trends, because ping only tells you the machine is switched on.

Common mistakes and troubleshooting

MistakeWhat happensWhat to do instead
Thinking the frontend collects dataYou restart Nginx or PHP when data stops, and nothing changesThe server collects and stores data; the frontend only reads the database. Check zabbix-server first
Cloning a VM without new MACs or machine-idBoth VMs get the same NAT lease or SSH warns that the host key changedPick “Generate new MAC addresses” and reset machine-id and SSH host keys, as in step 6
Giving the Zabbix VM 1 GB RAMMySQL and the server fight for memory and the VM swaps or kills processesGive zbx01 3 GB in the lab; real installs size RAM by the number of items and the database size
Using a tab in a netplan filenetplan apply refuses the file with “tabs are not allowed for indent”Use spaces only, and copy the block from the lesson as it is
Installing a different Ubuntu release than the courseThe Zabbix repo package or the MySQL version doesn’t match and Lesson 2 failsUse Ubuntu 26.04 LTS and run the package check in step 8
Leaving the VM clock wrongGraphs show gaps and triggers with time windows behave oddlyCheck timedatectl shows “System clock synchronized: yes” on every VM

Interview questions

Click a question to open it. Each one is written the way an interviewer would ask it. Under it you will see why they ask it and one way you could answer, in your own words.

Fresher level

1. What is Zabbix, and what are its main components?

Why they ask this: They want to see that you know it is more than “a monitoring dashboard” and can name what runs where.

How you might answer: Zabbix is an open-source monitoring system. The Zabbix server collects values, stores them in a SQL database such as MySQL or PostgreSQL, evaluates triggers and sends alerts, and the PHP web frontend is where we configure hosts and templates and look at problems and graphs.

On the monitored side we run Zabbix agent or agent 2, and at remote sites a Zabbix proxy can collect data and forward it. There are also optional helpers like the Java gateway for JMX and the web service for PDF reports.

2. What is the difference between a passive and an active agent check?

Why they ask this: A basic check that you know which side opens the connection, because firewall tickets depend on it.

How you might answer: In a passive check the server connects to the agent on port 10050 and asks for one item, and the agent replies. In an active check the agent connects to the server on port 10051, gets its list of items and sends values back in batches.

So passive needs the server to reach the agent, and active needs the agent to reach the server. Log monitoring only works with active checks.

2–5 years experience

3. Walk me through what happens between a disk filling up and an on-call engineer getting an email.

Why they ask this: They want the whole chain in order, which shows you can troubleshoot any link in it.

How you might answer: The agent collects the item, for example vfs.fs.size[/,pused], and delivers it to the server by a passive or active check. The server preprocesses it, writes it to history and recalculates the triggers that use that item. If the trigger expression becomes true, a problem event is created with a severity.

A trigger action matches that event on conditions like host group and severity and runs its operations: send a message to a user group through a media type such as email, and escalate if nobody acknowledges. When the value drops back, the problem closes and a recovery message can go out.

4. Your firewall team asks which ports Zabbix needs. What do you tell them?

Why they ask this: They check that you know the direction of each flow, not only the numbers.

How you might answer: Agents listen on TCP 10050 for passive checks, so the server or proxy must reach the agent on 10050. The server and proxy listen on TCP 10051, so active agents, proxies and zabbix_sender must reach the server on 10051.

Users reach the frontend on 443, and the frontend talks to the database on 3306 or 5432 and to the server on 10051. If it’s all active checks, I only need agent-to-server on 10051.

Senior level

5. A manager wants to replace Zabbix with Prometheus for 1,500 servers, 300 switches and some Windows hosts. What would you advise?

Why they ask this: They are checking judgement and knowledge of where each tool fits, not loyalty to one.

How you might answer: I’d first ask what problem we are solving. Zabbix is strong for SNMP switches, Windows, classic servers and NOC teams who work in a GUI with built-in escalations, while Prometheus is better for containers, Kubernetes and application metrics with PromQL.

For that estate I’d probably keep Zabbix for infrastructure and add Prometheus for the container platform, with Grafana on top of both. If they still want one tool, I’d run both in parallel for a few months and move alerts across only when the new side covers every trigger.

6. How would you choose between Zabbix 7.0 LTS and 8.0 LTS for a new installation today?

Why they ask this: They want to hear that you think about support windows and dependencies, not only new features.

How you might answer: Both are LTS releases. 7.0 is supported until mid-2029 and is very well tested, while 8.0 came out in November 2026 and is supported longer, but early point releases usually carry more bugs.

I’d also check dependencies: 8.0 needs PHP 8.2 or newer and MySQL 8.4 or newer, so on an OS that ships MySQL 8.0 it means extra work. For a new build I’d lean to 8.0 after testing it in a lab, maybe waiting for 8.0.1 or 8.0.2 for anything critical.

Quick quiz

Q1. Which component evaluates triggers and sends alerts in Zabbix?

  1. The web frontend
  2. The Zabbix server
  3. Zabbix agent 2
  4. The database
Show answer

B — The server collects, stores and evaluates. The frontend only reads and writes the database.

Q2. On which port does Zabbix agent listen for passive checks?

  1. 10050
  2. 10051
  3. 10052
  4. 443
Show answer

A — Agents listen on 10050. The server and proxy listen on 10051, and the Java gateway on 10052.

Q3. In an active check, who opens the connection?

  1. The server opens it to the agent
  2. The frontend opens it to the agent
  3. The agent opens it to the server on 10051
  4. The database opens it to the agent
Show answer

C — Active agents connect out to the server (or proxy), fetch their item list and send values back.

Q4. Where does Zabbix keep hourly min, average and max values for long-term graphs?

  1. History
  2. Trends
  3. Events
  4. The value cache
Show answer

B — History keeps every value for a short time; trends keep hourly aggregates for much longer.

Q5. How long does a Zabbix LTS release get full support?

  1. Six months
  2. One year
  3. Three years
  4. Ten years
Show answer

C — LTS releases get three years of full support plus two years of limited (security and critical) fixes.

Quick recap

  • Zabbix is a server, a SQL database and a PHP frontend, with agents, proxies and optional helpers around them.
  • A value travels item, history, trigger, problem, action, media type, and each link is something you can check when an alert doesn’t arrive.
  • Passive checks: the server connects to the agent on 10050. Active checks: the agent connects to the server on 10051.
  • This course uses Zabbix 8.0 LTS on Ubuntu 26.04, which needs MySQL 8.4+ and PHP 8.2+; 7.0 LTS is still common at work.
  • Your lab is ready: zbx01 at 192.168.56.80 and web01 at 192.168.56.81, both with a snapshot called base.

Next lesson

Lesson 2: Install Zabbix 8.0 server, database and frontend on Ubuntu → You add the official repository, create the MySQL database, import the schema, connect the server and finish the web installer.

Further reading: what is Zabbix

Want to go deeper into what is Zabbix? The official Zabbix 8.0 manual covers the definitions used here, the requirements page lists supported databases and PHP versions, and the life cycle and release policy explains LTS support. If you want to compare with the pull model, read What is Prometheus, and for the Linux side see Linux performance monitoring.

You can also see the full plan for this course on the Zabbix Monitoring course page.

Scroll to Top

This website uses cookies

We use a few cookies to keep this site working. If you allow it, we also use Google Analytics to count visits so we can improve our lessons. You can accept all, deny the optional ones, or choose what to allow.