Database monitoring: MySQL and PostgreSQL
-
Phase 1: Zabbix server and agents
-
Phase 2: Items, triggers, templates and dashboards
-
Phase 3: Alerts, proxies, SNMP and automation
Zabbix MySQL monitoring with agent 2 needs no scripts, no .my.cnf tricks and no UserParameters: the agent has a MySQL plugin built in, and the official template “MySQL by Zabbix agent 2” turns one status query into about fifty items, triggers and graphs. PostgreSQL works the same way through a loadable plugin.
In this lesson you install MySQL and PostgreSQL on web01, create a monitoring user with only the grants it needs, link both templates and read the numbers that matter: connections, slow queries, buffer pool, replication. Then you break the login, the connection path and the grants, because those three cause nearly every “database template not working” ticket.
Where this lesson fits
Lesson 21 of 24 in Zabbix Monitoring · Phase 3: Alerts, proxies, SNMP and automation · Before this: Lesson 20, SNMP monitoring · Next: Lesson 22, Zabbix API with Python
| Time | You need | By the end you can |
|---|---|---|
| About 100 minutes | zbx01 and web01 from Lessons 1 to 20, web01 with agent 2 (behind remote-proxy or not, both work) | web01 monitored by “MySQL by Zabbix agent 2” and “PostgreSQL by Zabbix agent 2” with least-privilege users zbx_monitor |
What it is, in one line
Zabbix agent 2 has database plugins that log in to MySQL or PostgreSQL with a read-only monitoring user, collect status data in one call, and feed the official templates.
In Simple Words
The hospital ward round
In a busy Bengaluru hospital the senior nurse does a round every few minutes. She doesn’t operate on anyone and she can’t change prescriptions; she reads each patient’s chart, checks pulse and BP, and writes the numbers down. Her ID card opens the wards but not the pharmacy store.
If her card stops working, she can’t read any chart, and the doctors stop getting updates even though the patients are fine.
The agent 2 plugin is that nurse, the zbx_monitor user is her limited ID card, and the template is the chart she fills in.
Engineer's View
How agent 2 talks to your database
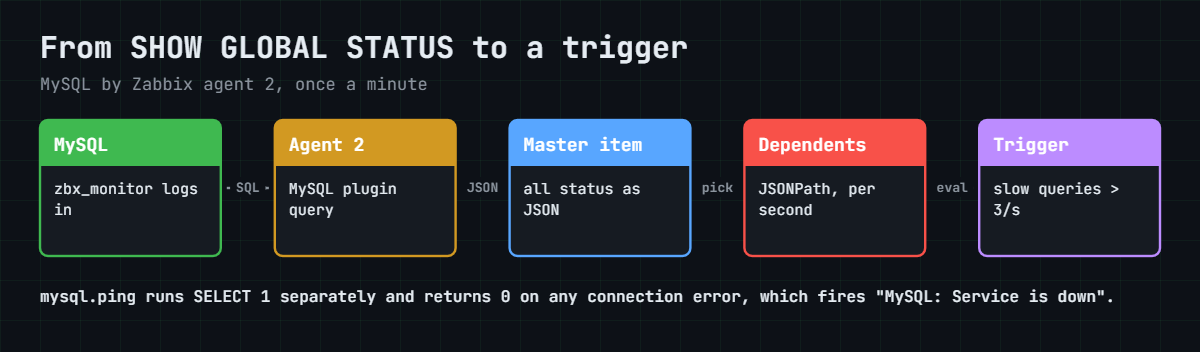
The MySQL plugin is built into agent 2. Each key, like mysql.get_status_variables[...], takes a connection string, a user and a password, opens a connection (kept open and reused for Plugins.Mysql.KeepAlive, 300 seconds by default) and runs a query such as SHOW GLOBAL STATUS. The template has one master item that returns all status variables as JSON every minute, and about forty dependent items pick values with JSONPath, for example $.Threads_connected.
PostgreSQL is a loadable plugin since 6.0.10, shipped as the separate package zabbix-agent2-plugin-postgresql, which agent 2 starts as a helper process. Its template “PostgreSQL by Zabbix agent 2” expects a user with the built-in pg_monitor role. Both templates are configured through host macros, so you link the template and fill in a few values.
| Template macro | Default | Lab value |
|---|---|---|
| {$MYSQL.DSN} | (empty) | tcp://127.0.0.1:3306 |
| {$MYSQL.USER} / {$MYSQL.PASSWORD} | (empty) | zbx_monitor / Zbx@Mon2026 (Secret text) |
| {$MYSQL.SLOW_QUERIES.MAX.WARN} | 3 | 3 per second for 5 minutes |
| {$PG.CONNSTRING.AGENT2} | tcp://localhost:5432 | tcp://localhost:5432 |
| {$PG.USER} / {$PG.PASSWORD} | zbx_monitor / (empty) | zbx_monitor / Zbx@Mon2026 (Secret text) |
| {$PG.DATABASE} | postgres | postgres |
The MySQL connection string accepts only two schemes, tcp://host:port and unix:/path/to/socket, and credentials must never be embedded in the URI. 8.0 notes that monitoring MySQL 8.4 and later needs agent 2 version 8.0 or newer, and its MySQL plugin understands the newer SHOW REPLICA STATUS as well as the old SHOW SLAVE STATUS. There’s also a new “MariaDB by Zabbix agent” template in 8.0 if you run MariaDB.
How it works, step by step
1The master item fetches all status variables
Every minute agent 2 runs mysql.get_status_variables["{$MYSQL.DSN}","{$MYSQL.USER}","{$MYSQL.PASSWORD}"], which returns SHOW GLOBAL STATUS as one JSON object. mysql.ping runs SELECT 1 separately and returns 1 or 0, so “Service is down” fires even when the login itself fails.
2Dependent items and preprocessing do the maths
Counters like Slow_queries and Questions only grow, so the template uses JSONPath and then Change per second to show rates. Gauges like Threads_connected are used as they are. The diagram below shows the path from the database to a trigger.
3Discovery finds databases and replicas
Two LLD rules run in the background: “Database discovery” lists schemas (minus information_schema) and creates a size item for each, and “Replication discovery” runs the replica status query and creates items for IO and SQL thread status and seconds behind source. On a server that isn’t a replica, replication discovery finds nothing, which is normal.
4Grants decide what the plugin can see
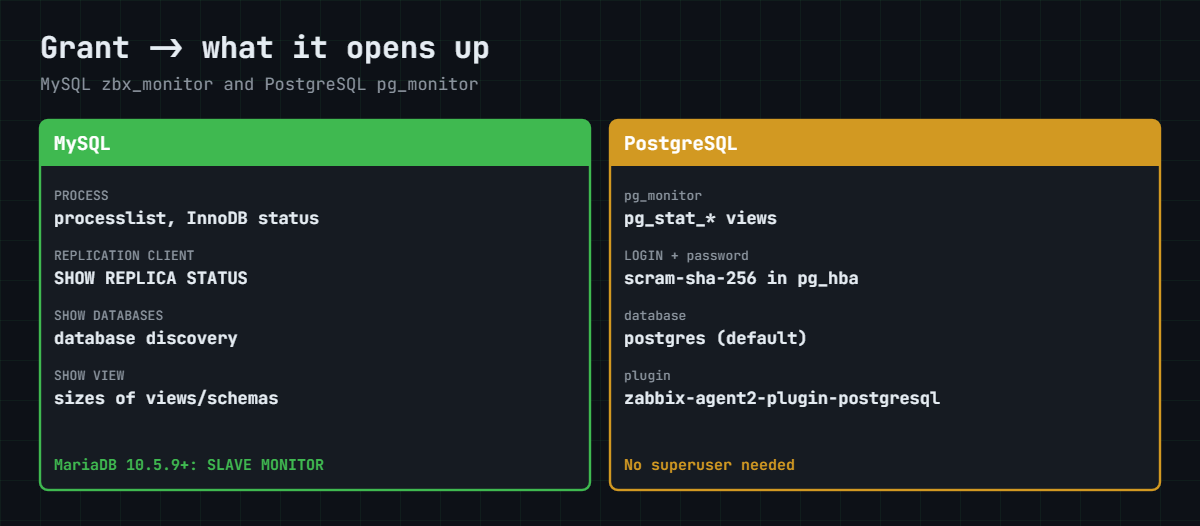
Each kind of data needs a specific privilege, and missing ones fail item by item rather than all at once. The second diagram maps each grant to the data it opens up, so you never need to give a monitoring user ALL PRIVILEGES.
5Other ways to watch databases
For databases on hosts where you can’t install agent 2 (managed cloud databases, appliances), Zabbix offers the Database monitor item type, which runs SQL through ODBC from the server or proxy (StartODBCPollers, default 1). For Java applications and Kafka or Tomcat, the Java gateway (package zabbix-java-gateway, port 10052) reads JMX values; you enable it with JavaGateway and StartJavaPollers in zabbix_server.conf and add a JMX interface on the host.
| Metric (MySQL) | Status variable | Why you care |
|---|---|---|
| Threads connected / Max used connections | Threads_connected, Max_used_connections | Close to max_connections means new logins will be refused |
| Slow queries per second | Slow_queries | Bad queries or missing indexes, often after a release |
| Buffer pool utilization | Innodb_buffer_pool_pages_* | Too low wastes RAM, near 100% with high reads means too small |
| Aborted connections per second | Aborted_connects | Wrong passwords, attacks or network trouble |
| Replication seconds behind | Seconds_Behind_Source | Reports from a replica showing old data |
| Refused connections | Connection_errors_max_connections | Users already getting “Too many connections” |
Hands-on lab: MySQL and PostgreSQL on web01 with agent 2 plugins
Before you run any command, double-check it
Read every command twice before you press Enter. Check the target: the server name, the user, the disk or device name, the path and the sizes. These commands are for learning and were tested in our lab, not on your system. At work, run the read-only commands first, follow your change process, make sure a backup exists, and ask a second person to check anything that changes or deletes data. You run them at your own risk.
Everything runs on web01 (192.168.56.81, 1 GB RAM): MySQL 8.4 and PostgreSQL from the Ubuntu archive, plus agent 2 which is already there. The frontend steps happen on zbx01. If memory is tight, do the MySQL part, stop MySQL, then do PostgreSQL.
Outputs from the database clients were captured from MySQL 8.0 and PostgreSQL 16 in a test container; the messages are the same on MySQL 8.4 and on PostgreSQL 18, which Ubuntu 26.04 ships.
1Install MySQL on web01
Run this on web01:
sudo apt install -y mysql-server
sudo systemctl status mysql --no-pager | head -3
sudo mysql -e "select version();"You should see this (your times will differ):
● mysql.service - MySQL Community Server
Loaded: loaded (/usr/lib/systemd/system/mysql.service; enabled; preset: enabled)
Active: active (running) since Sun 2026-11-08 15:02:11 IST; 8s ago
version()
8.4.11-0ubuntu0.26.04.1Ubuntu’s MySQL listens on 127.0.0.1:3306 and on the socket /var/run/mysqld/mysqld.sock, and root logs in through the socket with sudo mysql, without a password. That’s all you need, because agent 2 runs on the same host.
✅ Checkpoint: sudo mysql on web01 shows a MySQL 8.4.x version.
2Create the zbx_monitor user with minimal grants
Run this on web01:
sudo mysql <<'EOF'
CREATE USER 'zbx_monitor'@'localhost' IDENTIFIED BY 'Zbx@Mon2026';
CREATE USER 'zbx_monitor'@'127.0.0.1' IDENTIFIED BY 'Zbx@Mon2026';
GRANT REPLICATION CLIENT, PROCESS, SHOW DATABASES, SHOW VIEW ON *.* TO 'zbx_monitor'@'localhost';
GRANT REPLICATION CLIENT, PROCESS, SHOW DATABASES, SHOW VIEW ON *.* TO 'zbx_monitor'@'127.0.0.1';
SHOW GRANTS FOR 'zbx_monitor'@'127.0.0.1';
EOF
mysql -uzbx_monitor -p'Zbx@Mon2026' -h127.0.0.1 -e "show global status like 'Threads_connected'"You should see:
Grants for zbx_monitor@127.0.0.1
GRANT PROCESS, SHOW DATABASES, REPLICATION CLIENT, SHOW VIEW ON *.* TO `zbx_monitor`@`127.0.0.1`
mysql: [Warning] Using a password on the command line interface can be insecure.
Variable_name Value
Threads_connected 2These four privileges are what the official template README asks for, and none of them can read or change your application data. Two accounts are needed because MySQL treats a socket login (localhost) and a TCP login from 127.0.0.1 as different hosts. The official README uses 'zbx_monitor'@'%' for remote agents; on a real server, limit it to the hosts that will connect.
✅ Checkpoint: mysql as zbx_monitor over 127.0.0.1 returns Threads_connected.
3Test the plugin from the agent
Before touching the frontend, ask agent 2 directly. zabbix_agent2 -t runs one key locally with the real plugin.
Run this on web01:
sudo zabbix_agent2 -t 'mysql.ping[tcp://127.0.0.1:3306,zbx_monitor,Zbx@Mon2026]'
sudo zabbix_agent2 -t 'mysql.version[tcp://127.0.0.1:3306,zbx_monitor,Zbx@Mon2026]'You should see:
mysql.ping[tcp://127.0.0.1:3306,zbx_monitor,Zbx@Mon2026][s|1]
mysql.version[tcp://127.0.0.1:3306,zbx_monitor,Zbx@Mon2026][s|8.4.11-0ubuntu0.26.04.1]The [s|1] means a string result of 1, so the plugin connected and ran SELECT 1. Testing this way takes the server, proxy and template out of the picture, so if it fails here the problem is on web01.
✅ Checkpoint: zabbix_agent2 -t returns [s|1] for mysql.ping and the MySQL version for mysql.version.

4Link the MySQL template and set macros
In Data collection > Hosts open web01, Templates: link MySQL by Zabbix agent 2. On the Macros tab add:
| Macro | Value | Type |
|---|---|---|
| {$MYSQL.DSN} | tcp://127.0.0.1:3306 | Text |
| {$MYSQL.USER} | zbx_monitor | Text |
| {$MYSQL.PASSWORD} | Zbx@Mon2026 | Secret text |
Click Update. The template uses passive agent items, so web01’s host needs its agent interface (it has one from Lesson 4). If you’d rather not keep passwords in Zabbix at all, define a named session in agent 2 instead, put the session name in {$MYSQL.DSN} and leave user and password empty.
Optional named session, on web01:
sudo tee /etc/zabbix/zabbix_agent2.d/plugins.d/mysql-lab.conf >/dev/null <<'EOF'
Plugins.Mysql.Sessions.Lab.Uri=tcp://127.0.0.1:3306
Plugins.Mysql.Sessions.Lab.User=zbx_monitor
Plugins.Mysql.Sessions.Lab.Password=Zbx@Mon2026
EOF
sudo chown root:zabbix /etc/zabbix/zabbix_agent2.d/plugins.d/mysql-lab.conf
sudo chmod 640 /etc/zabbix/zabbix_agent2.d/plugins.d/mysql-lab.conf
sudo systemctl restart zabbix-agent2✅ Checkpoint: web01 has “MySQL by Zabbix agent 2” linked and the three MySQL macros set.
5Read the MySQL numbers in Latest data
After two or three minutes open Monitoring > Latest data and set Hosts to web01. In 8.0 the template’s item names have no “MySQL:” prefix, so type a name such as Threads or Status in the Name filter, or sort by Name and look for these:
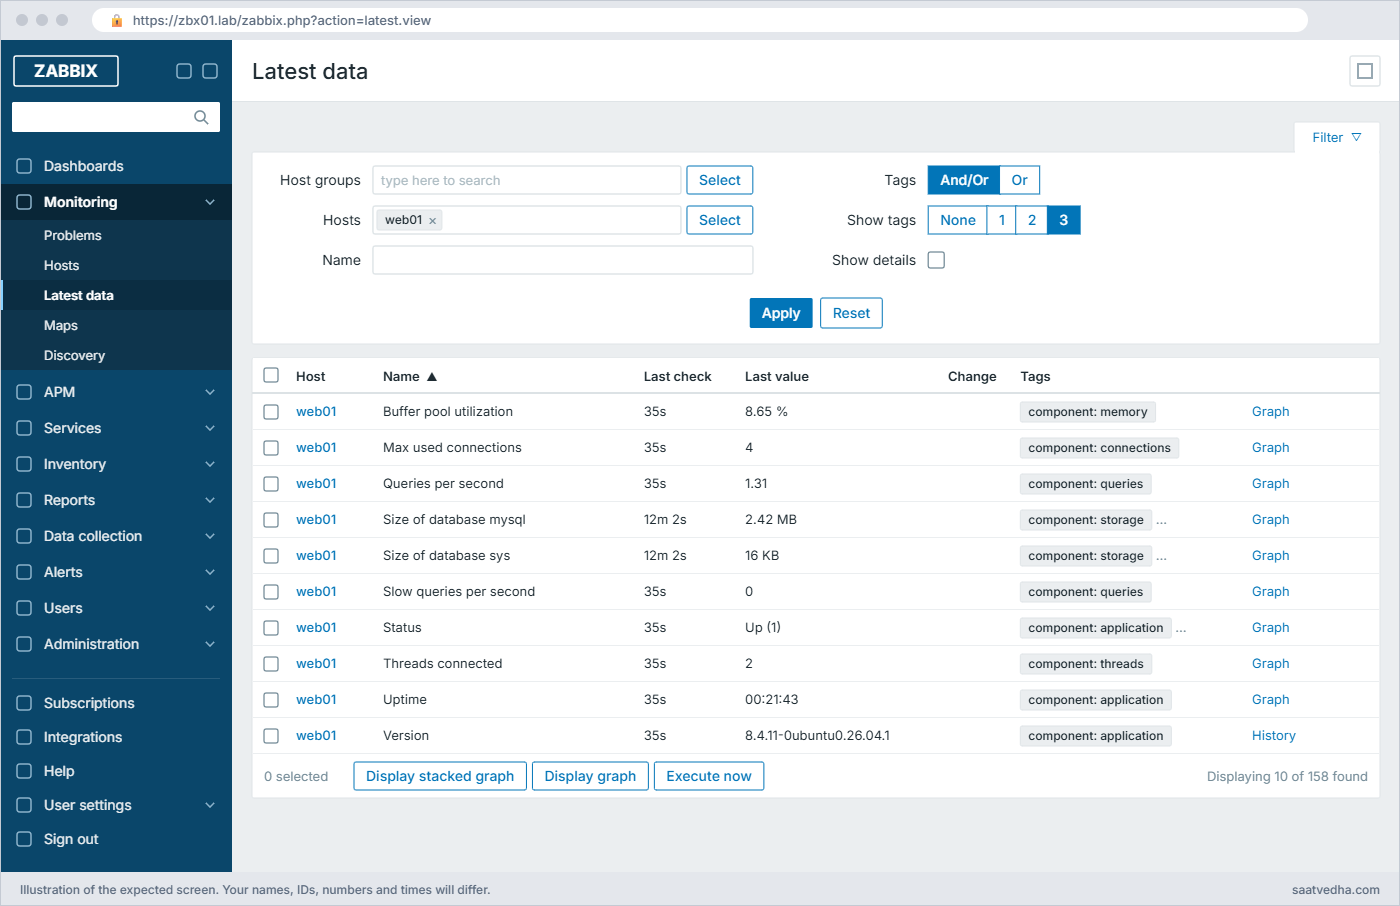
The “Size of database” lines come from Database discovery, so they appear a little later. Buffer pool utilization is low on a lab VM because there is almost no data; on a real server it should sit well above the 50% that {$MYSQL.BUFF_UTIL.MIN.WARN} checks.
✅ Checkpoint: Latest data shows Status Up (1) and Threads connected for web01.
6Make a slow query and watch it
Set the slow query threshold low and run a few slow queries so the counter moves.
Run this on web01:
sudo mysql -e "SET GLOBAL long_query_time = 1;"
for i in 1 2 3 4 5; do sudo mysql -e "SELECT SLEEP(2);" >/dev/null; done
mysql -uzbx_monitor -p'Zbx@Mon2026' -h127.0.0.1 -e "show global status like 'Slow_queries'" 2>/dev/nullYou should see:
Variable_name Value
Slow_queries 5In Latest data “Slow queries per second” shows a small positive rate for one interval. The template’s trigger “MySQL: Server has slow queries” needs more than {$MYSQL.SLOW_QUERIES.MAX.WARN} (3) per second for 5 minutes, so five queries won’t fire it, which is how you want a production trigger to behave. Set long_query_time back to 10 afterwards.
✅ Checkpoint: Slow_queries is 5 or more and the Slow queries per second graph shows a small spike.
7PostgreSQL: install, plugin and monitoring role
Run this on web01:
sudo apt install -y postgresql zabbix-agent2-plugin-postgresql
sudo -u postgres psql <<'EOF'
CREATE USER zbx_monitor WITH PASSWORD 'Zbx@Mon2026' INHERIT;
GRANT pg_monitor TO zbx_monitor;
EOF
sudo systemctl restart zabbix-agent2
PGPASSWORD='Zbx@Mon2026' psql -h 127.0.0.1 -U zbx_monitor -d postgres -tAc "select count(*) from pg_stat_activity; select pg_is_in_recovery();"
sudo zabbix_agent2 -t 'pgsql.ping[tcp://localhost:5432,zbx_monitor,Zbx@Mon2026,postgres]'You should see this (the connection count will differ):
CREATE ROLE
GRANT ROLE
6
f
pgsql.ping[tcp://localhost:5432,zbx_monitor,Zbx@Mon2026,postgres][s|1]pg_monitor is a built-in role that can read all pg_stat_* views and settings without touching table data. Ubuntu’s default pg_hba.conf already allows password (scram-sha-256) logins over 127.0.0.1, so no edit is needed here. The f means this server is not a standby.
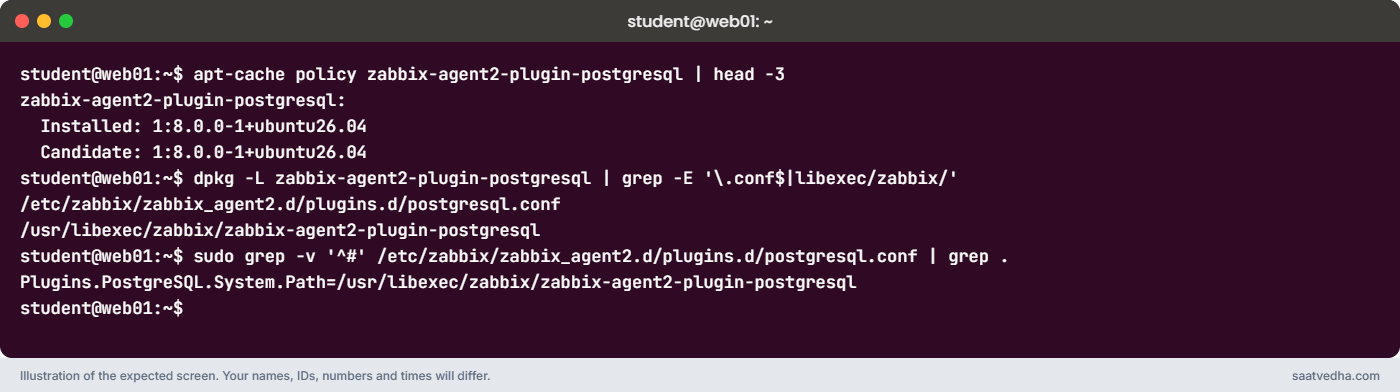
Then check what the plugin package installed. Run this on web01:
apt-cache policy zabbix-agent2-plugin-postgresql | head -3
dpkg -L zabbix-agent2-plugin-postgresql | grep -E '\.conf$|libexec/zabbix/'
sudo grep -v '^#' /etc/zabbix/zabbix_agent2.d/plugins.d/postgresql.conf | grep .You should see:
zabbix-agent2-plugin-postgresql:
Installed: 1:8.0.0-1+ubuntu26.04
Candidate: 1:8.0.0-1+ubuntu26.04
/etc/zabbix/zabbix_agent2.d/plugins.d/postgresql.conf
/usr/libexec/zabbix/zabbix-agent2-plugin-postgresql
Plugins.PostgreSQL.System.Path=/usr/libexec/zabbix/zabbix-agent2-plugin-postgresqlThe package comes from the Zabbix 8.0 stable repository for Ubuntu 26.04 and adds two files that matter: the plugin binary in /usr/libexec/zabbix/ and its settings file in plugins.d, which agent 2 already reads through its Include line. The only active line in that file tells agent 2 where the binary is; everything else in it is a commented default you can change for timeouts or named sessions.
✅ Checkpoint: psql as zbx_monitor works and zabbix_agent2 -t returns [s|1] for pgsql.ping.
8Link the PostgreSQL template
On web01 link PostgreSQL by Zabbix agent 2 and add macro {$PG.PASSWORD} = Zbx@Mon2026 as Secret text. The template’s defaults already use tcp://localhost:5432, user zbx_monitor and database postgres. After a few minutes check Latest data for web01 and look for items such as Ping and Connections sum: Total (no “PostgreSQL:” prefix in 8.0).
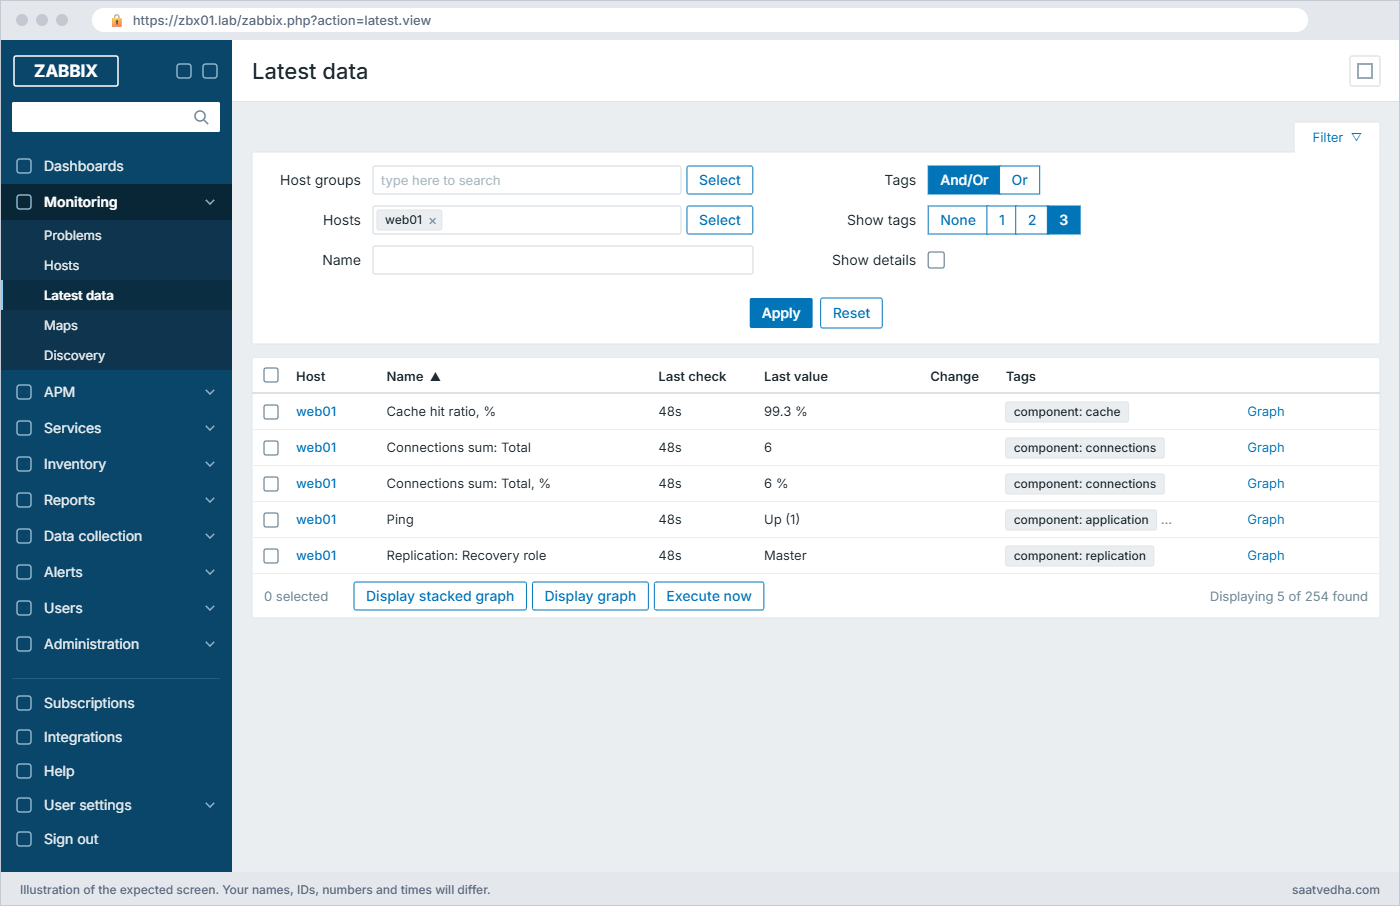
✅ Checkpoint: Latest data for web01 shows Ping Up (1) and Connections sum: Total from the PostgreSQL template.
Break It, Then Fix It
Three failures that cause most database monitoring tickets. Take a snapshot of web01 called “db-ok” first.
1Access denied for zbx_monitor
Change the password macro to a wrong value (Zbx@Mon2025) on web01 and click Update, or test directly:
Run this on web01:
sudo zabbix_agent2 -t 'mysql.get_status_variables[tcp://127.0.0.1:3306,zbx_monitor,Zbx@Mon2025]'
mysql -uzbx_monitor -p'Zbx@Mon2025' -h127.0.0.1 -e "select 1"You’ll get this error (item and agent test):
Cannot fetch data: Error 1045 (28000): Access denied for user 'zbx_monitor'@'localhost' (using password: YES).And from the mysql client:
ERROR 1045 (28000): Access denied for user 'zbx_monitor'@'localhost' (using password: YES)Notice that MySQL reports 'zbx_monitor'@'localhost' even for a TCP login from 127.0.0.1, because it resolves the address; if only the 127.0.0.1 account existed with a different password you’d get the same message. mysql.ping doesn’t show the error, it returns 0, so the first thing you see is “MySQL: Service is down” while MySQL is perfectly healthy.
Fix:
Set {$MYSQL.PASSWORD} back to Zbx@Mon2026 (or reset the user's password:
ALTER USER 'zbx_monitor'@'localhost' IDENTIFIED BY 'Zbx@Mon2026'; and the same for @'127.0.0.1').✅ Checkpoint: The MySQL items on web01 are supported again and Status is Up (1).
2Plugin connection refused (socket vs TCP)
A colleague “hardened” MySQL by turning off TCP networking. Simulate it and test the plugin:
Run this on web01:
echo -e "[mysqld]\nskip-networking" | sudo tee /etc/mysql/mysql.conf.d/zz-lab-nonet.cnf
sudo systemctl restart mysql
sudo zabbix_agent2 -t 'mysql.ping[tcp://127.0.0.1:3306,zbx_monitor,Zbx@Mon2026]'
sudo zabbix_agent2 -t 'mysql.version[tcp://127.0.0.1:3306,zbx_monitor,Zbx@Mon2026]'You’ll get this:
mysql.ping[tcp://127.0.0.1:3306,zbx_monitor,Zbx@Mon2026][s|0]
mysql.version[tcp://127.0.0.1:3306,zbx_monitor,Zbx@Mon2026][m|ZBX_NOTSUPPORTED] [Cannot fetch data: dial tcp 127.0.0.1:3306: connect: connection refused.]MySQL is running, but only on its Unix socket, so TCP to 3306 is refused. The opposite also happens: {$MYSQL.DSN} points at unix:/run/mysqld/mysqld.sock on a distro where the socket lives somewhere else, and the error ends in connect: no such file or directory. Agent 2 runs as user zabbix, so it also needs permission to open the socket directory.
Fix (either use the socket, or remove the change):
# Option A: monitor over the socket
# set {$MYSQL.DSN} = unix:/var/run/mysqld/mysqld.sock
sudo zabbix_agent2 -t 'mysql.ping[unix:/var/run/mysqld/mysqld.sock,zbx_monitor,Zbx@Mon2026]'
# Option B: undo the lab change
sudo rm /etc/mysql/mysql.conf.d/zz-lab-nonet.cnf && sudo systemctl restart mysql✅ Checkpoint: mysql.ping returns [s|1] again, through the socket or TCP.
3Missing grant for replication status
Remove one privilege and run the replication discovery key:
Run this on web01:
sudo mysql -e "REVOKE REPLICATION CLIENT ON *.* FROM 'zbx_monitor'@'127.0.0.1';"
sudo zabbix_agent2 -t 'mysql.replication.discovery[tcp://127.0.0.1:3306,zbx_monitor,Zbx@Mon2026]'
mysql -uzbx_monitor -p'Zbx@Mon2026' -h127.0.0.1 -e "SHOW REPLICA STATUS" 2>/dev/nullYou’ll get this from the client, and the discovery rule shows the same Error 1227 text inside its “Cannot fetch data” message:
ERROR 1227 (42000) at line 1: Access denied; you need (at least one of) the SUPER, REPLICATION CLIENT privilege(s) for this operationOnly the “Replication discovery” rule becomes Not supported; status variables, ping and database sizes keep working, which is why this one hides for months. On MariaDB 10.5.9 and later the privilege for replica status is SLAVE MONITOR (the README lists both). Don’t fix it with GRANT ALL, add back only what the template needs.
Fix:
sudo mysql -e "GRANT REPLICATION CLIENT ON *.* TO 'zbx_monitor'@'127.0.0.1';"✅ Checkpoint: Replication discovery is supported again (it finds 0 replicas on web01, which is correct).
This happened at work
The patient app that ran out of connections
The on-call engineer at a healthcare app company in Bengaluru got a call at 8:15 one Monday morning: doctors couldn’t open appointment lists. Zabbix showed every server green, and the only MySQL check they had was a UserParameter that ran mysqladmin ping every five minutes, which kept answering “mysqld is alive”.
His first move was restarting the application pods, which helped for ten minutes and then the errors came back. The MySQL error log finally showed “Too many connections”: a weekend release had added a background job that opened a connection per patient record and never closed it, and max_connections was 300.
They killed the job, raised the limit for the day and fixed the code. Then the team replaced the ping script with the agent 2 MySQL template, which already has “Refused connections” and connection count items, and added a trigger on Threads_connected above 80% of max_connections for 5 minutes.
Two months later that trigger fired at 70% on a Sunday night after another release, and they rolled back before any doctor noticed.
Common mistakes and troubleshooting
| Mistake | What happens | What to do instead |
|---|---|---|
| Using root or an application user for monitoring | A leaked macro gives full database access, and monitoring breaks when the app password rotates | A dedicated zbx_monitor user with only REPLICATION CLIENT, PROCESS, SHOW DATABASES, SHOW VIEW (pg_monitor for PostgreSQL) |
| Creating only zbx_monitor@localhost and connecting over TCP to 127.0.0.1 | Access denied even with the right password, depending on how MySQL matches the host | Create the account for the host part you connect from, or use the socket |
| Putting the password in the URI tcp://user:pass@host | The plugin ignores embedded credentials and the login fails | Use the key parameters or macros, or a named session in plugins.d |
| Password macro as plain Text | Anyone with host read access can see it in the frontend and exports | Use Secret text or a vault macro, or a named session on the agent |
| Installing the PostgreSQL template without the plugin package | Items say the key is not supported | Install zabbix-agent2-plugin-postgresql and restart agent 2 |
| Only checking whether the database answers ping | Database is “up” while users get Too many connections or replicas lag hours | Alert on connection usage, refused connections, slow queries and replication lag |
| Granting ALL to fix one unsupported item | The monitoring account becomes a security hole | Read the template README and add the one privilege that item needs |
Interview questions
Click a question to open it. Each one is written the way an interviewer would ask it. Under it you will see why they ask it and one way you could answer, in your own words.
Fresher level
1. How do you monitor MySQL with Zabbix agent 2?
Why they ask this: They want the basic setup steps.
How you might answer: I create a monitoring user with REPLICATION CLIENT, PROCESS, SHOW DATABASES and SHOW VIEW, link the “MySQL by Zabbix agent 2” template to the host and set {$MYSQL.DSN}, {$MYSQL.USER} and {$MYSQL.PASSWORD}, with the password as a secret macro.
The MySQL plugin is built into agent 2, so there are no scripts; I test first with zabbix_agent2 -t mysql.ping and check Latest data after a few minutes.
2. Which MySQL metrics would you alert on first?
Why they ask this: A check that you know what matters operationally.
How you might answer: Service down, connections close to max_connections and refused connections, because those hit users directly. Then slow queries per second, replication lag and IO or SQL thread stopped on replicas.
I also watch buffer pool utilization and on-disk temporary tables for performance, but those are usually warnings, not pages.
2–5 years experience
3. The MySQL template shows “Service is down” but the DBA says MySQL is fine. Walk me through it.
Why they ask this: They want to see you know mysql.ping returns 0 on any connection error.
How you might answer: mysql.ping returns 0 for any connection problem, not only a dead server, so I run zabbix_agent2 -t on the host with the same parameters and look at another item like mysql.version, which shows the real error. Usually it’s Access denied after a password change, a wrong host part on the user, or the DSN pointing at TCP while MySQL only listens on the socket.
Once I see the actual message I fix the macro, grant or DSN, and I check the agent log for plugin errors too.
4. How do you avoid storing database passwords in Zabbix?
Why they ask this: They are checking awareness of secret macros, vaults and named sessions.
How you might answer: The simplest step is Secret text macros, which aren’t shown in the frontend or exports. Better is a vault (HashiCorp Vault or CyberArk) with vault macros, so Zabbix fetches the secret at runtime.
On the agent side I can define a named session in plugins.d with the URI, user and password in a file readable only by root and zabbix, and put just the session name in {$MYSQL.DSN}.
Senior level
5. How would you monitor 200 MySQL and 100 PostgreSQL instances, some of them managed cloud databases?
Why they ask this: They want scale and mixed-environment thinking.
How you might answer: For VMs I deploy agent 2 with the plugins and the monitoring users through automation, and link the official templates through host groups or autoregistration metadata. For managed databases where I can’t install an agent, I either run agent 2 on a small VM or proxy in the same network with sessions pointing at each endpoint, or use Database monitor items over ODBC.
I standardise macros and thresholds per environment, keep passwords in a vault, and put the busier fleets behind proxies so polling doesn’t sit on the main server.
6. Replication lag alerts keep firing every night for 20 minutes. What do you look at?
Why they ask this: They want root-cause thinking, not just changing the threshold.
How you might answer: I line up the lag graph with the backup and batch job schedules, because a nightly mysqldump or a large batch on the source often causes it. I also check whether the replica has fewer resources or uses single-threaded apply, and whether long transactions are blocking.
If the lag is expected and harmless, I tune the trigger with a time-based condition or a longer window; if not, I work with the DBA on parallel replication or moving the backup to the replica.
Quick quiz
Q1. Which privileges does the official MySQL agent 2 template ask for?
- ALL PRIVILEGES
- SELECT on all databases
- REPLICATION CLIENT, PROCESS, SHOW DATABASES, SHOW VIEW
- SUPER only
Show answer
C — These four cover status, processes, schema listing and replica status without data access.
Q2. What does mysql.ping return when the login fails?
- An error
- 0
- 1
- Nothing
Show answer
B — The ping key returns 0 for any connection error, so the template shows “Service is down”.
Q3. Which URI forms does the agent 2 MySQL plugin accept?
- http:// and https://
- tcp:// and unix:
- mysql:// only
- jdbc:mysql://
Show answer
B — Only tcp and unix schemes are supported, and credentials must not be embedded.
Q4. How is the PostgreSQL plugin delivered for agent 2 on Ubuntu?
- Built into the agent
- As the zabbix-agent2-plugin-postgresql package
- As a UserParameter file
- Only on Windows
Show answer
B — PostgreSQL is a loadable plugin shipped as a separate package since 6.0.10.
Q5. Which PostgreSQL role should the monitoring user get?
- superuser
- pg_read_all_data
- pg_monitor
- postgres
Show answer
C — pg_monitor allows reading statistics views and settings.
Quick recap
- Agent 2 has a built-in MySQL plugin and a loadable PostgreSQL plugin; the official templates are configured with host macros.
- Create zbx_monitor with REPLICATION CLIENT, PROCESS, SHOW DATABASES, SHOW VIEW for MySQL, and pg_monitor for PostgreSQL.
- Test with zabbix_agent2 -t on the host before blaming the template; mysql.ping only says 0, other items show the real error.
- Most failures are Access denied (password or host part), TCP vs socket, and a missing grant for one feature like replication.
- Alert on connections, refused connections, slow queries and replication lag, not only on “database is up”.
Next lesson
Lesson 22: Zabbix API with Python: automate hosts and reports → You call the Zabbix API with curl and Python, create hosts from a CSV, schedule maintenance and export problems to a report.
Further reading: Zabbix MySQL monitoring
Want to go deeper into Zabbix MySQL monitoring? The template READMEs in the Zabbix repository for MySQL and PostgreSQL list every item and macro, and the manual has pages on the MySQL plugin and ODBC checks. Preprocessing with JSONPath was covered in Lesson 11, and for Linux-side database performance see Linux performance monitoring.
You can also see the full plan for this course on the Zabbix Monitoring course page.
