Monitor SNMP devices with Zabbix: v2c, v3, discovery and traps

Zabbix SNMP monitoring is how you watch the things that can’t run an agent: switches, routers, firewalls, UPS units, printers and storage arrays. They all speak SNMP, so Zabbix asks them for numbers by OID, and they can also shout at Zabbix with traps when something breaks.

In this lesson web01 becomes your “network device”: you install snmpd on it with a read-only v2c community and a v3 user, walk it from zbx01 with net-snmp tools, and then monitor it in Zabbix 8.0 the modern way, with one walk[] master item and dependent items. You finish with network discovery and SNMP traps through snmptrapd.

Where this lesson fits

Lesson 20 of 24 in Zabbix Monitoring · Phase 3: Alerts, proxies, SNMP and automation · Before this: Lesson 19, Zabbix proxy · Next: Lesson 21, MySQL and PostgreSQL monitoring

TimeYou needBy the end you can
About 2 hourszbx01 and web01 from Lessons 1 to 19 (web01 may be behind remote-proxy; this lesson creates a separate SNMP host polled by the server)A host “web01-snmp” polled over SNMPv3 with interface discovery, a discovery rule for SNMP devices, and link-down traps arriving as Zabbix items

What it is, in one line

SNMP is a standard protocol for reading values (by numeric OID) from network devices and receiving alerts (traps) from them, and Zabbix uses it to monitor devices where no agent can be installed.

In Simple Words

The railway enquiry counter

At a big station like Bhubaneswar, you don’t walk into the control room to ask about your train. You go to the enquiry counter and give the train number, and the clerk reads out the platform and the delay from his board. Every train has a fixed number, so anyone can ask the same way.

Sometimes the station doesn’t wait for you to ask: the loudspeaker announces “Train 12801 is cancelled” to everyone at once.

The OID is the train number, an SNMP get is your question at the counter, and a trap is that loudspeaker announcement.

Engineer's View

OIDs, MIBs, communities and versions

Every value on an SNMP device has an OID, a dotted number in a global tree, for example 1.3.6.1.2.1.1.5.0 for the system name. A MIB file is the dictionary that maps those numbers to names like SNMPv2-MIB::sysName.0 and says what type and units the value has. Tables, such as the interface table, add an index at the end: IF-MIB::ifHCInOctets.4 is inbound bytes on interface number 4.

The manager (Zabbix) sends GET, GETNEXT or GETBULK requests to UDP port 161 on the device; the device sends traps to UDP port 162 on the manager. SNMPv2c protects access with a plain-text community string, which works like a shared password sent in clear. SNMPv3 adds users with authentication (SHA family) and encryption (AES), and is what you should use on anything outside a lab.

Itemv2cv3 (authPriv)
IdentityCommunity string (labro)User name (zbxv3)
AuthenticationNone, community sent in clearSHA, SHA-256 and others with a passphrase
EncryptionNoneAES (128, 192, 256) with a privacy passphrase
Typical errorsTimeout (wrong community or ACL)Unknown user name, Authentication failure
In ZabbixInterface SNMP version 2, community {$SNMP_COMMUNITY}Security name, level, protocols and passphrases on the interface

In Zabbix 7.0 and 8.0 the recommended pattern is one SNMP agent item with walk[OID1,OID2,...] that fetches whole subtrees in bulk, plus dependent items that pick values out with the “SNMP walk value” preprocessing step and low-level discovery that uses “SNMP walk to JSON”. The old one-item-per-OID style still works with get[OID] or a plain OID, but costs one request per item; all the shipped “by SNMP” templates now use walk[].

How it works, step by step

1Zabbix asks, the device answers

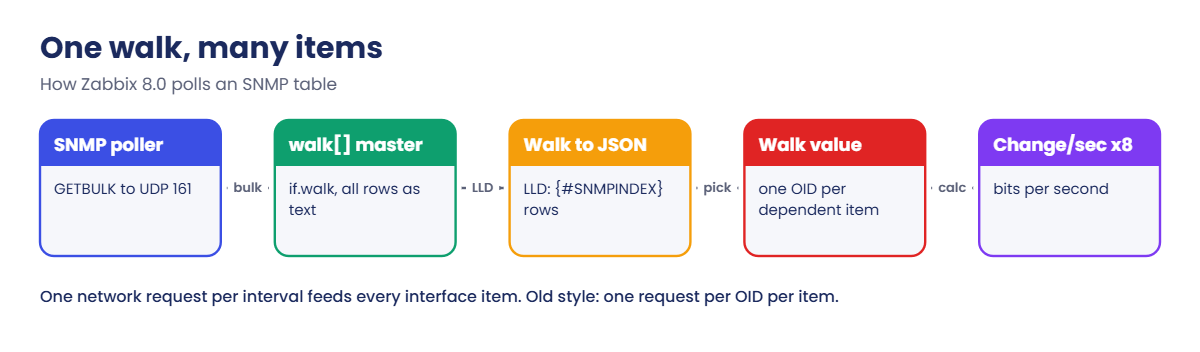
An SNMP poller on the server (or proxy) reads the host’s SNMP interface (IP, port 161, version and credentials) and sends a request for each due item. For walk[] it uses GETBULK, fetching many rows per packet up to the interface’s “Max repetition count” (10 by default). The answer is plain text, one OID = TYPE: value line per row.

2Dependent items split the walk

The walk result becomes the value of the master item, and each dependent item runs “SNMP walk value” with one OID to pull out its number, then any usual steps like “Change per second” and a multiplier of 8 for bits. One network round trip feeds dozens of items. The diagram below follows this path.

Zabbix SNMP monitoring with walk[] master item, SNMP walk to JSON discovery and dependent items

3Discovery finds interfaces and devices

Two different “discoveries” exist. Low-level discovery on a host turns the walk into JSON rows like {"{#SNMPINDEX}":"4","{#IFDESCR}":"eth0"} and creates items per interface from prototypes. Network discovery (Data collection > Discovery) scans an IP range for devices that answer an SNMP OID, and a discovery action can create the host and link a template.

4Traps arrive without asking

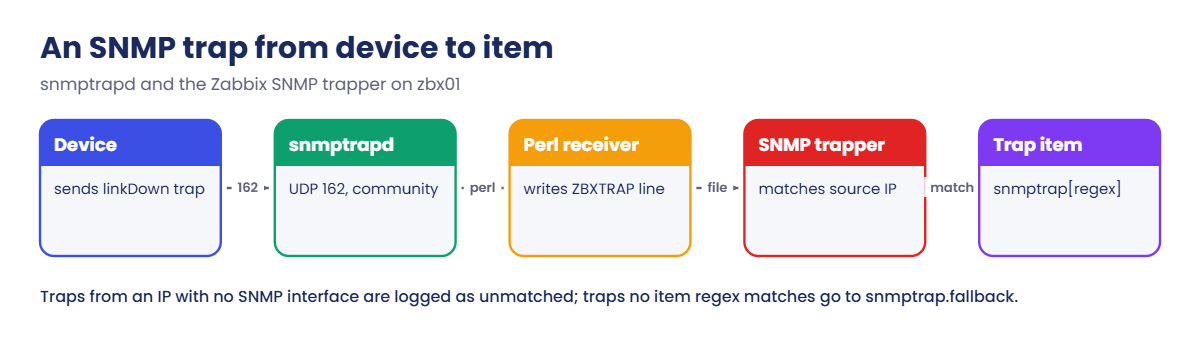
For traps, snmptrapd on zbx01 listens on UDP 162 and passes each trap to Zabbix’s zabbix_trap_receiver.pl Perl handler, which appends it to a file. The server’s SNMP trapper process reads that file, matches the source IP to a host’s SNMP interface, and puts the trap text into items of type “SNMP trap” by regular expression, for example snmptrap["IF-MIB::linkDown"]. Unmatched traps go to snmptrap.fallback.

The second diagram shows both directions.

Zabbix SNMP monitoring of traps: device, snmptrapd, Perl receiver, SNMP trapper and trap item

5Choosing between polling and traps

Polling tells you the current state on a schedule and catches a device that dies silently. Traps tell you about an event the moment it happens, but UDP can lose them and a dead device sends nothing. At work you use both: poll interface status and counters, and use traps for instant link-down, power and fan events, with a trigger on nodata() on a poll item to catch silence.

Key or stepExampleUse
get[OID]get[1.3.6.1.2.1.1.5.0]One scalar value
walk[OID,…]walk[1.3.6.1.2.1.2.2.1.2,1.3.6.1.2.1.31.1.1.1.6]Many table columns in one bulk request (8.0 style)
SNMP walk value1.3.6.1.2.1.31.1.1.1.6.{#SNMPINDEX}Dependent item picks one row
SNMP walk to JSON{#IFDESCR} = 1.3.6.1.2.1.2.2.1.2LLD rule turns columns into JSON rows
snmptrap[regex]snmptrap[“IF-MIB::linkDown”]Trap items matched by text
snmptrap.fallback(no key parameters)Traps that no other trap item matched

Hands-on lab: web01 as an SNMP device with v3, walk[], discovery and traps

Before you run any command, double-check it

Read every command twice before you press Enter. Check the target: the server name, the user, the disk or device name, the path and the sizes. These commands are for learning and were tested in our lab, not on your system. At work, run the read-only commands first, follow your change process, make sure a backup exists, and ask a second person to check anything that changes or deletes data. You run them at your own risk.

web01 (192.168.56.81) will run snmpd as the “device”, and zbx01 (192.168.56.80) will poll it and receive traps. If web01 is behind remote-proxy from Lesson 19, that’s fine: you’ll create a separate host web01-snmp monitored by the server, so SNMP traffic goes straight from zbx01. The outputs below were captured from net-snmp 5.9.4 and a Zabbix 8.0.0 server; interface names and counters on your VM will differ.

1Install and configure snmpd on web01

Paste this whole block on web01:

sudo apt install -y snmpd
sudo cp /etc/snmp/snmpd.conf /etc/snmp/snmpd.conf.orig
sudo systemctl stop snmpd
sudo tee /etc/snmp/snmpd.conf >/dev/null <<'EOF'
sysLocation    Bhubaneswar lab rack 2
sysContact     noc@lab.local
sysServices    72
agentaddress   udp:161
view   labview    included   .1.3.6.1.2.1
view   labview    included   .1.3.6.1.4.1.2021
rocommunity  labro  192.168.56.80  -V labview
rocommunity  labro  192.168.56.82  -V labview
includeDir /etc/snmp/snmpd.conf.d
EOF
sudo net-snmp-create-v3-user -ro -a SHA -A 'Snmp@Auth2026' -x AES -X 'Snmp@Priv2026' zbxv3
sudo sed -i 's/^rouser zbxv3$/rouser zbxv3 authpriv -V labview/' /etc/snmp/snmpd.conf
sudo systemctl start snmpd
sudo ufw allow from 192.168.56.80 to any port 161 proto udp
sudo ss -ulnp | grep ':161 '

You should see this (your PID will differ):

adding the following line to /var/lib/snmp/snmpd.conf:
   createUser zbxv3 SHA "Snmp@Auth2026" AES "Snmp@Priv2026"
adding the following line to /etc/snmp/snmpd.conf:
   rouser zbxv3
Rule added
UNCONN 0  0   0.0.0.0:161   0.0.0.0:*   users:(("snmpd",pid=2741,fd=6))

The community labro is read-only and accepted only from zbx01 and zbxprx01, and the view limits what it can see to MIB-2 and the UCD (Net-SNMP) tree. net-snmp-create-v3-user must run while snmpd is stopped: it writes a createUser line to /var/lib/snmp/snmpd.conf, which snmpd turns into a hashed key on its next start, and appends rouser zbxv3 to the main config. The sed line after it requires authPriv and limits the v3 user to the same view as the community. These passwords are for the lab only.

✅ Checkpoint: ss on web01 shows snmpd listening on UDP 0.0.0.0:161 and ufw allows 161/udp from 192.168.56.80.

2Install net-snmp tools and MIBs on zbx01

Run this on zbx01:

sudo apt install -y snmp snmp-mibs-downloader
sudo sed -i 's/^mibs :/# mibs :/' /etc/snmp/snmp.conf
snmpget -v2c -c labro 192.168.56.81 sysName.0 sysLocation.0 sysUpTime.0

You should see this (your uptime will differ):

SNMPv2-MIB::sysName.0 = STRING: web01
SNMPv2-MIB::sysLocation.0 = STRING: Bhubaneswar lab rack 2
DISMAN-EVENT-MIB::sysUpTimeInstance = Timeticks: (99244) 0:16:32.44

Ubuntu ships /etc/snmp/snmp.conf with mibs :, which disables MIB loading for licence reasons. Commenting it out after installing snmp-mibs-downloader lets the tools show names like sysName.0 instead of iso.3.6.1.2.1.1.5.0. Zabbix doesn’t need this, because it works with numeric OIDs.

✅ Checkpoint: snmpget from zbx01 returns sysName, sysLocation and sysUpTime of web01 with MIB names.

3Walk the interface table and find numeric OIDs

Run this on zbx01:

snmpwalk -v2c -c labro 192.168.56.81 IF-MIB::ifDescr
snmpwalk -v2c -c labro 192.168.56.81 IF-MIB::ifOperStatus
snmptranslate -On IF-MIB::ifHCInOctets

You should see:

IF-MIB::ifDescr.1 = STRING: lo
IF-MIB::ifDescr.2 = STRING: enp0s3
IF-MIB::ifDescr.3 = STRING: enp0s8
IF-MIB::ifOperStatus.1 = INTEGER: up(1)
IF-MIB::ifOperStatus.2 = INTEGER: up(1)
IF-MIB::ifOperStatus.3 = INTEGER: up(1)
.1.3.6.1.2.1.31.1.1.1.6

The number after the last dot is the interface index ({#SNMPINDEX} in Zabbix). snmptranslate -On turns a MIB name into the numeric OID that you’ll paste into Zabbix, and snmptranslate -Td shows the full MIB definition, including value maps like up(1) and down(2).

✅ Checkpoint: You can list web01’s interfaces with their index numbers and you know that ifHCInOctets is .1.3.6.1.2.1.31.1.1.1.6.

Zabbix SNMP monitoring lab: snmpwalk, snmptranslate and a v2c timeout from zbx01
Terminal output: walking web01 from zbx01 and the timeout you get with a wrong community

4Create the SNMP host with a v3 interface

In Data collection > Hosts click Create host: Host name web01-snmp, host group Lab/Network (type a new name to create it), Monitored by Server. Under Interfaces click Add > SNMP and fill it in:

FieldValue
IP address / Port192.168.56.81 / 161
SNMP versionSNMPv3
Context name(empty)
Security namezbxv3
Security levelauthPriv
Authentication protocol / passphraseSHA1 / Snmp@Auth2026
Privacy protocol / passphraseAES128 / Snmp@Priv2026
Use combined requeststicked
Max repetition count10

Click Add. In real setups put the passphrases in secret macros (for example {$SNMPV3.AUTHPASS} with type Secret text) instead of typing them on each interface.

Zabbix SNMP monitoring: web01-snmp host with an SNMPv3 authPriv interface
The SNMPv3 interface of web01-snmp: security name zbxv3, authPriv, SHA1 and AES128

✅ Checkpoint: Data collection > Hosts lists web01-snmp with an SNMP interface 192.168.56.81:161.

5Add a get item and a walk[] master item

On web01-snmp open Items > Create item twice:

NameTypeKeySNMP OIDType of informationNotes
System uptimeSNMP agentsysUpTimeget[1.3.6.1.2.1.1.3.0]Numeric (unsigned)Units uptime; preprocessing Custom multiplier 0.01
Interface walkSNMP agentif.walkwalk[1.3.6.1.2.1.2.2.1.2,1.3.6.1.2.1.2.2.1.8,1.3.6.1.2.1.31.1.1.1.6]TextHistory 1h, interval 1m

Use Test on the Interface walk item, tick Get value from host and click Get value and test.

The Result field shows this (your counters will differ):

.1.3.6.1.2.1.2.2.1.2.1 = STRING: "lo"
.1.3.6.1.2.1.2.2.1.2.2 = STRING: "enp0s3"
.1.3.6.1.2.1.2.2.1.2.3 = STRING: "enp0s8"
.1.3.6.1.2.1.2.2.1.8.1 = INTEGER: 1
.1.3.6.1.2.1.2.2.1.8.2 = INTEGER: 1
.1.3.6.1.2.1.2.2.1.8.3 = INTEGER: 1
.1.3.6.1.2.1.31.1.1.1.6.1 = Counter64: 775509698
.1.3.6.1.2.1.31.1.1.1.6.2 = Counter64: 48213377
.1.3.6.1.2.1.31.1.1.1.6.3 = Counter64: 1006927706

Zabbix always returns numeric OIDs in walk results, whatever MIBs are installed, so your dependent items never depend on MIB files on the server. sysUpTime counts hundredths of a second, which is why the 0.01 multiplier turns it into seconds for the “uptime” unit.

✅ Checkpoint: Testing the Interface walk item returns ifDescr, ifOperStatus and ifHCInOctets rows for every interface.

6Discover interfaces from the walk

Go to Discovery rules > Create discovery rule: Name Interface discovery, Type Dependent item, Key lab.if.discovery, Master item Interface walk. On the Preprocessing tab add SNMP walk to JSON with two fields: {#IFDESCR} = 1.3.6.1.2.1.2.2.1.2 and {#IFOPERSTATUS} = 1.3.6.1.2.1.2.2.1.8. Click Test on the preprocessing tab with the walk output as input.

You should see:

[{"{#SNMPINDEX}":"2","{#IFDESCR}":"enp0s3","{#IFOPERSTATUS}":"1"},{"{#SNMPINDEX}":"3","{#IFDESCR}":"enp0s8","{#IFOPERSTATUS}":"1"},{"{#SNMPINDEX}":"1","{#IFDESCR}":"lo","{#IFOPERSTATUS}":"1"}]

Zabbix adds {#SNMPINDEX} by itself. Now add an item prototype: Name Interface {#IFDESCR}: bits received, Type Dependent item, Key lab.if.in[{#SNMPINDEX}], Master item Interface walk, Units bps, preprocessing SNMP walk value 1.3.6.1.2.1.31.1.1.1.6.{#SNMPINDEX}, then Change per second, then Custom multiplier 8.

✅ Checkpoint: After a couple of minutes Latest data for web01-snmp shows “Interface enp0s8: bits received” with a bps value.

7Auto-add SNMP devices with network discovery

Go to Data collection > Discovery > Create discovery rule: Name Lab SNMP devices, Discovery by Server, IP range 192.168.56.81-82, Update interval 5m. Add a check: Check type SNMPv2 agent, Port range 161, SNMP community labro, SNMP OID 1.3.6.1.2.1.1.5.0. Set Host name to the value of that SNMP check, and keep the rule Enabled.

Then in Alerts > Actions > Discovery actions create Add lab SNMP devices with conditions Discovery rule equals Lab SNMP devices, Discovery status equals Up and Service type equals SNMPv2 agent, and operations Add host, Add to host groups Lab/Network and Link templates Linux by SNMP. After the next scan open Monitoring > Discovery.
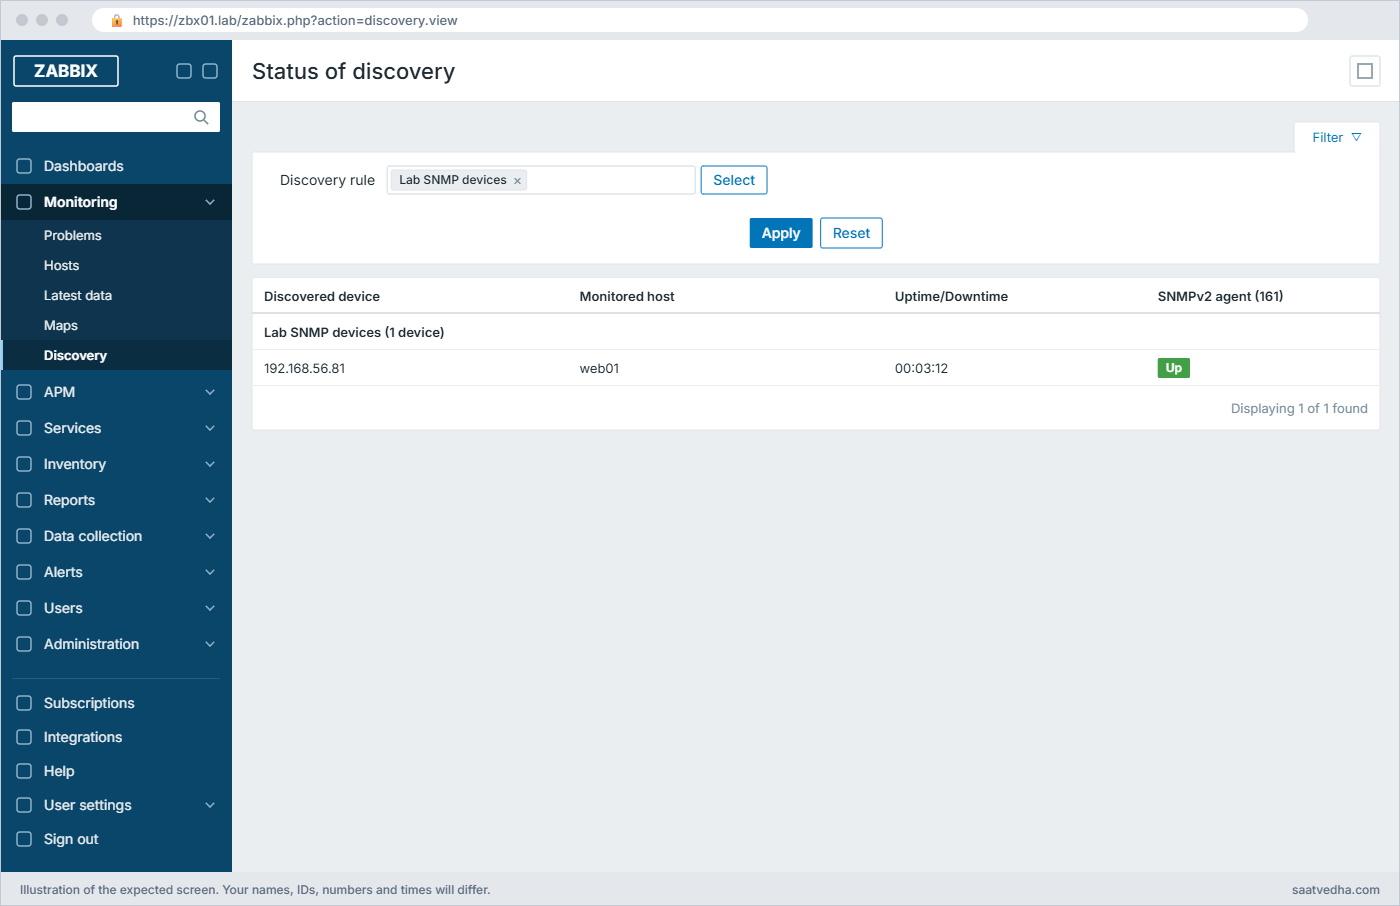
Zabbix SNMP monitoring: Monitoring > Discovery shows 192.168.56.81 Up for SNMPv2 agent” class=”wp-image-10118″ width=”1400″ height=”906″ style=”width:100%;height:auto;border-radius:10px;” /><figcaption style=Monitoring > Discovery after the first scan: web01 is Up for the SNMPv2 agent check

Pick the uniqueness and host name settings carefully: if a device already exists as a host with the same name, the action fails to add a second one, and linking a template that clashes with templates already on the host fails with a “cannot link template” message in the server log.

✅ Checkpoint: Monitoring > Discovery shows 192.168.56.81 Up for the SNMPv2 agent check.

8Receive SNMP traps on zbx01

Install snmptrapd and the Perl module, copy Zabbix’s trap receiver script, and tell both sides about the trap file.

Paste this whole block on zbx01:

sudo apt install -y snmptrapd libsnmp-perl
wget -q https://raw.githubusercontent.com/zabbix/zabbix/release/8.0/misc/snmptrap/zabbix_trap_receiver.pl
sudo install -m 755 zabbix_trap_receiver.pl /usr/local/bin/zabbix_trap_receiver.pl
sudo sed -i "s#^\$SNMPTrapperFile = .*#\$SNMPTrapperFile = '/var/log/zabbix/snmptraps.log';#" /usr/local/bin/zabbix_trap_receiver.pl
sudo tee /etc/snmp/snmptrapd.conf >/dev/null <<'EOF'
authCommunity execute labtrap
perl do "/usr/local/bin/zabbix_trap_receiver.pl";
EOF
sudo tee -a /etc/zabbix/zabbix_server.conf >/dev/null <<'EOF'
StartSNMPTrapper=1
SNMPTrapperFile=/var/log/zabbix/snmptraps.log
EOF
sudo systemctl restart snmptrapd zabbix-server
sudo ufw allow from 192.168.56.0/24 to any port 162 proto udp

On web01-snmp add two items of type SNMP trap: snmptrap["IF-MIB::linkDown"] (Log) and snmptrap.fallback (Log). Then send a test trap from web01, which has the snmp package from step 1 (install it with sudo apt install -y snmp if not).

Run this on web01:

snmptrap -v2c -c labtrap 192.168.56.80 '' 1.3.6.1.6.3.1.1.5.3 1.3.6.1.2.1.2.2.1.1.2 i 2 1.3.6.1.2.1.2.2.1.8.2 i 2

Latest data for the item snmptrap[“IF-MIB::linkDown”] shows this (your times, port and uptime will differ):

2026-11-08T12:35:44+0530 PDU INFO:
  version                        1
  community                      labtrap
  notificationtype               TRAP
  receivedfrom                   UDP: [192.168.56.81]:49724->[192.168.56.80]:162
VARBINDS:
  DISMAN-EVENT-MIB::sysUpTimeInstance type=67 value=Timeticks: (780079) 2:10:00.79
  SNMPv2-MIB::snmpTrapOID.0      type=6  value=OID: IF-MIB::linkDown
  IF-MIB::ifIndex.2              type=2  value=INTEGER: 2
  IF-MIB::ifOperStatus.2         type=2  value=INTEGER: 2

1.3.6.1.6.3.1.1.5.3 is the standard linkDown trap. The receiver script writes a ZBXTRAP header with the source address, and the SNMP trapper matched it to web01-snmp because the interface IP is 192.168.56.81. A trigger like nodata(/web01-snmp/snmptrap["IF-MIB::linkDown"],5m)=0 turns each trap into a problem for five minutes.

✅ Checkpoint: Latest data for web01-snmp shows the linkDown trap text in snmptrap[“IF-MIB::linkDown”].

Break It, Then Fix It

Three SNMP failures you’ll see on real devices. All are safe; undo each one before the next.

1Timeout while connecting (wrong community or ACL)

Create a test host web01-v2c with an SNMPv2 interface to 192.168.56.81 and community labrw (a typo for labro), plus one item get[1.3.6.1.2.1.1.5.0]. From zbx01 try the same with snmpget.

Run this on zbx01:

snmpget -v2c -c labrw -t 1 -r 1 192.168.56.81 1.3.6.1.2.1.1.5.0

You’ll get this error:

Timeout: No Response from 192.168.56.81.

And on the host’s SNMP interface in the frontend (hover the red SNMP icon):

cannot retrieve OID: '.1.3.6.1.2.1.1.5.0' from [[192.168.56.81]:161]: timed out

A v2c agent silently drops requests with a wrong community, so you get a timeout, not “access denied”. The same symptom comes from a ufw block, snmpd listening only on 127.0.0.1, or the request coming from an IP that isn’t in the rocommunity line (for example the proxy when you forgot the 192.168.56.82 line). The server log shows SNMP agent item ... failed: first network error and then temporarily disabling SNMP agent checks on host ...: interface unavailable.

Fix:

Correct the community on the interface (or the {$SNMP_COMMUNITY} macro) to labro,
then on the host list click the SNMP icon and wait up to a minute for the interface to recover.

✅ Checkpoint: The test host’s SNMP icon turns green and System name shows web01.

2No Such Object (wrong OID)

Add an item on web01-snmp with SNMP OID get[1.3.6.1.2.1.1.99.0], a branch that doesn’t exist, and another with get[1.3.6.1.2.1.1.5.1] (right object, wrong index). Check them on zbx01 too.

Run this on zbx01:

snmpget -v2c -c labro 192.168.56.81 1.3.6.1.2.1.1.99.0 1.3.6.1.2.1.1.5.1

You’ll get this:

iso.3.6.1.2.1.1.99.0 = No Such Object available on this agent at this OID
iso.3.6.1.2.1.1.5.1 = No Such Instance currently exists at this OID

And the Zabbix item becomes Not supported with:

cannot get SNMP result: No Such Object available on this agent at this OID

“No Such Object” means the agent doesn’t have that object at all (wrong OID, or the view hides it); “No Such Instance” means the object exists but not that index, which is classic when someone hard-codes ifIndex 3 and the device renumbers its ports after a reboot. Only the item becomes unsupported, the interface stays green.

Fix:

Find the right OID with snmpwalk/snmptranslate, or use walk[] + LLD
so the index comes from {#SNMPINDEX} instead of being typed by hand.

✅ Checkpoint: You deleted or corrected the two test items and no item on web01-snmp is Not supported.

3SNMPv3 “Unknown user name” and authentication failure

Edit the web01-snmp interface and change Security name to zbxv4, update, and wait a minute. Then put the name back and change the authentication passphrase to Wrong@Auth2026.

You’ll get these errors on the SNMP interface:

Cannot connect to "192.168.56.81:161": Unknown user name.
Cannot connect to "192.168.56.81:161": Authentication failure (incorrect password, community or key).

The same with net-snmp on zbx01:

snmpget -v3 -l authPriv -u zbxv4 -a SHA -A 'Snmp@Auth2026' -x AES -X 'Snmp@Priv2026' 192.168.56.81 sysName.0
snmpget -v3 -l authPriv -u zbxv3 -a SHA -A 'Wrong@Auth2026' -x AES -X 'Snmp@Priv2026' 192.168.56.81 sysName.0
snmpget: Unknown user name
snmpget: Authentication failure (incorrect password, community or key)

Unlike v2c, v3 answers with a report, so you get a clear reason. A wrong authentication protocol (MD5 instead of SHA) also gives “Authentication failure”. A wrong privacy passphrase or protocol is nastier: the device can’t decrypt the request and you get a plain timeout, so if auth looks right and you still time out, check the privacy settings.

Fix:

Security name zbxv3, SHA1 / Snmp@Auth2026, AES128 / Snmp@Priv2026 on the interface.
If you changed the user on the device, run net-snmp-create-v3-user again with snmpd stopped.

✅ Checkpoint: web01-snmp’s SNMP interface is green again and System uptime updates.

This happened at work

The OLTs that went quiet on Friday nights

An engineer I trained later worked at a regional ISP in Bhubaneswar, where Zabbix polled about 300 OLTs and aggregation switches over SNMP. Every Friday night, during the busiest hours, around forty devices showed “SNMP interface unavailable” for ten to fifteen minutes and then recovered by themselves, which made the NOC chase ghosts.

The first guess was the network, so they raised the SNMP timeout from 3 to 10 seconds. That made it worse: the SNMP pollers were now busy waiting, the queue grew, and more devices looked unavailable. Someone then noticed that the old templates had one item per OID, about 180 items per OLT, each its own SNMP request every minute.

The real cause was the devices’ small SNMP agents choking under that request rate when their CPUs were busy with subscriber traffic. The team rebuilt the templates the 8.0 way: one walk[] master item per table and dependent items, and moved slowly changing values like serial numbers to a one-hour interval.

Requests per device dropped from about 180 a minute to under 10, the Friday “outages” stopped, and they added traps for link-down so the NOC heard about real fibre cuts within seconds.

Common mistakes and troubleshooting

MistakeWhat happensWhat to do instead
Using community public or a read-write communityAnyone on the network can read, or even change, device settingsUse a unique read-only community limited by source IP, or SNMPv3 authPriv
One item per OID on big devicesThousands of requests, overloaded device agents and pollers, false unavailabilityUse walk[] master items with dependent items and LLD
Hard-coding interface indexesItems break or show the wrong port after a reboot or line-card changeDiscover interfaces with SNMP walk to JSON and {#SNMPINDEX}
Expecting a clear error for a wrong v2c communityYou only get a timeout and waste time on the networkTest with snmpget from the server first; timeout with SNMP means check community and ACL
Forgetting UDP 162 and the trap source IPTraps are dropped by the firewall or land in no host’s itemsOpen 162/udp and make sure the host’s SNMP interface IP is the trap source
Relying only on trapsA dead device sends no trap and nobody noticesPoll status too and alert on nodata() of a regular SNMP item
Installing vendor MIBs on the server and using names in itemsItems fail on a server or proxy that lacks the MIBUse numeric OIDs in Zabbix items; keep MIBs for snmptranslate and humans

Interview questions

Click a question to open it. Each one is written the way an interviewer would ask it. Under it you will see why they ask it and one way you could answer, in your own words.

Fresher level

1. What is an OID and what is a MIB?

Why they ask this: They want the basic SNMP vocabulary.

How you might answer: An OID is a numeric address of one value in the SNMP tree, like 1.3.6.1.2.1.1.5.0 for the system name. A MIB is the text file that names those OIDs, gives their type and describes them, so 1.3.6.1.2.1.1.5.0 becomes SNMPv2-MIB::sysName.0.

Zabbix works with numeric OIDs, and I use the MIB with snmptranslate to find the right number.

2. What is the difference between SNMP v2c and v3?

Why they ask this: A security basics check.

How you might answer: v2c uses a community string sent in clear text, so anyone sniffing the network can read it, and a wrong community just gives a timeout. v3 uses users with authentication, like SHA, and encryption, like AES, and returns clear errors such as Unknown user name.

In production I use v3 authPriv wherever the device supports it, and for v2c I at least use a read-only community limited to the Zabbix server and proxy IPs.

2–5 years experience

3. Walk me through monitoring all interfaces on a new 48-port switch in Zabbix 8.0.

Why they ask this: They want to hear walk[], LLD and dependent items, not 200 manual items.

How you might answer: I add the host with an SNMP interface and link the vendor template or a generic “Network Generic Device by SNMP” type template. Those use one walk[] master item for the interface table, and a discovery rule with SNMP walk to JSON that creates per-port items through SNMP walk value, change per second and a multiplier of 8 for bits.

I check the discovered ports in Latest data, filter out unused or virtual interfaces with LLD filters or overrides on {#IFOPERSTATUS} or {#IFALIAS}, and add traps for link down.

4. An SNMP host shows “timed out” in Zabbix but the device team says SNMP is enabled. How do you troubleshoot?

Why they ask this: A practical check of the troubleshooting order.

How you might answer: I run snmpget from the Zabbix server or proxy that polls the host, with the same version, community or v3 credentials. A timeout with v2c usually means wrong community, an ACL on the device that doesn’t include our IP, or a firewall; with v3 a timeout can also mean a wrong privacy passphrase.

I also check which machine polls it, server or proxy, because the device ACL must allow that IP, and I look at the server log for “temporarily disabling SNMP agent checks”.

Senior level

5. How would you design SNMP trap handling for a network of 2,000 devices?

Why they ask this: They want scale, reliability and noise thinking.

How you might answer: I’d run snmptrapd with the Zabbix receiver on the proxies closest to the devices, so traps travel a short distance, and point devices at their regional proxy. Each device’s SNMP interface IP must match the trap source, so I standardise on management loopbacks.

Templates have specific snmptrap[] items for the important traps like linkDown, power and fan with triggers, and a fallback item for everything else that I review weekly. I also log-rotate the trap file and alert on nodata of polled items so I don’t rely on UDP traps alone.

6. Polling a device makes its CPU spike. What can you change on the Zabbix side?

Why they ask this: They are checking knowledge of bulk, walk[] and intervals.

How you might answer: First I check how many SNMP requests we send: moving from one item per OID to walk[] with dependent items cuts it the most. I keep “Use combined requests” on and tune Max repetition count, which controls how many rows each GETBULK returns.

Then I lengthen intervals for slow-changing values like serial numbers and descriptions, disable unneeded discovered ports, and if needed spread devices across proxies so polling isn’t bursty.

Quick quiz

Q1. Which UDP port does an SNMP device normally listen on for get requests?

  1. 162
  2. 161
  3. 10050
  4. 514
Show answer

B — Agents answer gets on 161; traps go to 162 on the manager.

Q2. What does the Zabbix key walk[1.3.6.1.2.1.2.2.1.2,1.3.6.1.2.1.31.1.1.1.6] do?

  1. Gets one value
  2. Fetches both subtrees in bulk into one text value
  3. Sends a trap
  4. Discovers devices on the network
Show answer

B — walk[] returns all rows of the listed OIDs, which dependent items then split.

Q3. snmpget with a wrong v2c community usually returns:

  1. Unknown user name
  2. Authentication failure
  3. Timeout: No Response
  4. No Such Object
Show answer

C — v2c agents silently drop requests with an unknown community.

Q4. What does “No Such Instance currently exists at this OID” mean?

  1. The device is down
  2. The object exists but not with that index
  3. SNMP is disabled
  4. The community is wrong
Show answer

B — The object is known, but there is no row with that index.

Q5. Which Zabbix process reads traps written by zabbix_trap_receiver.pl?

  1. Poller
  2. SNMP trapper
  3. Trapper
  4. Alerter
Show answer

B — StartSNMPTrapper=1 enables the SNMP trapper, which reads SNMPTrapperFile.

Quick recap

  • SNMP reads values by OID (MIBs give them names) on UDP 161 and sends traps to UDP 162; use v3 authPriv where you can.
  • In Zabbix 8.0 use one walk[] master item with dependent items and SNMP walk to JSON discovery instead of one item per OID.
  • Test from the polling server or proxy with snmpget/snmpwalk before blaming Zabbix: a v2c timeout usually means community or ACL.
  • Network discovery with an SNMP check plus a discovery action can add devices and link templates automatically.
  • Traps flow snmptrapd, zabbix_trap_receiver.pl, SNMPTrapperFile, SNMP trapper, then snmptrap[] items on the host whose SNMP interface IP matches.

Next lesson

Lesson 21: Database monitoring: MySQL and PostgreSQL → You monitor MySQL and PostgreSQL on web01 with agent 2 plugins, a least-privilege monitoring user and the official templates.

Further reading: Zabbix SNMP monitoring

Want to go deeper into Zabbix SNMP monitoring? The Zabbix manual covers SNMP agent items, SNMP traps and network discovery. The Net-SNMP snmpd.conf manual explains views and v3 users.

Dependent items and preprocessing were introduced in Lesson 11 and LLD in Lesson 15. You can also see the full plan for this course on the Zabbix Monitoring course page.

Scroll to Top

This website uses cookies

We use a few cookies to keep this site working. If you allow it, we also use Google Analytics to count visits so we can improve our lessons. You can accept all, deny the optional ones, or choose what to allow.