Zabbix preprocessing: regex, JSONPath, JavaScript and dependent items

Zabbix preprocessing is the small factory between “value received” and “value stored”, where raw text is cut, cleaned, converted and checked before it lands in history. Without it you’d write a shell script for every odd format; with it, one HTTP request to Nginx can become seven tidy numbers, a growing counter becomes requests per second, and a JSON reply gives up only the field you care about.

In this lesson you add a master item to the SaatVedha Nginx web template that fetches the Nginx stub_status page once, then build dependent items that pull numbers out of it with regular expressions, JavaScript and JSONPath. You’ll test every step in the frontend before saving, and then break preprocessing three ways that look scary in the item list and are easy to fix once you can read the message.

Where this lesson fits

Lesson 11 of 24 in Zabbix Monitoring · Phase 2: Items, triggers, templates and dashboards · Before this: Lesson 10, templates · Next: Lesson 12, web monitoring

TimeYou needBy the end you can
About 80 minuteszbx01 and web01 from Lessons 1 to 10, the template SaatVedha Nginx web linked to web01, the frontend at https://zbx01.labDesign a master item with dependent items, choose the right preprocessing step for a job, and read preprocessing errors without guessing

What it is, in one line

Zabbix preprocessing is an ordered list of steps (regex, JSONPath, JavaScript, multiplier, change per second, throttling, validation and more) that the server or proxy runs on each value before storing it.

In Simple Words

The sabzi mandi sorting table

Picture a vegetable wholesaler at a mandi in Pune. A truck dumps one big sack of mixed vegetables on the sorting table; one worker pulls out the onions, the next picks out tomatoes, another weighs the potatoes and writes the number down, and anything rotten goes straight into the bin.

The truck came only once, but five different crates leave the table, each clean and labelled.

The truck is the master item, the crates are the dependent items, and the workers at the table are the preprocessing steps.

Engineer's View

Where preprocessing runs and what it can do

Preprocessing runs in the preprocessing manager and workers of the Zabbix server, or of the proxy if the host is monitored by one, never on the agent. Steps run top to bottom, the output of one is the input of the next, and the final result must fit the item’s Type of information (Numeric unsigned, Numeric float, Character, Log, Text, Binary, or the new JSON type in 8.0). If a step fails, the item becomes Not supported with the step’s error, unless that step’s Custom on fail says Discard value, Set value to, or Set error to.

Group in the step listStepsTypical use
TextRegular expression, Replace, Trim, Right trim, Left trimPull a number out of a status page or log line
Structured dataJSONPath, XML XPath, CSV to JSON, XML to JSONTake one field from an API reply
Arithmetic and ChangeCustom multiplier, Simple change, Change per secondKB to bytes, counters to rates
Numeral systemsBoolean to decimal, Octal to decimal, Hexadecimal to decimalValues from devices
Custom scriptsJavaScriptAnything the other steps can’t express
ValidationIn range, Matches regular expression, Check for error in JSON, Check for not supported valueReject bad values, turn errors into clear messages
ThrottlingDiscard unchanged, Discard unchanged with heartbeatStore a value only when it changes, plus one every N minutes
PrometheusPrometheus pattern, Prometheus to JSONRead exporter /metrics pages (Lesson 23)

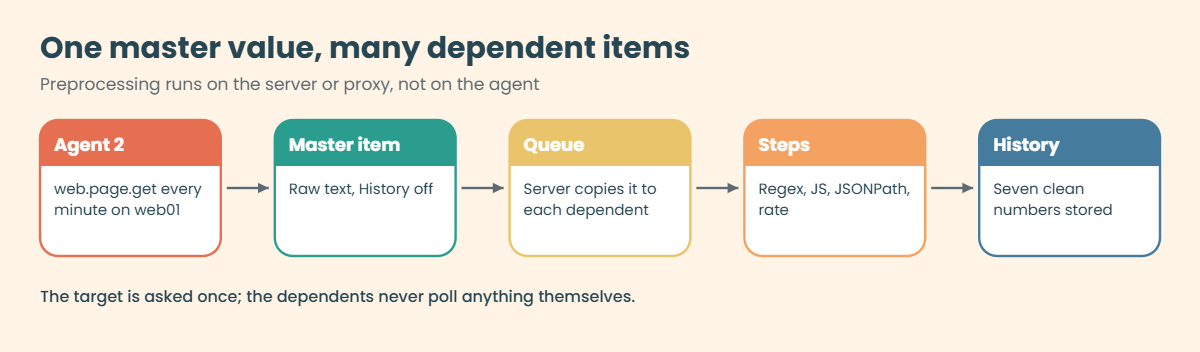
A dependent item has no interval of its own. It gets a copy of its master item‘s value the moment the master receives one, and runs its own preprocessing on that copy. So one HTTP request feeds many items, and the target server is asked once instead of seven times.

In 7.0 LTS the step list is the same apart from the JSON value type, which is new in 8.0.

How it works, step by step

1The master item fetches raw text

Agent 2 on web01 runs web.page.get[localhost,basic_status,80], which returns the HTTP headers plus the stub_status body. This item’s history is set to Do not store because nobody needs the raw page, only the numbers in it.

2Each dependent item gets a copy

When the master value arrives at the server, the preprocessing manager queues it for every dependent item. Each dependent runs its own steps, for example a regular expression with output \1 to take the first number after “Active connections:”. The diagram below follows one value from the agent to seven stored numbers.

Zabbix preprocessing with a master item feeding dependent items on the server

3Counters become rates

Nginx counts requests since it started, so the raw number only grows. Change per second stores (new - old) / (seconds between them); the first value after a restart or item creation has nothing to compare against and is dropped quietly, and so is a value smaller than the previous one (a counter reset). That’s why a new rate item shows nothing for one interval.

4Steps fail, and you decide what happens

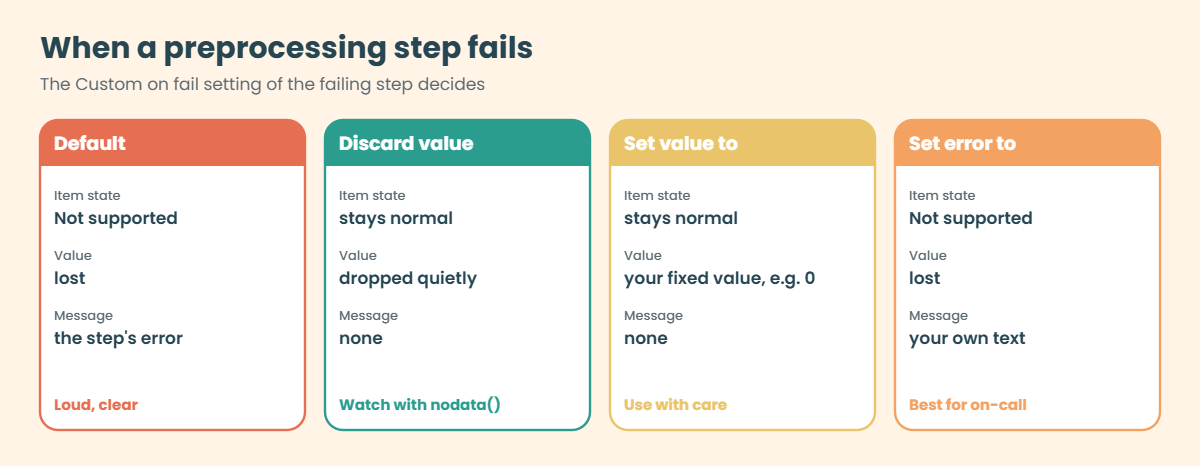
Every step can fail: a regex finds no match, a JSONPath points at a missing field, a script throws. By default the item becomes Not supported with that error and the value is lost. Custom on fail lets you discard quietly, put in a fixed value such as 0, or replace the message with one your on-call team understands.

The second diagram shows the choices.

Zabbix preprocessing Custom on fail options: default, discard value, set value, set error

5Testing before you save

Every item form has a Test button on the Preprocessing tab. You paste a sample value (or, for item types the server polls itself, such as passive agent, HTTP agent or SNMP, press Get value), and Zabbix shows the result of each step one by one. Active agent items can’t be fetched from the frontend because the agent connects to the server, not the other way round, so for them you paste a sample you captured with zabbix_get or curl.

For the JavaScript step there’s also zabbix_js, a command-line tool shipped with the server package, which runs the same Duktape engine the server uses.

If you needUseWhy not the others
One number from textRegular expression with output \1Fast, no script to maintain
One field from JSONJSONPathClear, handles nested objects and arrays
Several fields or mathsJavaScriptRegex can’t add or divide
A rate from a counterChange per secondBuilt in, handles resets
Fewer stored rowsDiscard unchanged with heartbeatStill proves the item is alive

Hands-on lab: turn one Nginx stub_status request into seven items

Before you run any command, double-check it

Read every command twice before you press Enter. Check the target: the server name, the user, the disk or device name, the path and the sizes. These commands are for learning and were tested in our lab, not on your system. At work, run the read-only commands first, follow your change process, make sure a backup exists, and ask a second person to check anything that changes or deletes data. You run them at your own risk.

You’ll add everything to the template SaatVedha Nginx web from Lesson 10, so web01 picks it up automatically. If you skipped Lesson 10, do the same work on web01 directly; only the trigger expressions would name web01 instead of the template. Commands run on web01 or zbx01 as stated.

1Turn on stub_status on web01

Nginx’s stub_status module is built into the Ubuntu package. Add a small location to the default site that only answers local requests.

Run this on web01:

sudo tee /etc/nginx/conf.d/stub_status.conf >/dev/null <<'EOF'
server {
    listen 127.0.0.1:80;
    server_name localhost;
    location = /basic_status {
        stub_status;
        allow 127.0.0.1;
        deny all;
    }
}
EOF
sudo nginx -t && sudo systemctl reload nginx
curl -s http://127.0.0.1/basic_status

You should see this (your counter values will differ):

nginx: the configuration file /etc/nginx/nginx.conf syntax is ok
nginx: configuration file /etc/nginx/nginx.conf test is successful
Active connections: 1
server accepts handled requests
 36 36 34
Reading: 0 Writing: 1 Waiting: 0 

The four lines are what Zabbix will parse. “accepts handled requests” are three counters since Nginx started; Reading, Writing and Waiting are current connection states.

✅ Checkpoint: curl on web01 prints the four stub_status lines.

2Check the master key with zabbix_get

Run this on zbx01 (with the PSK copy from Lesson 7 in /tmp/web01.psk):

zabbix_get -s 192.168.56.81 -k 'web.page.get[localhost,basic_status,80]' --tls-connect psk --tls-psk-identity 'PSK web01' --tls-psk-file /tmp/web01.psk

You should see this (your date and counters will differ):

HTTP/1.1 200 OK
Connection: close
Content-Length: 100
Content-Type: text/plain
Date: Sun, 08 Nov 2026 06:21:31 GMT
Server: nginx/1.28.3 (Ubuntu)

Active connections: 1
server accepts handled requests
 38 38 36
Reading: 0 Writing: 1 Waiting: 0 

That’s the raw value the master item will get: headers, a blank line, then the body. Your regexes must work on this whole text, not only on the four body lines.

The PSK options are needed because web01 accepts only encrypted connections since Lesson 6. If zabbix_get can’t connect, passive checks are blocked; the master item below is active, so you can carry on.

✅ Checkpoint: zabbix_get returns HTTP headers plus the stub_status body.

3Create the master item

Open the template (Data collection > Templates > SaatVedha Nginx web > Items > Create item):

FieldValue
NameNginx: stub_status page
TypeZabbix agent (active)
Keyweb.page.get[localhost,basic_status,{$NGINX.PORT}]
Type of informationText
Update interval1m
HistoryDo not store
Tagscomponent = nginx, component = raw

Press Add. Because history is off, this item will show no value in Latest data; that’s expected, it only feeds the dependents.

✅ Checkpoint: The template has the item “Nginx: stub_status page” with History set to Do not store.

4Add regex dependent items

Click the master item’s name in the item list and choose Create dependent item from the menu, or create items with Type Dependent item and Master item “Nginx: stub_status page”. Make these four:

NameKeyPreprocessing (Regular expression: pattern, output)Extra steps
Nginx: active connectionsnginx.conn.activeActive connections: ([0-9]+) → \1
Nginx: requests totalnginx.requests.totalserver accepts handled requests\s+([0-9]+) ([0-9]+) ([0-9]+) → \3
Nginx: requests per secondnginx.requests.ratesame pattern → \3Change per second; Type of information Numeric (float)
Nginx: connections waitingnginx.conn.waitingReading: ([0-9]+) Writing: ([0-9]+) Waiting: ([0-9]+) → \3

Open Nginx: requests total, go to its Preprocessing tab and press Test. Paste the whole zabbix_get output from step 2 (headers included) into the Value box and press Test.

The Test window lists step 1, Regular expression, with the result 36 next to it, and the final Result is 36: the third number on the counters line of the text you pasted.
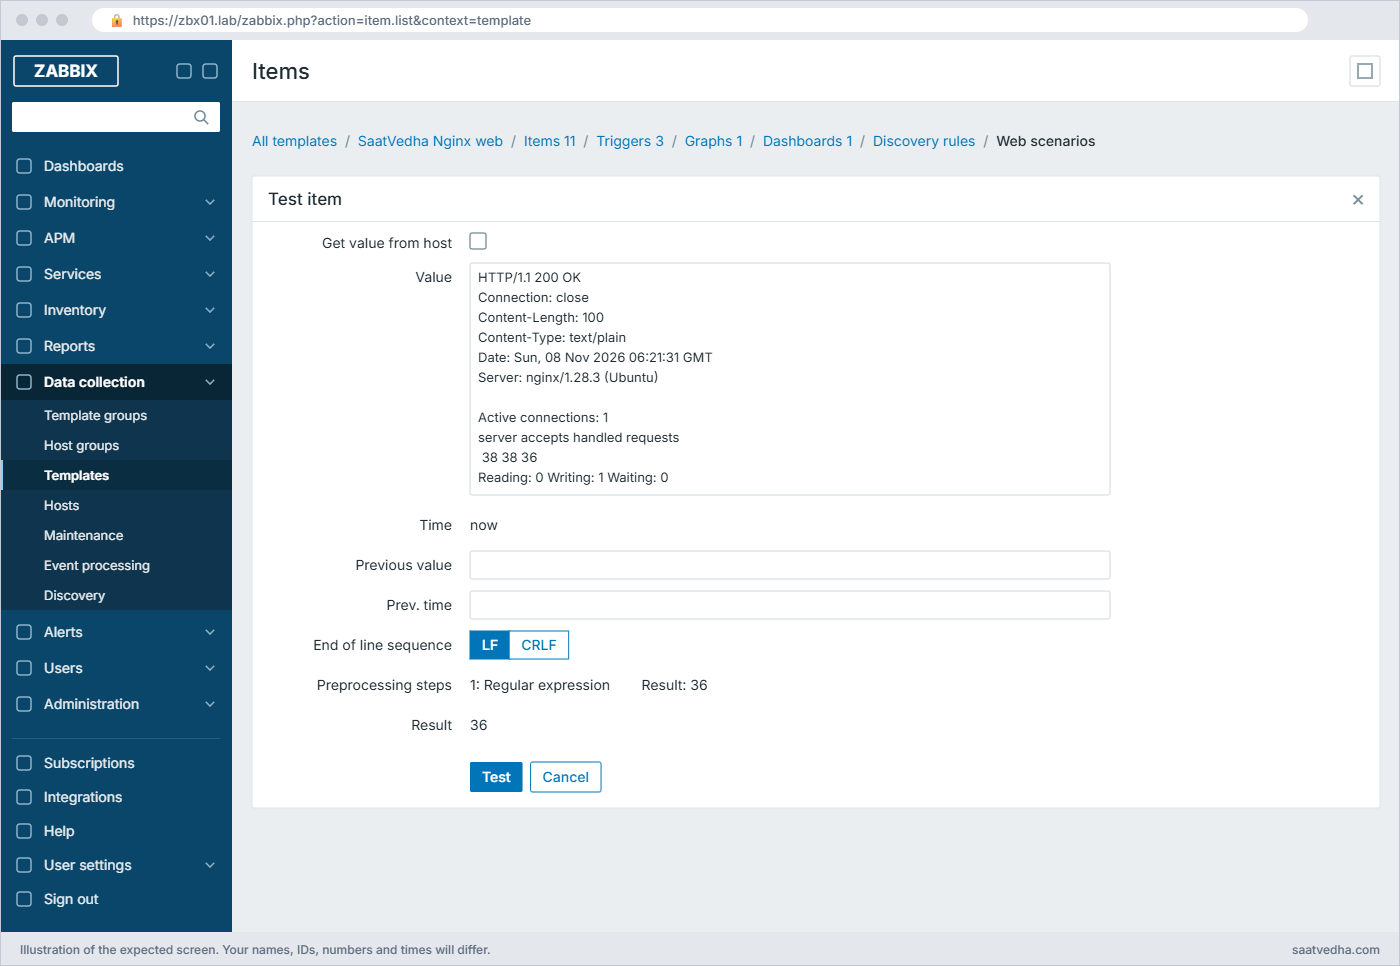
Zabbix preprocessing Test window: a regular expression step returns 36 from pasted stub_status output
The preprocessing Test window for Nginx: requests total

The rate item would show no result in the same test, because Change per second needs a previous value; the test window has Previous value and Prev. time fields if you want to try it by hand. In real collection the second value a minute later gives the first rate.

✅ Checkpoint: Four dependent items exist, and Test shows a number after the regex step.

5Turn the whole page into JSON with JavaScript

A regex per field is fine for four numbers, but the dropped-connections figure needs maths (accepts minus handled). A single JavaScript step can produce all fields as JSON, and later items read them with JSONPath. First test the script on zbx01 with zabbix_js, which comes with the zabbix-server package:

Run this on zbx01:

cat > /tmp/stub.txt <<'EOF'
Active connections: 1
server accepts handled requests
 38 38 36
Reading: 0 Writing: 1 Waiting: 0
EOF
cat > /tmp/stub2json.js <<'EOF'
var m = value.match(/Active connections: (\d+)\s+server accepts handled requests\s+(\d+) (\d+) (\d+)\s+Reading: (\d+) Writing: (\d+) Waiting: (\d+)/);
if (!m) {
    throw 'stub_status format not recognised';
}
return JSON.stringify({
    active: Number(m[1]), accepts: Number(m[2]), handled: Number(m[3]),
    requests: Number(m[4]), reading: Number(m[5]), writing: Number(m[6]),
    waiting: Number(m[7]), dropped: Number(m[2]) - Number(m[3])
});
EOF
zabbix_js -s /tmp/stub2json.js -i /tmp/stub.txt

You should see:

{"active":1,"accepts":38,"handled":38,"requests":36,"reading":0,"writing":1,"waiting":0,"dropped":0}

That’s real output from the Zabbix JavaScript engine. Now create a dependent item Nginx: status JSON, key nginx.status.json, Type of information Text (or JSON in 8.0), History 1d, with one preprocessing step JavaScript and the script body pasted in (everything inside the file, without the cat lines).

✅ Checkpoint: zabbix_js prints one JSON line, and the item Nginx: status JSON exists with a JavaScript step.
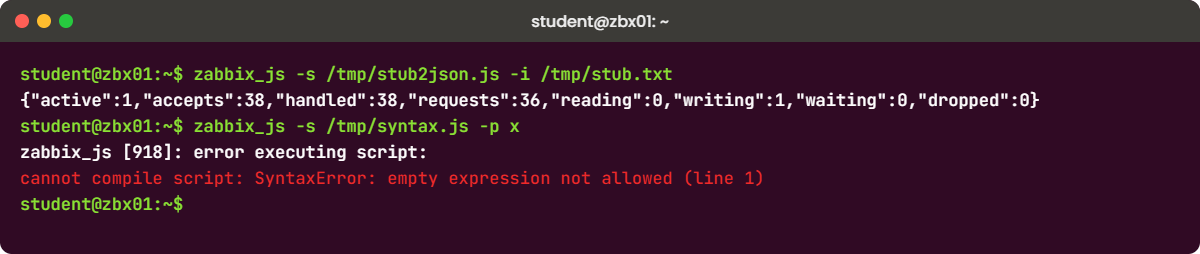
Zabbix preprocessing lab: zabbix_js turning stub_status into JSON and a syntax error
zabbix_js runs the same JavaScript engine as the server, so you can test scripts before saving

6Chain JSONPath items off the JSON item

A dependent item can itself be a master. Create two dependent items whose master is Nginx: status JSON:

NameKeyPreprocessingType of information
Nginx: connections droppednginx.conn.droppedJSONPath $.droppedNumeric (unsigned)
Nginx: connections writingnginx.conn.writingJSONPath $.writingNumeric (unsigned)

Test the first one: paste the JSON line that zabbix_js printed into the Value box and press Test. The input of a dependent item’s test is its own master’s value, here the JSON from Nginx: status JSON.

Step 1, JSONPath $.dropped, shows the result 0, and the final Result is 0.

Add a trigger in the template so dropped connections get noticed: min(/SaatVedha Nginx web/nginx.conn.dropped,5m)>0, name Nginx is dropping connections on {HOST.NAME}, severity Average.

✅ Checkpoint: Nginx: connections dropped and Nginx: connections writing test cleanly with JSONPath.

7Save storage with Discard unchanged with heartbeat

Waiting connections on a quiet lab server stay at 0 for hours, and storing 0 every minute is wasted rows. Open Nginx: connections waiting and add a second step Discard unchanged with heartbeat with parameter 15m.

Now Zabbix stores a value only when it changes, plus one every 15 minutes so nodata() triggers still know the item is alive. Don’t add this to items behind a last() or avg(...,5m) trigger that needs a point every minute.

✅ Checkpoint: Nginx: connections waiting has two steps: Regular expression, then Discard unchanged with heartbeat 15m.

8Load the site and read Latest data

Send some traffic from zbx01 so the counters move:

Run this on zbx01:

for i in $(seq 1 300); do curl -s -o /dev/null http://192.168.56.81/; done; echo done

In Monitoring > Latest data, host web01, tag component = nginx, each dependent item now has a value. Nginx: requests total has gone up by about 300, Nginx: requests per second shows a few requests per second for the minute the loop ran, Nginx: connections dropped stays at 0, and the master item has no value because it stores no history.

Seven items from one request a minute. The rate depends on how fast your loop ran and on where the minute boundaries fell.
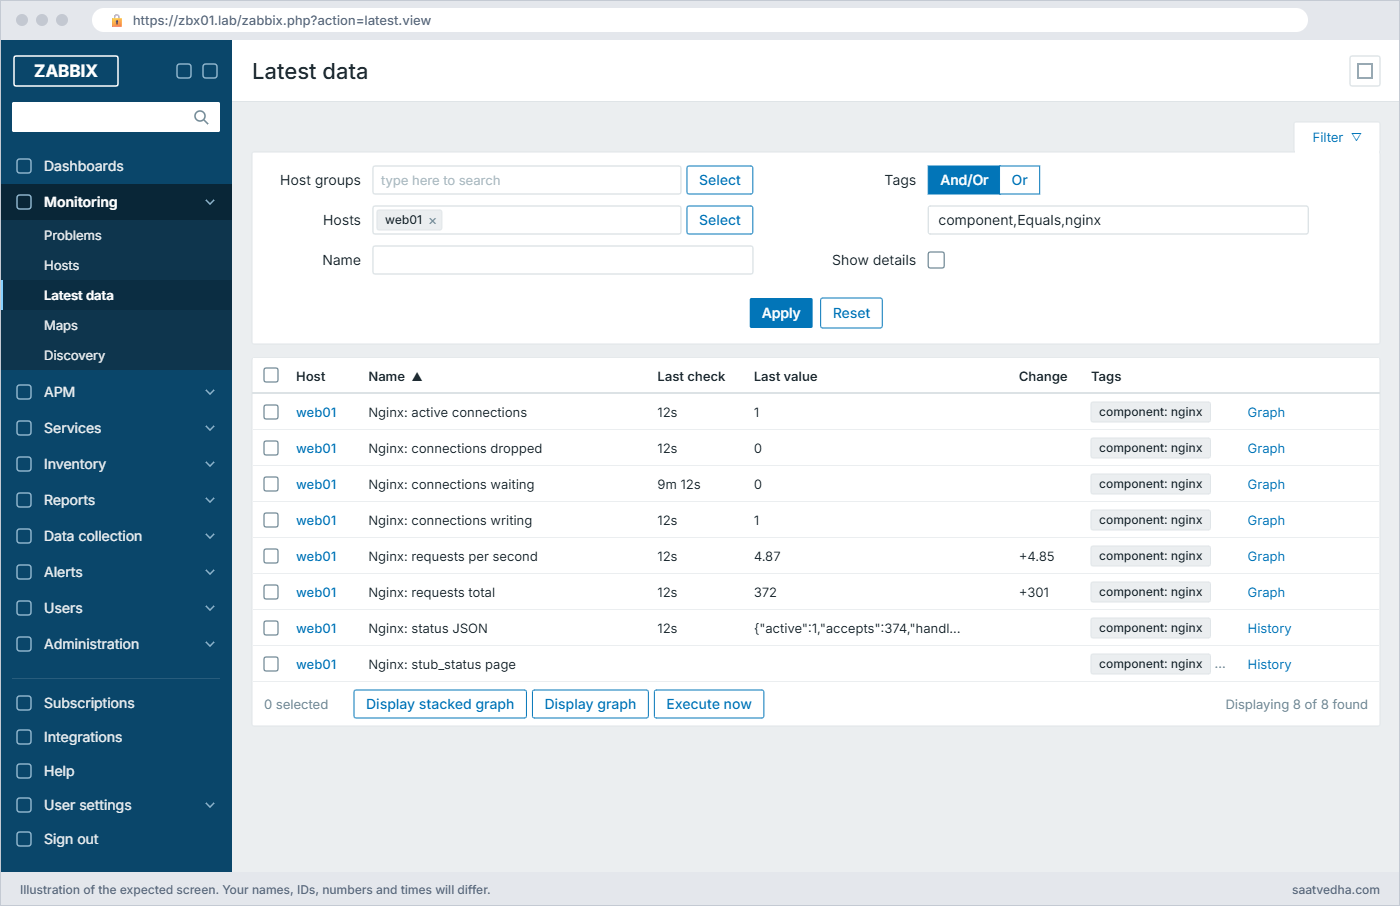
Zabbix preprocessing result in Latest data: seven Nginx dependent items from one stub_status master item
Latest data for web01, tag component = nginx: the dependents have values and the master item has none

✅ Checkpoint: Latest data shows values for the dependent items and the rate went up during the curl loop.

Break It, Then Fix It

Three failures that land in the item list as a red “Not supported” icon. None of them harm the server.

1“cannot perform regular expression … pattern does not match”

Edit Nginx: active connections and change the pattern to Active Connections: ([0-9]+) (capital C). Save, wait a minute for the next value, and hover over the red i next to the dependent item.

You’ll get this error:

cannot perform regular expression "Active Connections: ([0-9]+)" match for value of type "none": pattern does not match

The regular expression step is case sensitive and Nginx writes “Active connections”. The type shows as “none” because Zabbix clears the value before building the message, which confuses people the first time; it has nothing to do with your data type. The same error appears at work after an upgrade changes a status page’s wording, or when a load balancer sends an HTML error page instead of the real one.

Fix:

Put the pattern back to Active connections: ([0-9]+), or make it case-insensitive with (?i)active connections: ([0-9]+). Use the Test button with a real sample from zabbix_get to check the pattern against what the host sends.

✅ Checkpoint: The item shows a number again and the red i is gone.

2JavaScript error in the step

In Nginx: status JSON, change the first line of the script to read var m = value.mtch( (a typo), press Test and paste the four stub_status lines from step 5 as the value.

You’ll get this error:

cannot execute script: TypeError: undefined not callable (property 'mtch' of 'Active connections: 1 \x0aserver ac...')
    at [anon] (duktape.c:69012) internal
    at [anon] (function:1) preventsyield

Strings have no mtch method, so the engine throws at runtime. A missing bracket fails even earlier, at compile time; you can see both kinds with zabbix_js:

Run this on zbx01:

printf 'return value.toUpperCase(;\n' > /tmp/syntax.js
zabbix_js -s /tmp/syntax.js -p x
printf 'return JSON.parse(value).data.status;\n' > /tmp/undef.js
zabbix_js -s /tmp/undef.js -p '{"ok":1}'

You’ll get this:

zabbix_js [918]: error executing script:
cannot compile script: SyntaxError: empty expression not allowed (line 1)
zabbix_js [923]: error executing script:
cannot execute script: TypeError: cannot read property 'status' of undefined
    at [anon] (duktape.c:60534) internal
    at [anon] (function:1) preventsyield

Both outputs are real. Compile errors give a line number; runtime errors such as reading a property of something missing are the ones that surprise you later, when an API changes its reply.

Fix:

Correct the typo and test again. In scripts that read API replies, check fields before using them and throw a clear message, as the stub2json script does with “stub_status format not recognised”, so the item error tells on-call what went wrong.

✅ Checkpoint: Nginx: status JSON tests cleanly and its two JSONPath children show values again.

3Dependent items stuck because the master is not supported

Edit the master item and change the key to web.page.get[localhost,basic_status_x,{$NGINX.PORT}]. Wait a minute, then look at the dependent items.

You’ll get this:

Nginx: stub_status page       (no value; History is off)
Nginx: active connections     cannot perform regular expression "Active connections: ([0-9]+)" match for value of type "none": pattern does not match
Nginx: requests total         ... pattern does not match
Nginx: connections dropped    last value from 1 minute ago, then nothing

web.page.get doesn’t fail on a 404; it returns the 404 page, so the master “succeeds” with the wrong text and every dependent fails with a confusing regex error. If the master fails outright (wrong port, agent down), it goes Not supported and the dependents stop getting values silently, so their graphs freeze at the last value. Either way, the problem is upstream of the item that turned red.

Fix:

Put the key back. To make this obvious next time, give the master its own first preprocessing step Matches regular expression server accepts handled requests with Custom on fail Set error to stub_status page not found, check the Nginx location. Then the master itself goes Not supported with a clear message, and a nodata(/SaatVedha Nginx web/nginx.requests.total,5m)=1 trigger catches the silent case.

✅ Checkpoint: All dependent items update again, and the master has a validation step with a custom error.

This happened at work

The payment success rate that stopped at 99.2%

This one comes from the on-call engineer at a fintech in Pune. Their payment gateway exposed a JSON health endpoint, and Zabbix had one HTTP agent master item with about twenty dependent items: success rate, latency per bank, queue depth and so on. One Thursday evening the business team asked why the success-rate graph had been a flat 99.2% since lunch, when the support desk was full of failed UPI complaints.

The engineer first checked the trigger, which was fine, then the dependent item, which showed no error at all. The value was old. The master item was Not supported with Response code "401" did not match any of the required status codes "200", because a security team had rotated the API token at noon and nobody updated the macro holding it.

Nothing alerted, because every trigger used last() on the dependents, and last() kept returning the lunch-time value. The team added a nodata(...,5m)=1 trigger on the most important dependent, a validation step on the master with a clear error message, and a check on the master’s own state through the internal item zabbix[host,,items_unsupported] for that host.

Common mistakes and troubleshooting

MistakeWhat happensWhat to do instead
Polling the same URL once per fieldSeven requests a minute to Nginx instead of one, and values taken at slightly different timesOne master item, many dependent items
Storing the master item’s raw textLarge text rows fill the history tablesSet History to Do not store (or a short period) on the master
Using Change per second on a gaugeNonsense rates for values that go up and downUse it only on counters that only grow
Regex written against the body onlyNo match, because the master value includes HTTP headersTest against a real sample captured with zabbix_get or curl
Discard unchanged without heartbeatnodata() triggers fire on stable itemsUse Discard unchanged with heartbeat and a sensible period
Triggers using last() on dependent items onlyWhen the master breaks, triggers keep seeing the old valueAdd nodata() triggers and a validation step on the master
Huge JavaScript in one itemHard to read, slow, and errors are vagueKeep scripts short, throw clear messages, and test with zabbix_js

Interview questions

Click a question to open it. Each one is written the way an interviewer would ask it. Under it you will see why they ask it and one way you could answer, in your own words.

Fresher level

1. What is a dependent item, and why would you use one?

Why they ask this: Basic understanding of master and dependent items.

How you might answer: A dependent item has no interval of its own; it gets a copy of its master item’s value every time the master collects one and runs its own preprocessing. I use it when one request returns many values, like the Nginx stub_status page or a JSON API.

One web.page.get master gave me seven Nginx items in the lab, so Nginx was asked once a minute instead of seven times.

2. Where does preprocessing run: on the agent or on the server?

Why they ask this: They check you know the architecture and where load lands.

How you might answer: On the Zabbix server, or on the proxy if the host is monitored by a proxy, in the preprocessing manager and workers. The agent only sends the raw value.

So heavy JavaScript on thousands of items costs server or proxy CPU, which matters when sizing a proxy for a remote site.

2–5 years experience

3. Your dependent items all show “pattern does not match” at once. What is your first move?

Why they ask this: They want you to look upstream instead of fixing each regex.

How you might answer: When all dependents fail together, I look at the master first. I run the master key by hand with zabbix_get, or curl the URL, and read the raw value: often it’s an error page, a redirect or a changed format, not a regex problem.

Then I fix the source, and add a validation step on the master with a custom error so the next time the master itself says what’s wrong.

4. How do you convert a growing counter into a rate in Zabbix, and what happens on a restart?

Why they ask this: Checks Change per second and counter reset handling.

How you might answer: I add the Change per second step, which stores the difference divided by the seconds between two values. The first value has nothing to compare with and is dropped.

If the counter goes down, for example after an Nginx restart, Zabbix drops that value too instead of storing a negative rate, so the graph has one missing point and continues.

Senior level

5. You have 20,000 items with JavaScript preprocessing and the server is struggling. How do you approach it?

Why they ask this: Performance thinking at scale.

How you might answer: First I’d measure: the internal items for preprocessing queue and worker busy percent, and Monitoring > Queue. Then I’d look for scripts that run on every value but could be a regex or JSONPath, which are much cheaper.

I’d move heavy hosts to proxies so preprocessing is spread out, use master and dependent items to cut duplicate parsing, add Discard unchanged with heartbeat where values rarely change, and raise StartPreprocessors only after the cheaper fixes.

6. How would you design monitoring for a JSON API that returns 50 metrics, some of which come and go?

Why they ask this: Design question touching dependent items and discovery.

How you might answer: One HTTP agent master item fetching the JSON with History off, then dependent items with JSONPath for the fixed metrics. For the changing ones I’d use a dependent low-level discovery rule on the same master, so items are created and removed as the keys appear and disappear.

I’d add a validation step on the master (Check for error in JSON or a required field), a nodata() trigger on a key metric, and Custom on fail rules so a missing optional field doesn’t make items unsupported.

Quick quiz

Q1. Where does Zabbix run item preprocessing?

  1. On the agent
  2. On the server or proxy
  3. In the browser
  4. In the database
Show answer

B — Preprocessing workers run on the server, or on the proxy for proxy-monitored hosts.

Q2. Which step turns a growing request counter into requests per second?

  1. Custom multiplier
  2. Simple change
  3. Change per second
  4. In range
Show answer

C — Change per second divides the difference by the time between values.

Q3. A dependent item’s update interval comes from…

  1. Its own Update interval field
  2. Its master item
  3. The template
  4. The agent config
Show answer

B — Dependent items get a value whenever the master item collects one.

Q4. What does Discard unchanged with heartbeat 15m do?

  1. Deletes history older than 15 minutes
  2. Stores a value only when it changes, plus at least one every 15 minutes
  3. Checks the agent every 15 minutes
  4. Discards all values for 15 minutes
Show answer

B — It saves storage while still proving the item is alive.

Q5. All dependent items fail with “pattern does not match” at the same time. Most likely cause?

  1. A typo in every regex
  2. The master item returns different text (error page or changed format)
  3. The database is full
  4. The agent version is old
Show answer

B — When every child fails together, check the master value first.

Quick recap

  • Preprocessing steps run in order on the server or proxy, before the value is stored.
  • One master item plus many dependent items means one request to the target and many clean numbers.
  • Regex for text, JSONPath for JSON, JavaScript for maths or many fields, Change per second for counters.
  • Use the Test button and zabbix_js before saving, and read errors from the master downwards.
  • Validation steps with Custom on fail and nodata() triggers stop broken masters from hiding behind old values.

Next lesson

Lesson 12: Web scenarios and HTTP agent for websites and APIs → You check a website the way a user does, step by step, and pull values from a JSON API with the HTTP agent, including certificate expiry.

Further reading: Zabbix preprocessing

Want to go deeper into Zabbix preprocessing? The official Item value preprocessing, Dependent items and JavaScript preprocessing pages list every step and its parameters, and the Nginx stub_status module page explains each counter. If the Nginx items are new to you, see Zabbix templates first, and compare with how Prometheus does rates in PromQL examples.

You can also see the full plan for this course on the Zabbix Monitoring course page.

Scroll to Top

This website uses cookies

We use a few cookies to keep this site working. If you allow it, we also use Google Analytics to count visits so we can improve our lessons. You can accept all, deny the optional ones, or choose what to allow.