Install Prometheus on Ubuntu as a systemd service
-
Phase 1: Prometheus foundations and setup
-
Phase 2: Collect, query and store metrics
-
Phase 3: Alerts and dashboards
In Lesson 1 you ran Prometheus by hand in the foreground, and it stopped the moment you pressed Ctrl+C. This lesson shows you how to install Prometheus on Ubuntu the way it runs at work: a checked download, its own locked-down user, fixed folders for config and data, and a systemd service that starts at boot and restarts if it crashes.
You’ll also learn the daily habits that keep it healthy: testing the config with promtool before you touch the running server, reloading without a restart, reading its logs with journalctl, and upgrading to a new version without losing your data.
Where this lesson fits
Lesson 2 of 10 in Prometheus Monitoring · Phase 1: Prometheus foundations and setup · Before this: Lesson 1, what is Prometheus · Next: Lesson 3, secure Prometheus
| Time | You need | By the end you can |
|---|---|---|
| About 90 minutes | prom01 from Lesson 1 (snapshot “base”), internet access from the VM, an SSH session as student | Prometheus 3.16.0 running on prom01 as a systemd service, surviving reboots, with a snapshot called prom-installed |
What it is, in one line
Installing Prometheus properly means putting the binary, the config and the data in fixed places, running it as its own user, and letting systemd start, stop and reload it.
In Simple Words
The new cook, the kitchen and the house rules
Imagine you hire a cook for a busy mess near a college. On the first day you let him cook in your own kitchen while you stand next to him, and that works for one meal. For a real job you give him his own kitchen, a fixed shelf for the recipe book, a fixed store room for the rations and a key that opens only those rooms, and the mess manager makes sure he turns up every morning at six.
If the recipe book changes, the manager checks the new page for mistakes first and then hands it over, and the cook carries on cooking without leaving the stove. When a better cook comes along, the manager swaps the person but keeps the same kitchen and the same store room full of rations.
Prometheus is the cook, /etc/prometheus is the recipe shelf, /var/lib/prometheus is the store room, and systemd is the mess manager.
Engineer's View
What a proper install looks like
Prometheus ships as two static Go binaries with no dependencies, so there’s no package to install and nothing to compile. The official tarball from GitHub is the source of truth; the Ubuntu archive also has a prometheus package, but it usually trails upstream by many versions and uses different paths, so this course uses the tarball.
| Piece | Where it goes | Owner and mode |
|---|---|---|
| prometheus, promtool binaries | /usr/local/bin/ | root:root, 755 |
| Main config prometheus.yml | /etc/prometheus/ | prometheus:prometheus (read is enough) |
| Rule files (Lessons 7 and 8) | /etc/prometheus/rules/*.yml | prometheus:prometheus |
| TSDB data: blocks, WAL, lock file | /var/lib/prometheus/ | prometheus:prometheus, must be writable |
| Service unit | /etc/systemd/system/prometheus.service | root:root, 644 |
| Logs | journald (journalctl -u prometheus) | handled by systemd |
The service user is a system account with no home and the shell /usr/sbin/nologin, so nobody can log in as it and a bug in Prometheus can’t touch other users’ files. The unit passes four flags: where the config is, where the data goes, how long to keep data (15 days) and --web.enable-lifecycle, which turns on the /-/reload and /-/quit HTTP endpoints.
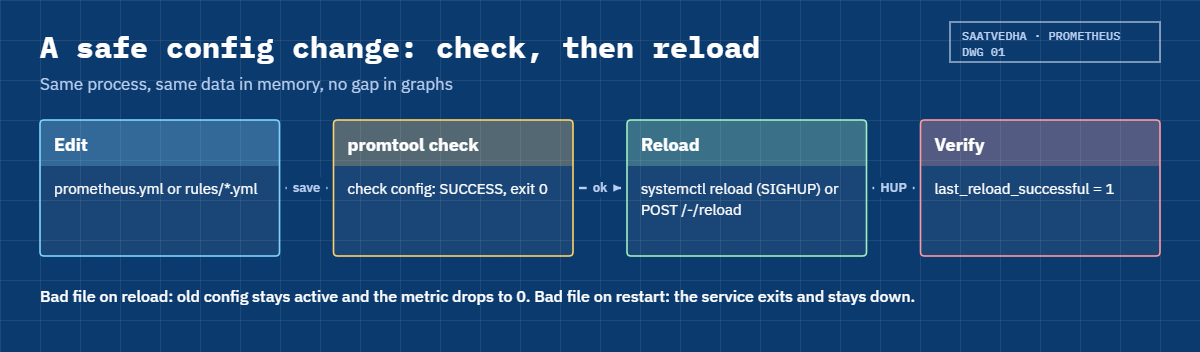
Prometheus reads its config at start and again when it gets a reload (SIGHUP or POST to /-/reload). If the new file is broken, the reload fails, the old config stays active and the metric prometheus_config_last_reload_successful drops to 0. A restart with a broken file is different: the process exits and nothing is monitored until you fix it.
How it works, step by step
1Every piece has one fixed home
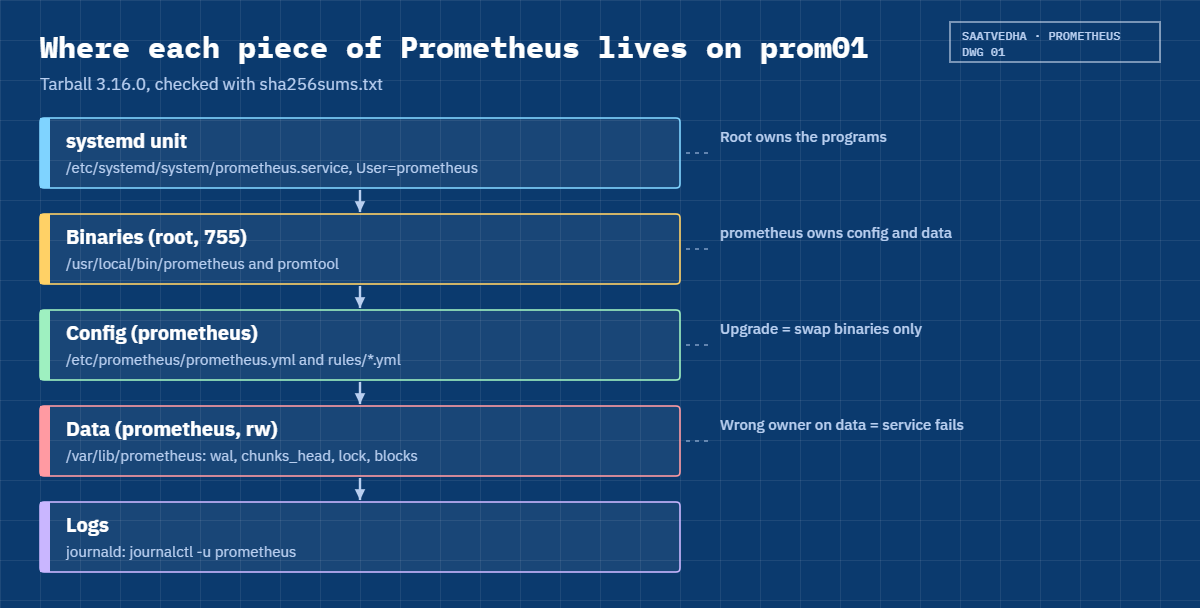
Keeping program, settings and data apart is what makes upgrades and backups easy. You can replace the binary without touching your data, copy /etc/prometheus into Git, and back up or resize /var/lib/prometheus on its own disk later.
The drawing below follows the files from the download to the running service. Note who owns what: root owns the programs, the prometheus user owns the config and data, and systemd ties them together.
2systemd runs it as the prometheus user
When you run systemctl start prometheus, systemd reads the unit file, switches to the user and group in User= and Group=, and runs the ExecStart= line. Anything Prometheus prints goes to the journal, and if the process dies with an error, Restart=on-failure starts it again after RestartSec.
On start, Prometheus opens the data folder and creates a lock file there so a second copy can’t use the same folder. It replays the write-ahead log (WAL) to rebuild recent data in memory, loads the config and only then reports ready.
3How a config change reaches the running server
You’ll change prometheus.yml many times in this course. The safe path is always the same: edit, run promtool check config, then reload. The reload swaps in the new scrape jobs and rules without throwing away the data in memory, so there’s no gap in your graphs.
The second drawing shows that path and what happens when you skip the check.
4Latest or LTS, and how upgrades work
Prometheus puts out a new minor release roughly every six weeks, and once a year one line is marked long-term support (LTS) and gets bug and security fixes for about a year. On 8 Nov 2026 the latest release is 3.16.0 and the LTS line is 3.13 (3.13.5), supported until the end of July 2027.
| Choose | When it fits | Trade-off |
|---|---|---|
| Latest (3.16.x) | Labs, teams who upgrade often, when you need a new feature | Each line gets fixes only until the next release |
| LTS (3.13.x) | Banks, hospitals, sites with strict approval for every change | New features arrive once a year |
An upgrade inside version 3 is a binary swap: stop the service, replace prometheus and promtool, start it again. The TSDB format is kept stable inside a major version, so your data stays readable, but read the release notes first and take a VM snapshot (or copy of the data folder) so you can go back.
Hands-on lab: run Prometheus 3.16 as a systemd service on prom01
Before you run any command, double-check it
Read every command twice before you press Enter. Check the target: the server name, the user, the disk or device name, the path and the sizes. These commands are for learning and were tested in our lab, not on your system. At work, run the read-only commands first, follow your change process, make sure a backup exists, and ask a second person to check anything that changes or deletes data. You run them at your own risk.
Restore prom01 to the base snapshot from Lesson 1 (or delete the test folder in your home), start it and SSH in as student. Every command in this lab runs on prom01.
1Download Prometheus and check the checksum
Run this on prom01:
VER=3.16.0
mkdir -p ~/dl && cd ~/dl
wget -q https://github.com/prometheus/prometheus/releases/download/v$VER/prometheus-$VER.linux-amd64.tar.gz
wget -q https://github.com/prometheus/prometheus/releases/download/v$VER/sha256sums.txt
sha256sum -c sha256sums.txt --ignore-missingYou should see:
prometheus-3.16.0.linux-amd64.tar.gz: OKsha256sums.txt lists a checksum for every file in the release, and --ignore-missing tells sha256sum to check only the ones you downloaded. “OK” means the file you got is byte for byte the one the project published; “FAILED” means a broken or tampered download, so delete it and fetch it again.
✅ Checkpoint: sha256sum prints OK for prometheus-3.16.0.linux-amd64.tar.gz.
2Create the prometheus user and folders
Run this on prom01:
sudo useradd --system --no-create-home --shell /usr/sbin/nologin prometheus
sudo mkdir -p /etc/prometheus/rules /var/lib/prometheus
sudo chown -R prometheus:prometheus /etc/prometheus /var/lib/prometheus
id prometheus
ls -ld /etc/prometheus /var/lib/prometheusYou should see this (your UID and GID numbers and times will differ):
uid=996(prometheus) gid=995(prometheus) groups=995(prometheus)
drwxr-xr-x 3 prometheus prometheus 4096 Nov 8 05:20 /etc/prometheus
drwxr-xr-x 2 prometheus prometheus 4096 Nov 8 05:20 /var/lib/prometheus--system gives a low UID (below 1000) and no password ageing, which is how service accounts are set up on Ubuntu. Your UID may be a different number, and that’s fine.
✅ Checkpoint: id prometheus works and both folders are owned by prometheus.
3Install the binaries and the first config
Paste this whole block:
cd ~/dl && tar xzf prometheus-$VER.linux-amd64.tar.gz
sudo install -m 755 -o root -g root prometheus-$VER.linux-amd64/prometheus prometheus-$VER.linux-amd64/promtool /usr/local/bin/
sudo tee /etc/prometheus/prometheus.yml >/dev/null <<'EOF'
global:
scrape_interval: 15s
evaluation_interval: 15s
rule_files:
- /etc/prometheus/rules/*.yml
scrape_configs:
- job_name: "prometheus"
static_configs:
- targets: ["localhost:9090"]
EOF
sudo chown prometheus:prometheus /etc/prometheus/prometheus.yml
prometheus --versionYou should see:
prometheus, version 3.16.0 (branch: HEAD, revision: e2e28adeee2c5883d000fc82aca6008cfbf7e96d)
build user: root@880187fc0808
build date: 20261105-15:13:16
go version: go1.27.3
platform: linux/amd64
tags: netgo,builtinassetsThe config is shorter than the sample in the tarball on purpose, so you can read every line. global sets defaults for all jobs: scrape every 15 seconds (the built-in default is 1 minute) and run rules every 15 seconds. scrape_timeout is not set, so it stays at 10 seconds, and it must never be longer than the interval.
rule_files takes glob patterns, and an empty folder is fine, so Lessons 7 and 8 only need to drop files into /etc/prometheus/rules. Under scrape_configs each list item starting with - job_name is one job, and static_configs lists its targets as host:port. Prometheus adds /metrics and http:// itself.
✅ Checkpoint: The version check reports 3.16.0 and /etc/prometheus/prometheus.yml exists.
4Check the config with promtool
Run this on prom01:
promtool check config /etc/prometheus/prometheus.yml; echo "exit code: $?"You should see this:
Checking /etc/prometheus/prometheus.yml
SUCCESS: /etc/prometheus/prometheus.yml is valid prometheus config file syntax
exit code: 0promtool parses the file the same way the server does, including any rule files it points to. Exit code 0 means valid and 1 means failed, which is handy in scripts and CI pipelines: you can block a Git merge if the check fails.
✅ Checkpoint: promtool prints SUCCESS and exit code 0.
5Write the systemd unit
Paste this whole block:
sudo tee /etc/systemd/system/prometheus.service >/dev/null <<'EOF'
[Unit]
Description=Prometheus monitoring server
Documentation=https://prometheus.io/docs/introduction/overview/
Wants=network-online.target
After=network-online.target
[Service]
Type=simple
User=prometheus
Group=prometheus
ExecStart=/usr/local/bin/prometheus \
--config.file=/etc/prometheus/prometheus.yml \
--storage.tsdb.path=/var/lib/prometheus \
--storage.tsdb.retention.time=15d \
--web.enable-lifecycle
ExecReload=/bin/kill -HUP $MAINPID
Restart=on-failure
RestartSec=5s
LimitNOFILE=65536
[Install]
WantedBy=multi-user.target
EOF
sudo systemd-analyze verify /etc/systemd/system/prometheus.service && echo "unit OK"You should see this:
unit OKThe backslashes let one long ExecStart line wrap over several lines, and there must be nothing after them, not even a space. ExecReload sends SIGHUP to the main process, which Prometheus treats as “read your config again”. LimitNOFILE=65536 raises the open file limit, because a busy server keeps many block files and connections open.
Writing 15d for retention looks the same as the default, but writing it down means nobody has to guess, and Lesson 6 adds a size limit next to it.
✅ Checkpoint: systemd-analyze verify prints nothing and you see “unit OK”.
6Start it, enable it at boot and read the logs
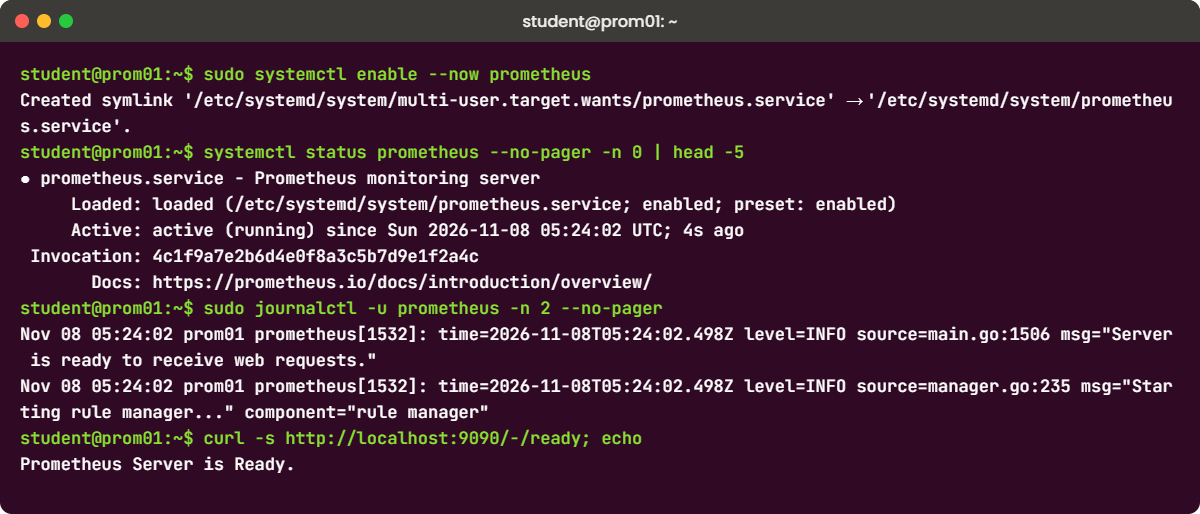
Run this on prom01:
sudo systemctl daemon-reload
sudo systemctl enable --now prometheus
systemctl status prometheus --no-pager -n 0
sudo journalctl -u prometheus -n 5 --no-pagerYou should see this (your times and PIDs will differ, and the long log lines are shortened):
Created symlink '/etc/systemd/system/multi-user.target.wants/prometheus.service' → '/etc/systemd/system/prometheus.service'.
● prometheus.service - Prometheus monitoring server
Loaded: loaded (/etc/systemd/system/prometheus.service; enabled; preset: enabled)
Active: active (running) since Sun 2026-11-08 05:24:02 UTC; 4s ago
Invocation: 4c1f9a7e2b6d4e0f8a3c5b7d9e1f2a4c
Docs: https://prometheus.io/docs/introduction/overview/
Main PID: 1532 (prometheus)
Tasks: 8 (limit: 2266)
Memory: 38.6M (peak: 39.1M)
CPU: 312ms
CGroup: /system.slice/prometheus.service
└─1532 /usr/local/bin/prometheus --config.file=/etc/prometheus/prometheus.yml --storage.tsdb.path=/var/lib/prometheus --storage.tsdb.retention.time=15d --web.enable-lifecycle
Nov 08 05:24:02 prom01 prometheus[1532]: time=2026-11-08T05:24:02.497Z level=INFO source=main.go:1744 msg="Loading configuration file" filename=/etc/prometheus/prometheus.yml
Nov 08 05:24:02 prom01 prometheus[1532]: time=2026-11-08T05:24:02.497Z level=INFO source=main.go:1148 msg="TSDB retention updated" duration=15d size=0B percentage=0
Nov 08 05:24:02 prom01 prometheus[1532]: time=2026-11-08T05:24:02.498Z level=INFO source=main.go:1786 msg="Completed loading of configuration file" db_storage=29.066µs ... filename=/etc/prometheus/prometheus.yml totalDuration=796.506µs
Nov 08 05:24:02 prom01 prometheus[1532]: time=2026-11-08T05:24:02.498Z level=INFO source=main.go:1506 msg="Server is ready to receive web requests."
Nov 08 05:24:02 prom01 prometheus[1532]: time=2026-11-08T05:24:02.498Z level=INFO source=manager.go:235 msg="Starting rule manager..." component="rule manager"enable --now does two jobs in one: it links the unit into multi-user.target so it starts at boot, and starts it right away. In the log, each line has time=, level= (INFO, WARN, ERROR), source= (the Go file and line) and msg=, so you can grep for level=ERROR when something goes wrong.
✅ Checkpoint: systemctl shows “active (running)” and “enabled”, and the journal shows “Server is ready to receive web requests”.
7Check the health and ready endpoints
Run this on prom01:
curl -s http://localhost:9090/-/healthy; echo
curl -s http://localhost:9090/-/ready; echo
curl -s 'http://localhost:9090/api/v1/query?query=up'; echo
sudo ss -ltnp | grep 9090You should see this (your timestamp and PID will differ):
Prometheus Server is Healthy.
Prometheus Server is Ready.
{"status":"success","data":{"resultType":"vector","result":[{"metric":{"__name__":"up","instance":"localhost:9090","job":"prometheus"},"value":[1794115460.399,"1"]}]}}
LISTEN 0 4096 0.0.0.0:9090 0.0.0.0:* users:(("prometheus",pid=1532,fd=8))/-/healthy answers 200 as soon as the process is alive, while /-/ready waits until the WAL replay is done and queries will work. Load balancers and Kubernetes probes use them that way: healthy for “restart it if this fails”, ready for “send traffic now”. The API answer is the same up query you ran in the browser in Lesson 1, as JSON.
✅ Checkpoint: Both endpoints answer, and the API returns up with value “1”.
8Tour the web UI
On your laptop open http://192.168.56.60:9090. Prometheus 3 has a new interface; these are the pages you’ll use most.
| Page | What you find there | Use it when |
|---|---|---|
| Query | Query box with Table and Graph tabs, plus the metrics explorer | Trying PromQL, checking a value |
| Alerts | Alerting rules and their state (inactive, pending, firing) | Lesson 8 onwards |
| Status > Target health | Every target, its state, last scrape, duration and last error | A graph is empty or up is 0 |
| Status > Configuration | The config the server is running now, with defaults filled in | Checking that a reload took effect |
| Status > Command-line flags | Every flag and its value, including the ones you didn’t set | Checking retention or listen address |
| Status > TSDB status | Series count, top metrics and labels by series | Memory is growing (Lesson 6) |
| Status > Runtime & build information | Version, uptime, storage retention, reload status | After an upgrade |
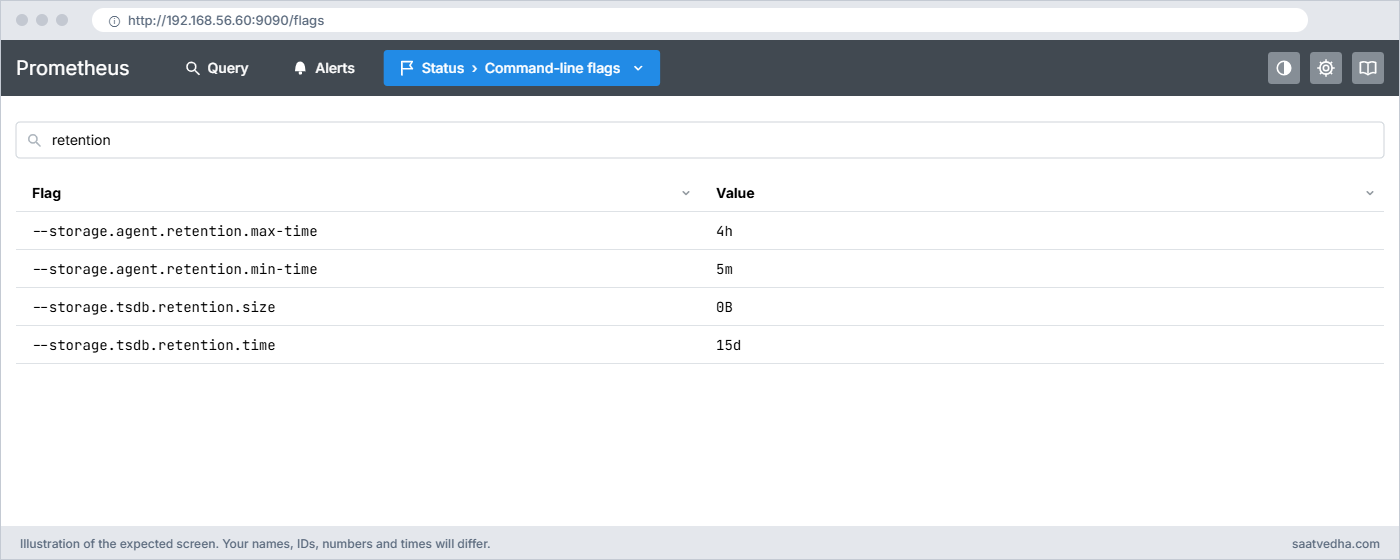
Open Status > Command-line flags and type retention in the filter: you should see storage.tsdb.retention.time set to 15d. Then open Status > Configuration and note that Prometheus has filled in scrape_timeout: 10s even though you never wrote it.
Status > Configuration: the running config, with scrape_timeout: 10s and other defaults filled in✅ Checkpoint: You opened Target health, Configuration and Command-line flags, and retention shows 15d.
9Reload the config two ways
Change the scrape interval to 30s, check it, reload with the HTTP endpoint, then put it back and reload with systemctl.
Run this on prom01:
sudo sed -i 's/scrape_interval: 15s/scrape_interval: 30s/' /etc/prometheus/prometheus.yml
promtool check config /etc/prometheus/prometheus.yml
curl -s -X POST http://localhost:9090/-/reload && echo "reload sent"
curl -s http://localhost:9090/api/v1/status/config | grep -o 'scrape_interval: [0-9a-z]*' | head -1
sudo sed -i 's/scrape_interval: 30s/scrape_interval: 15s/' /etc/prometheus/prometheus.yml
sudo systemctl reload prometheus
curl -s http://localhost:9090/metrics | grep '^prometheus_config_last_reload_successful'You should see:
Checking /etc/prometheus/prometheus.yml
SUCCESS: /etc/prometheus/prometheus.yml is valid prometheus config file syntax
reload sent
scrape_interval: 30s
prometheus_config_last_reload_successful 1The POST works only because the unit has --web.enable-lifecycle; without it Prometheus answers “Lifecycle API is not enabled.” The systemctl reload sends SIGHUP through ExecReload. sudo journalctl -u prometheus -n 4 shows a “Completed loading of configuration file” line for each reload, and the PID in systemctl status doesn’t change, so the process never restarted.
✅ Checkpoint: Status > Configuration showed 30s after the first reload and 15s after the second, and prometheus_config_last_reload_successful is 1.
10Reboot test, snapshot, and how you would upgrade
Run this on prom01:
sudo reboot
# log in again after a minute, then:
systemctl is-active prometheus; systemctl is-enabled prometheusYou should see this:
active
enabledShut prom01 down and take a VirtualBox snapshot called prom-installed. Lesson 3 starts from it. When a new release comes out later, the upgrade on this layout looks like this (don’t run it now, 3.16.0 is current):
NEW=3.16.1 # the version you are moving to
cd ~/dl && wget -q https://github.com/prometheus/prometheus/releases/download/v$NEW/prometheus-$NEW.linux-amd64.tar.gz
wget -q -O sha256sums-$NEW.txt https://github.com/prometheus/prometheus/releases/download/v$NEW/sha256sums.txt
sha256sum -c sha256sums-$NEW.txt --ignore-missing
tar xzf prometheus-$NEW.linux-amd64.tar.gz
prometheus-$NEW.linux-amd64/promtool check config /etc/prometheus/prometheus.yml
sudo systemctl stop prometheus
sudo cp /usr/local/bin/prometheus /usr/local/bin/prometheus.old
sudo install -m 755 prometheus-$NEW.linux-amd64/prometheus prometheus-$NEW.linux-amd64/promtool /usr/local/bin/
sudo systemctl start prometheus
prometheus --version | head -1; curl -s http://localhost:9090/-/readyChecking your current config with the new promtool before you stop anything catches settings that the new version no longer accepts. If the new version misbehaves, stop it, copy prometheus.old back and start again, or restore the snapshot.
✅ Checkpoint: After the reboot Prometheus is active and enabled, and prom01 has a snapshot called prom-installed.
Break It, Then Fix It
Three failures you will meet on a real server. Take a VirtualBox snapshot first (or rely on prom-installed) so you can roll back if you get lost.
1A tab sneaks into prometheus.yml
Many editors and copy-paste from chat tools put a tab where YAML expects spaces. Put one in on purpose:
Run this on prom01:
sudo cp /etc/prometheus/prometheus.yml /etc/prometheus/prometheus.yml.bak
sudo sed -i 's/^ - targets/\t - targets/' /etc/prometheus/prometheus.yml
promtool check config /etc/prometheus/prometheus.yml
curl -s -X POST http://localhost:9090/-/reload; echoYou’ll get this error:
Checking /etc/prometheus/prometheus.yml
FAILED: parsing YAML file /etc/prometheus/prometheus.yml: yaml: line 11: found character that cannot start any token
failed to reload config: couldn't load configuration (--config.file="/etc/prometheus/prometheus.yml"): parsing YAML file /etc/prometheus/prometheus.yml: yaml: line 11: found character that cannot start any tokenYAML allows only spaces for indentation, so a tab at the start of line 11 can’t begin any token. The reload failed but the server kept running with its old config, and prometheus_config_last_reload_successful is now 0. If you had restarted instead of reloading, the service would have died with the same message in the journal and stayed down.
Fix: find the tab, then restore or retype the line with spaces:
grep -nP '\t' /etc/prometheus/prometheus.yml
sudo cp /etc/prometheus/prometheus.yml.bak /etc/prometheus/prometheus.yml
promtool check config /etc/prometheus/prometheus.yml && sudo systemctl reload prometheus11: - targets: ["localhost:9090"]In vim, :set list shows tabs as ^I, and adding set expandtab to ~/.vimrc stops vim from typing them.
✅ Checkpoint: promtool says SUCCESS again and prometheus_config_last_reload_successful is back to 1.
2The data folder belongs to the wrong user
This happens when someone runs the binary by hand with sudo against the real data folder, or restores a backup as root. Simulate it:
Run this on prom01:
sudo systemctl stop prometheus
sudo chown -R root:root /var/lib/prometheus
sudo systemctl start prometheus
sleep 3; systemctl is-active prometheus
sudo journalctl -u prometheus -n 20 --no-pager | grep level=ERRORYou’ll get this error:
activating
Nov 08 05:41:17 prom01 prometheus[1904]: time=2026-11-08T05:41:17.632Z level=ERROR source=query_logger.go:138 msg="Error opening query log file" component=activeQueryTracker file=/var/lib/prometheus/queries.active err="open /var/lib/prometheus/queries.active: permission denied"
Nov 08 05:41:17 prom01 prometheus[1904]: time=2026-11-08T05:41:17.632Z level=ERROR source=main.go:1027 msg="failed to initialize active query tracker" err="create mmap-ed active query log: open /var/lib/prometheus/queries.active: permission denied"The first file Prometheus opens in the data folder is queries.active, its record of running queries, and the prometheus user can’t write to a root-owned file. systemd keeps restarting it every 5 seconds and it keeps failing, which is why is-active says activating instead of active. If only the wal folder were wrong you’d see opening storage failed: open /var/lib/prometheus/wal/00000000: permission denied instead.
A close cousin is the lock error. If a second copy (a hand-started test, or two units) points at the same folder, it stops with opening storage failed: lock DB directory: resource temporarily unavailable. Here the fix is to stop the extra copy, never to delete the lock file.
Fix:
sudo chown -R prometheus:prometheus /var/lib/prometheus
sudo systemctl restart prometheus
systemctl is-active prometheusactive✅ Checkpoint: Prometheus is active again and ls -l /var/lib/prometheus shows prometheus as owner of every file.
3Port 9090 is already taken
A forgotten copy from Lesson 1 (left running in tmux or screen) is the classic cause. Start one by hand while the service is stopped, then try the service:
Run this on prom01:
sudo systemctl stop prometheus
cd ~/dl/prometheus-3.16.0.linux-amd64 && nohup ./prometheus --config.file=prometheus.yml --storage.tsdb.path=/tmp/promtest >/dev/null 2>&1 &
sudo systemctl start prometheus; sleep 3
sudo journalctl -u prometheus -n 20 --no-pager | grep level=ERRORYou’ll get this error:
Nov 08 05:46:09 prom01 prometheus[2011]: time=2026-11-08T05:46:09.245Z level=ERROR source=main.go:1280 msg="Unable to start web listener" err="listen tcp 0.0.0.0:9090: bind: address already in use"Only one process can listen on a TCP port. The service starts, fails to bind, exits with status 1 and goes into the restart loop, while the stray copy happily answers on 9090, so the UI still works and it’s easy to miss that you’re looking at the wrong server.
Fix: find the owner of the port and stop it:
sudo ss -ltnp | grep 9090
kill 2003 # use the pid that ss shows for your stray copy
rm -rf /tmp/promtest
sudo systemctl restart prometheus && systemctl is-active prometheusLISTEN 0 4096 0.0.0.0:9090 0.0.0.0:* users:(("prometheus",pid=2003,fd=8))
activeA quick way to tell the two apart is the CGroup line in systemctl status: the service’s PID lives under /system.slice/prometheus.service, a stray copy doesn’t.
✅ Checkpoint: ss shows one prometheus on 9090 and its PID matches the Main PID in systemctl status.
This happened at work
The Monday morning with no graphs
My team lead in Chennai likes to tell this one. She was supporting the back office of a bank there, where Prometheus watched the servers that ran the overnight reconciliation batches. Patching happened on Sunday nights, and one Monday at 8:30 the operations manager called to ask why the batch dashboard had been blank since 1 am.
The first guess was the batch servers, so two engineers spent twenty minutes checking them, and they were fine. Then someone noticed that Grafana’s data source test was failing, and systemctl status prometheus showed the service flapping in “activating (auto-restart)”. The journal said permission denied on queries.active.
The story behind it came out over tea. On Friday an engineer had wanted to try a flag, stopped the service and started the binary by hand with sudo against /var/lib/prometheus. It ran happily as root for two days and created new block folders owned by root.
When the server rebooted after patching, systemd started Prometheus as the prometheus user, which could no longer write its own folder.
The fix took one chown -R. The changes that stuck were bigger: nobody runs the real binary by hand any more (tests use a copy with a separate data path and port), a second small Prometheus in another data centre now scrapes the first one and alerts if up goes to 0, and the patch checklist ends with systemctl is-active prometheus.
Common mistakes and troubleshooting
| Mistake | What happens | What to do instead |
|---|---|---|
| Restarting instead of reloading after a config edit | A typo kills the service and you lose monitoring until you notice | Run promtool check config, then reload with systemctl reload or POST /-/reload |
| Running the binary by hand with sudo on the real data folder | New files are owned by root and the service fails on the next start | Test with a copy, its own storage.tsdb.path and another port |
| Installing the Ubuntu archive package and following upstream docs | Paths, flags and versions don’t match what you read | Use the official tarball and the layout in this lesson, or follow the package’s own docs |
| Skipping the checksum | A cut-off or tampered download fails in odd ways later | Always run sha256sum -c with sha256sums.txt |
| Forgetting daemon-reload after editing the unit | systemd keeps using the old flags and your change seems ignored | Run sudo systemctl daemon-reload, then restart |
| Deleting the lock file to “fix” a lock error | Two servers write the same TSDB and corrupt it | Find and stop the second copy with ss -ltnp or ps |
| Upgrading without a snapshot or release notes | A breaking change leaves you with no quick way back | Snapshot, read the notes, check the config with the new promtool, keep the old binary |
Interview questions
Click a question to open it. Each one is written the way an interviewer would ask it. Under it you will see why they ask it and one way you could answer, in your own words.
Fresher level
1. How would you check that a Prometheus config change is safe before applying it?
Why they ask this: They want to hear promtool and reload, the basic daily habit.
How you might answer: I run promtool check config on the file; it parses the YAML and the rule files the same way the server does and exits 0 only if everything is valid. Then I reload with sudo systemctl reload prometheus or a POST to /-/reload, and check prometheus_config_last_reload_successful is still 1.
In a team I put the same promtool check in the CI pipeline, so a broken file can’t be merged.
2. Where does Prometheus keep its data and logs on a systemd install?
Why they ask this: A simple check that you know the layout and where to look first.
How you might answer: Data goes to the folder given by storage.tsdb.path, in our setup /var/lib/prometheus, with the WAL, the head chunks and the two-hour blocks. Prometheus logs to stderr, so systemd puts it in the journal and I read it with journalctl -u prometheus.
2–5 years experience
3. Prometheus won’t start after a server reboot. Walk me through how you find the cause.
Why they ask this: They want a calm, ordered approach, starting with the evidence instead of guesses.
How you might answer: I start with systemctl status prometheus to see whether it’s crashing or not enabled, then journalctl -u prometheus filtered on level=ERROR for the real message. The usual ones are a YAML parse error, permission denied on the data folder, a lock error from a second copy, or bind: address already in use.
Each has a direct check: promtool check config, ls -l on /var/lib/prometheus, ps for another prometheus, and ss -ltnp for port 9090.
4. What is the difference between /-/healthy and /-/ready, and what does a reload do inside the process?
Why they ask this: They are checking whether you understand the server lifecycle, which matters for probes and automation.
How you might answer: /-/healthy returns 200 once the process is up; /-/ready returns 200 only after the TSDB has replayed the WAL and the server can answer queries. I’d use healthy for a liveness probe and ready for a readiness probe or before sending traffic.
A reload re-reads the config and rule files inside the same process, so scrape jobs and rules change without losing in-memory data. If the new file is bad, the old config stays active and the reload metric goes to 0.
Senior level
5. Your bank asks whether to run Prometheus latest or LTS. What do you recommend and how do you plan upgrades?
Why they ask this: They want judgement balancing risk, features and the organisation’s approval process.
How you might answer: For a bank with strict change approval I’d run the LTS line, 3.13 right now, because it gets fixes for about a year and fewer feature changes to test. If a team needs a newer feature, they can run latest on a non-critical server first.
Either way upgrades follow one runbook: read the release notes, check the live config with the new promtool, snapshot or back up the data folder, swap the binaries, start, and check /-/ready, the version and Target health. The old binary stays on disk until the new one has run cleanly for a while.
6. How would you harden this systemd unit further?
Why they ask this: They’re looking for practical Linux security knowledge beyond “it works”.
How you might answer: It already runs as a nologin system user. I’d add systemd sandboxing such as ProtectSystem=strict with ReadWritePaths=/var/lib/prometheus, ProtectHome=true, NoNewPrivileges=true and PrivateTmp=true, then test that reloads, rules and the data folder still work.
I’d also stop binding 9090 to every interface and put it behind a reverse proxy with TLS and authentication, which is the next lesson.
Quick quiz
Q1. Which command checks prometheus.yml for errors without touching the running server?
- prometheus check
- promtool check config /etc/prometheus/prometheus.yml
- systemctl verify prometheus
- yamllint prometheus.yml
Show answer
B — promtool check config parses the file and its rule files the same way the server does.
Q2. What does curl -X POST http://localhost:9090/-/reload need to work?
- Root access
- The web.enable-lifecycle flag
- The admin API flag
- A restart first
Show answer
B — Without the web.enable-lifecycle flag the server answers “Lifecycle API is not enabled.”
Q3. You reload with a broken prometheus.yml. What happens?
- Prometheus crashes
- Prometheus deletes the bad file
- The reload fails and the old config keeps running
- All targets go down
Show answer
C — A failed reload keeps the previous config and sets prometheus_config_last_reload_successful to 0.
Q4. The service fails with “open /var/lib/prometheus/queries.active: permission denied”. What is the likely fix?
- Increase LimitNOFILE
- chown -R prometheus:prometheus /var/lib/prometheus
- Delete the WAL folder
- Change the port
Show answer
B — The data folder has the wrong owner, so the prometheus user can’t write to it.
Q5. What does systemctl enable with the now option do for prometheus?
- Starts it once
- Enables it at boot only
- Enables it at boot and starts it now
- Reloads its config
Show answer
C — The now option combines enable (start at boot) with an immediate start.
Quick recap
- Download the official tarball and verify it with sha256sum -c against sha256sums.txt.
- Binaries live in /usr/local/bin, config in /etc/prometheus, data in /var/lib/prometheus, and the service runs as the nologin user prometheus.
- The systemd unit sets config path, data path, 15d retention and the lifecycle API, and ExecReload sends SIGHUP.
- Always run promtool check config before a reload; a bad reload keeps the old config, a bad restart stops monitoring.
- Upgrades are a binary swap with a snapshot and the new promtool check first; pick LTS (3.13) or latest (3.16) to suit how often you can change.
Next lesson
Lesson 3: Secure Prometheus with Nginx, HTTPS and basic auth → Right now anyone on the network can open port 9090. Next you put Prometheus behind Nginx with HTTPS and a password, and lock the port down.
Further reading: install Prometheus on Ubuntu
Want to go deeper into install Prometheus on Ubuntu? The official installation page, configuration reference and command-line flags list cover every option used here, and the GitHub releases page has the notes to read before each upgrade. If systemd and journalctl are new to you, the Linux administration course explains services and logs from the start, and Lesson 1 has the lab setup.
You can also see the full plan for this course on the Prometheus Monitoring course page.
