Prometheus monitoring is how most modern teams find out that a server is running out of disk, an application has started throwing errors or a service has quietly stopped, before a customer rings to complain. Prometheus collects numbers from your machines every few seconds, keeps them as time series and fires alerts when something crosses a line you set.
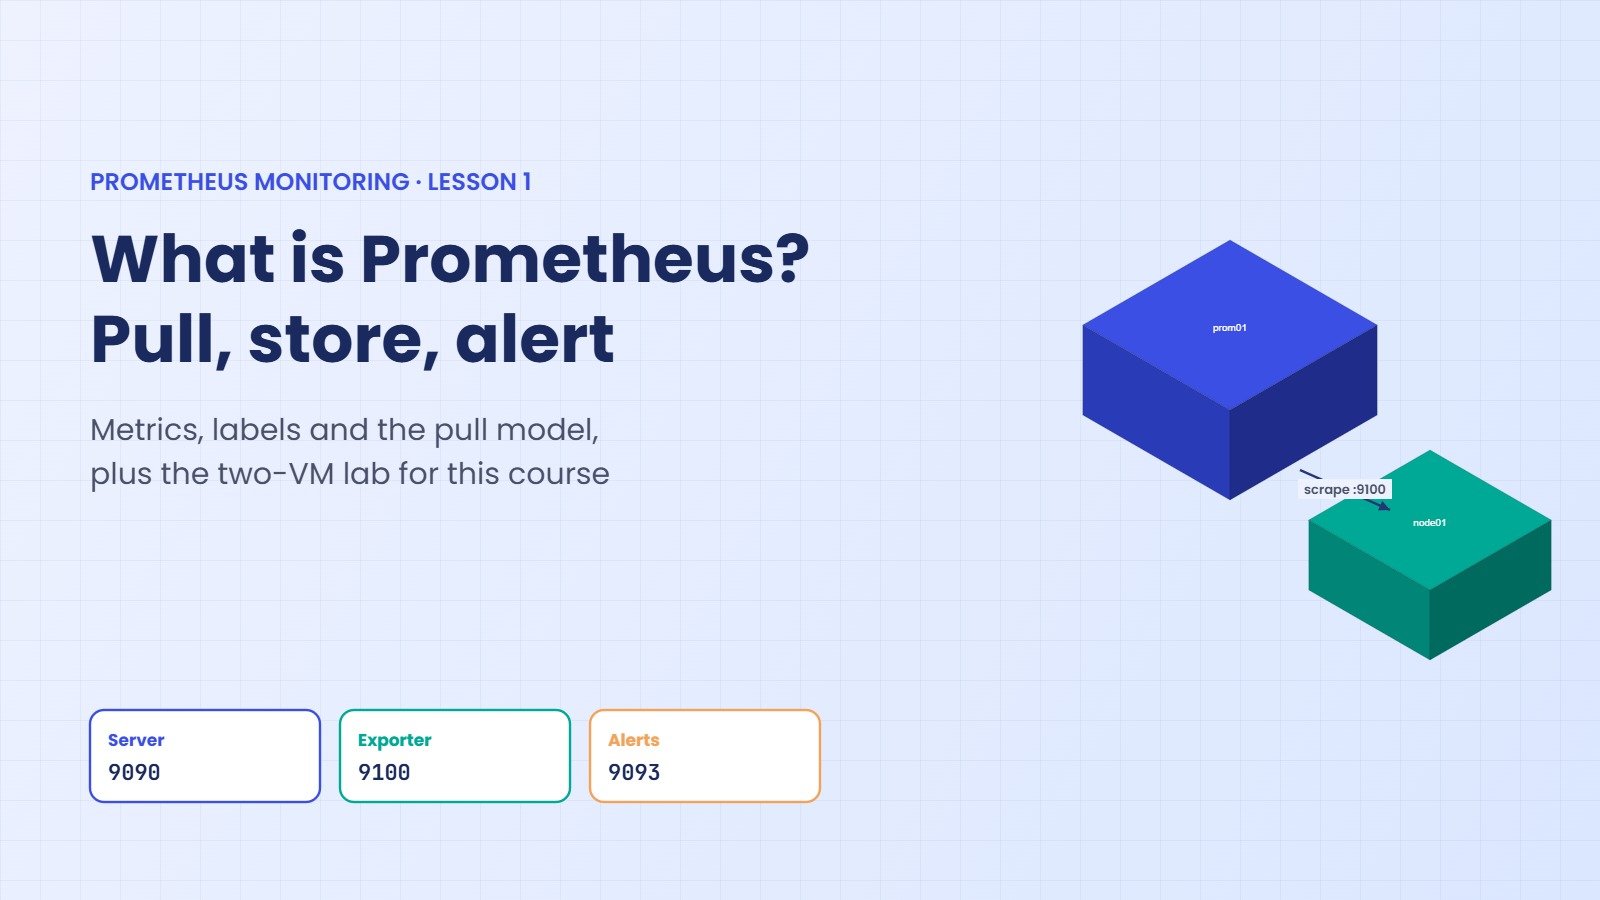
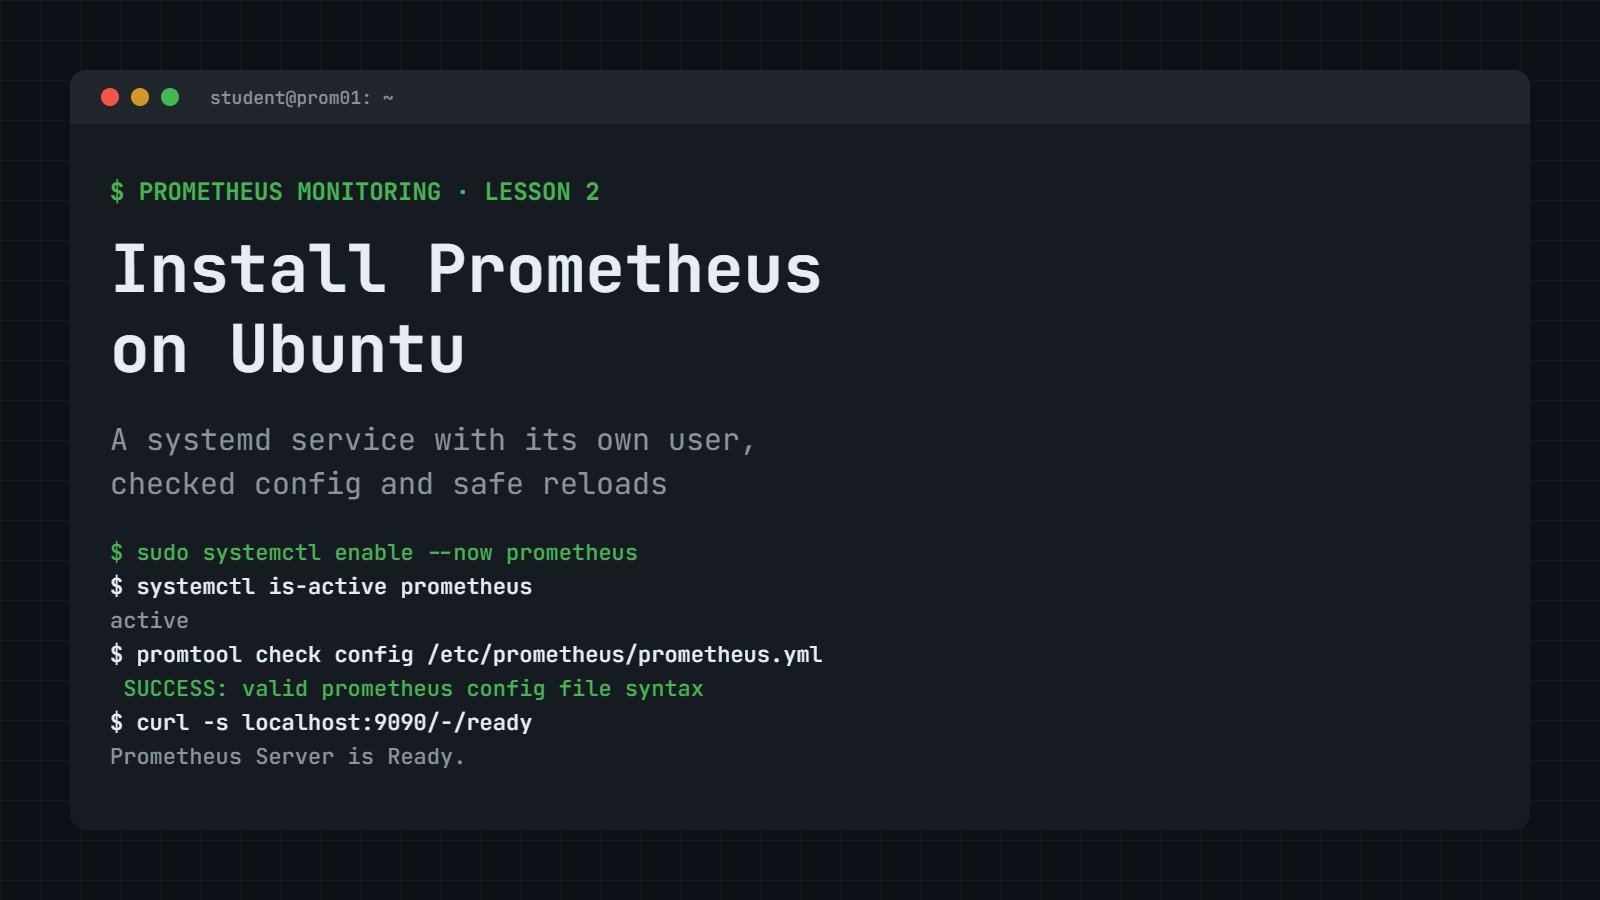
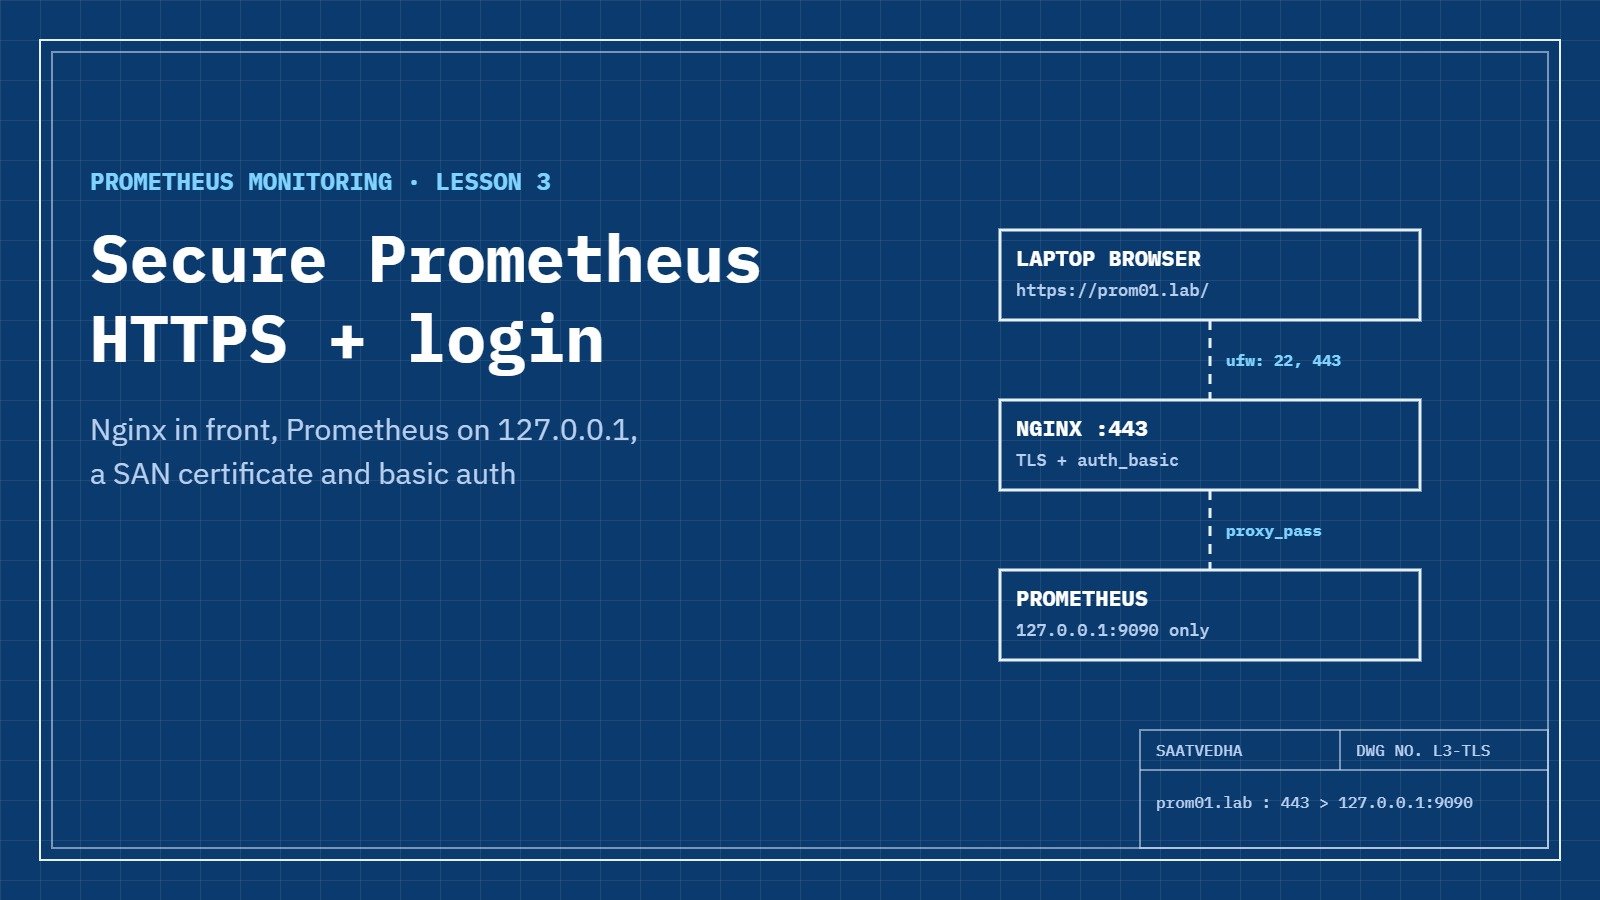
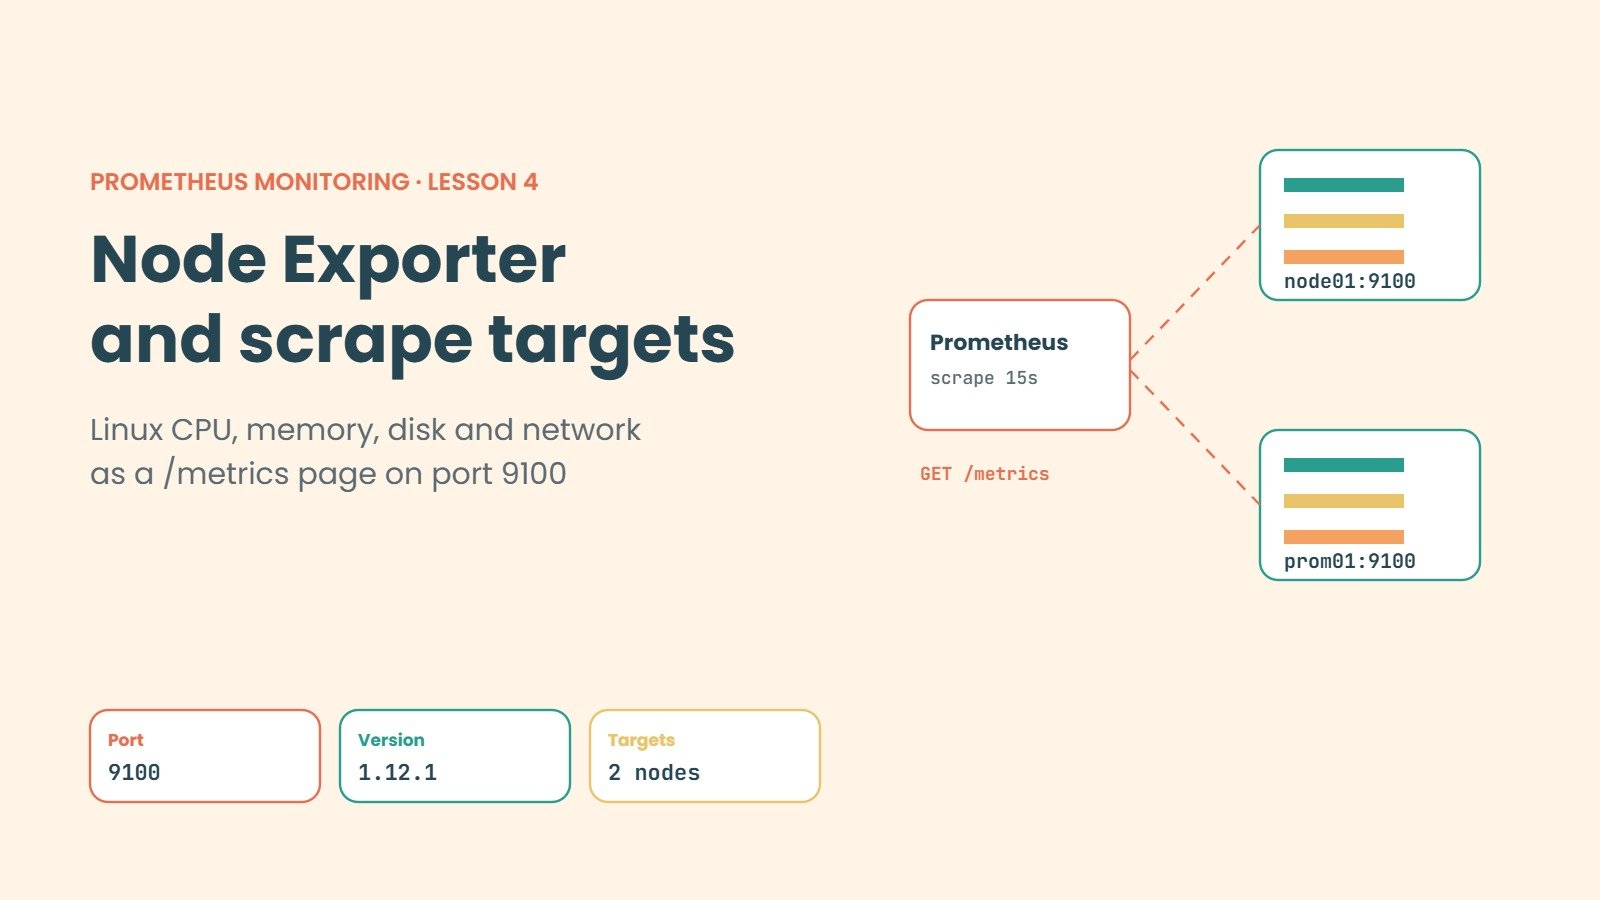
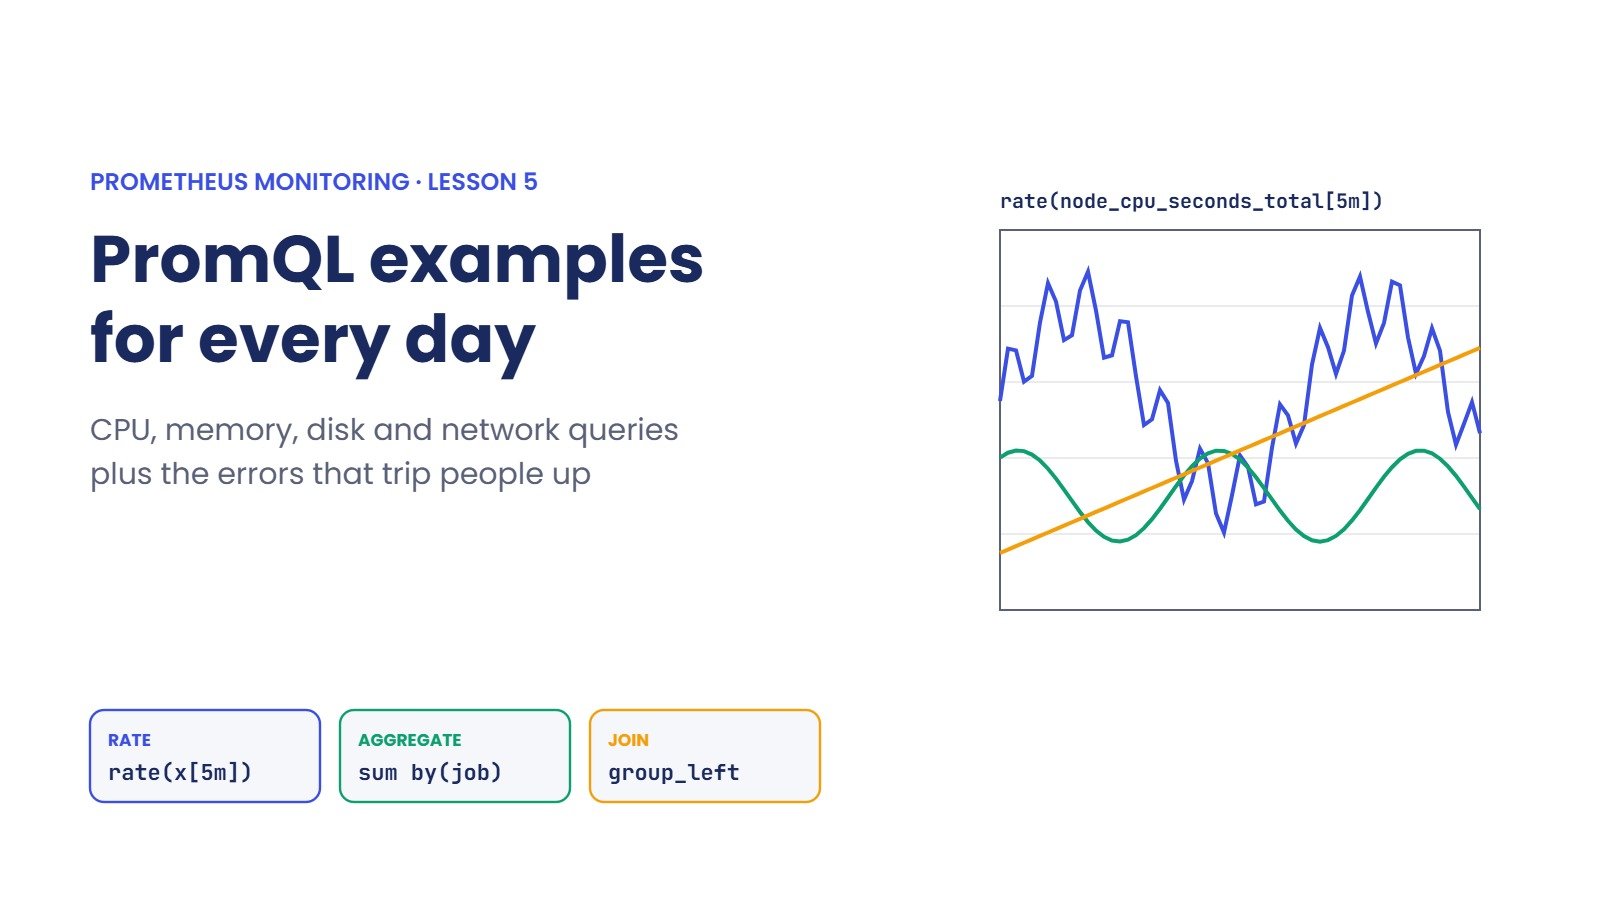
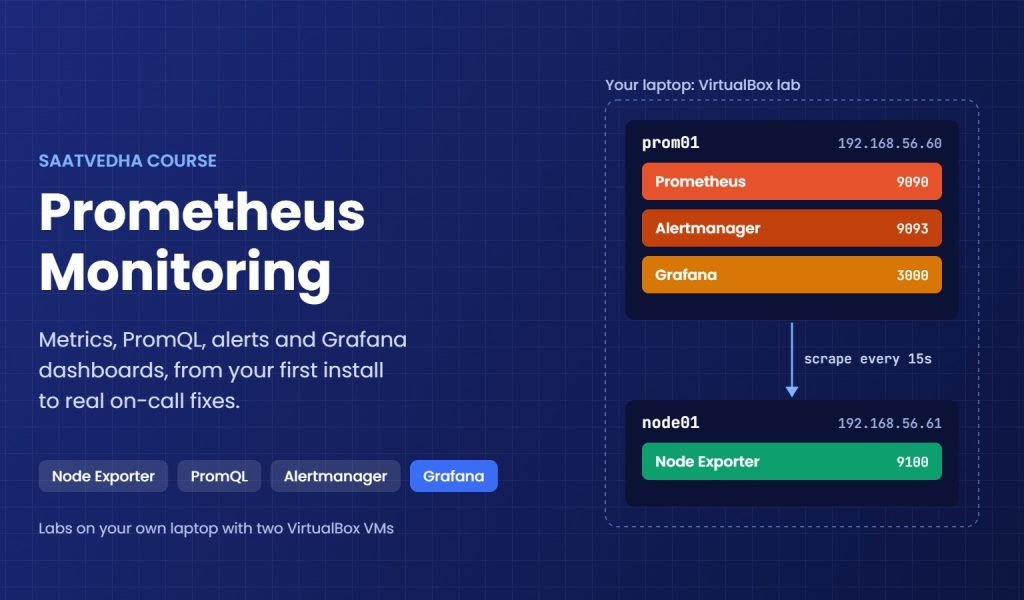
This course starts from zero. You first learn what monitoring is and why Prometheus pulls metrics instead of waiting for them. Then you install Prometheus on Ubuntu as a proper systemd service, put it behind Nginx with HTTPS and a password, add a second server with Node Exporter, and learn PromQL with queries you will use at work every week.
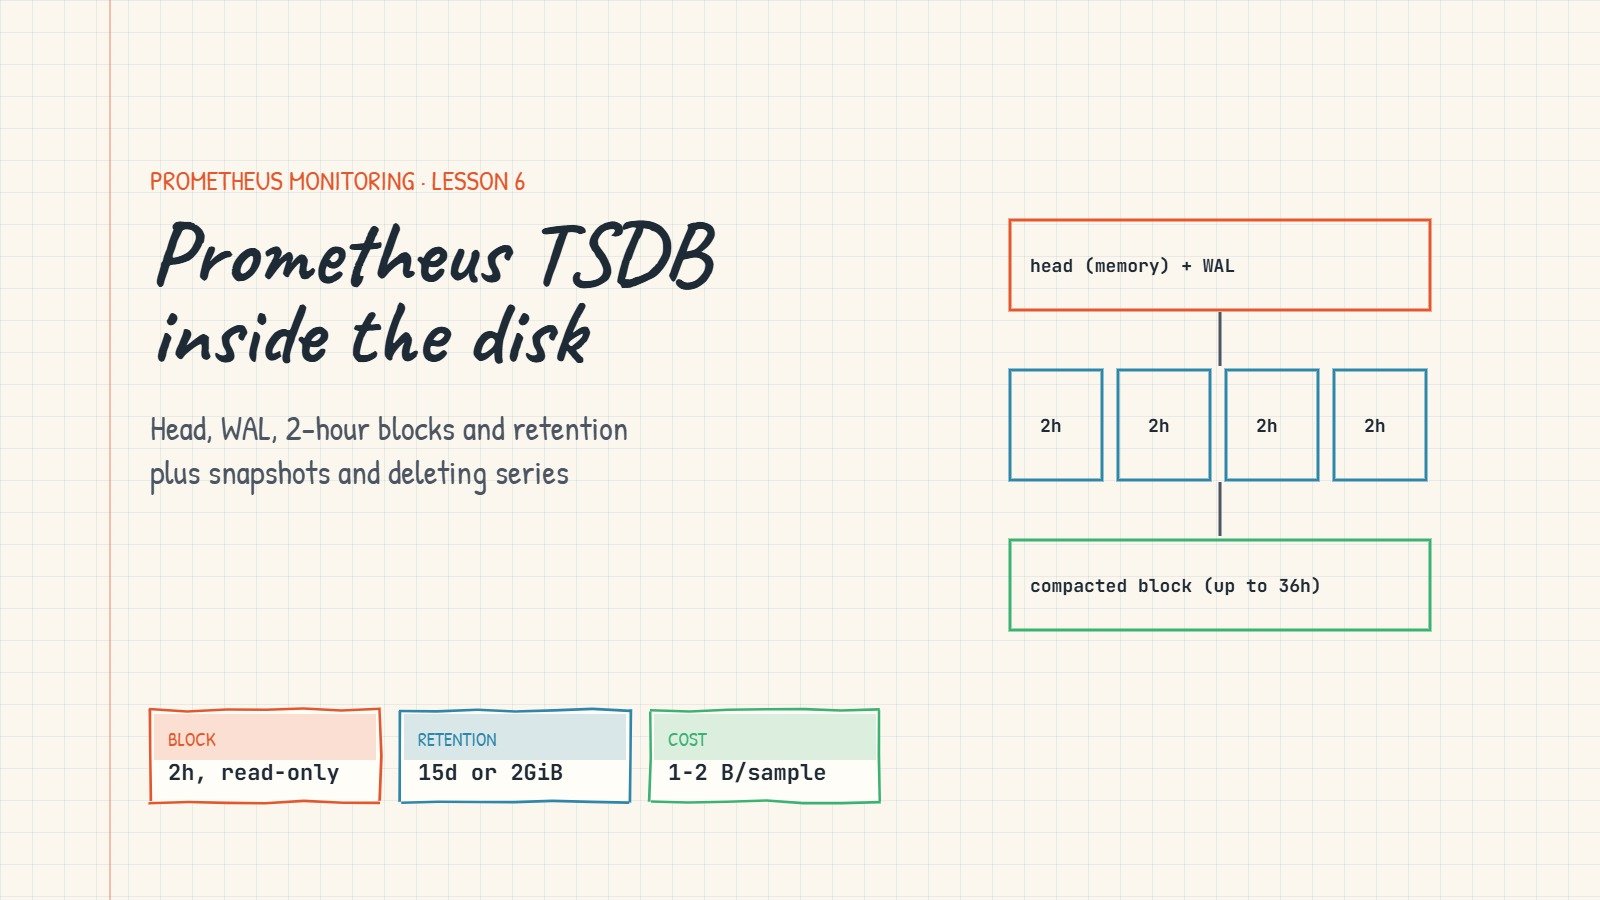
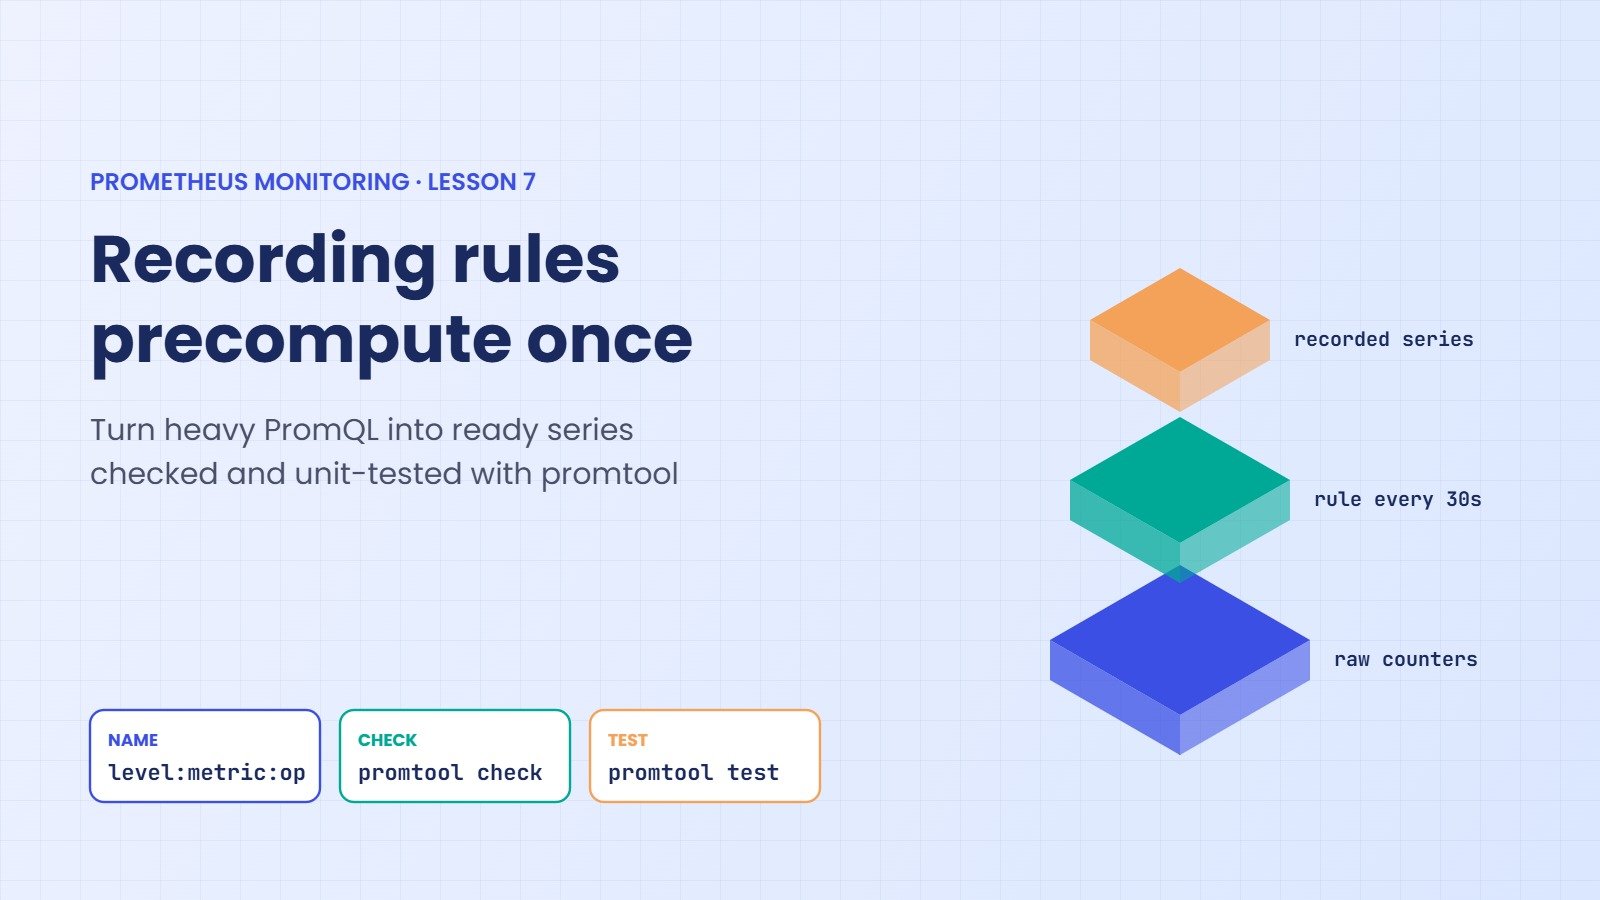
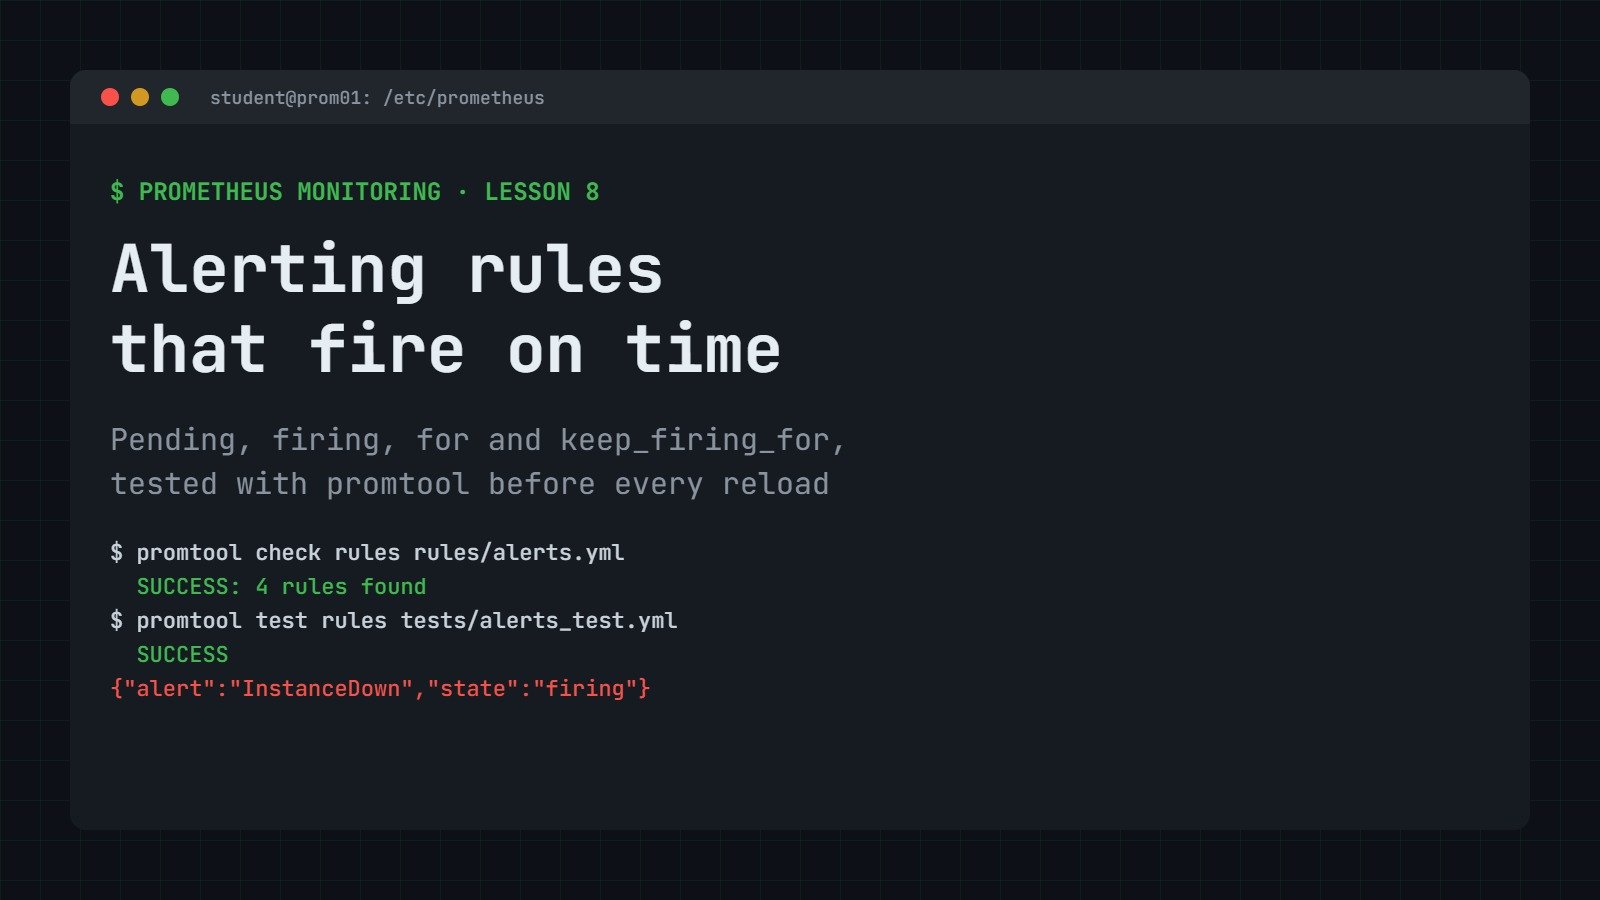
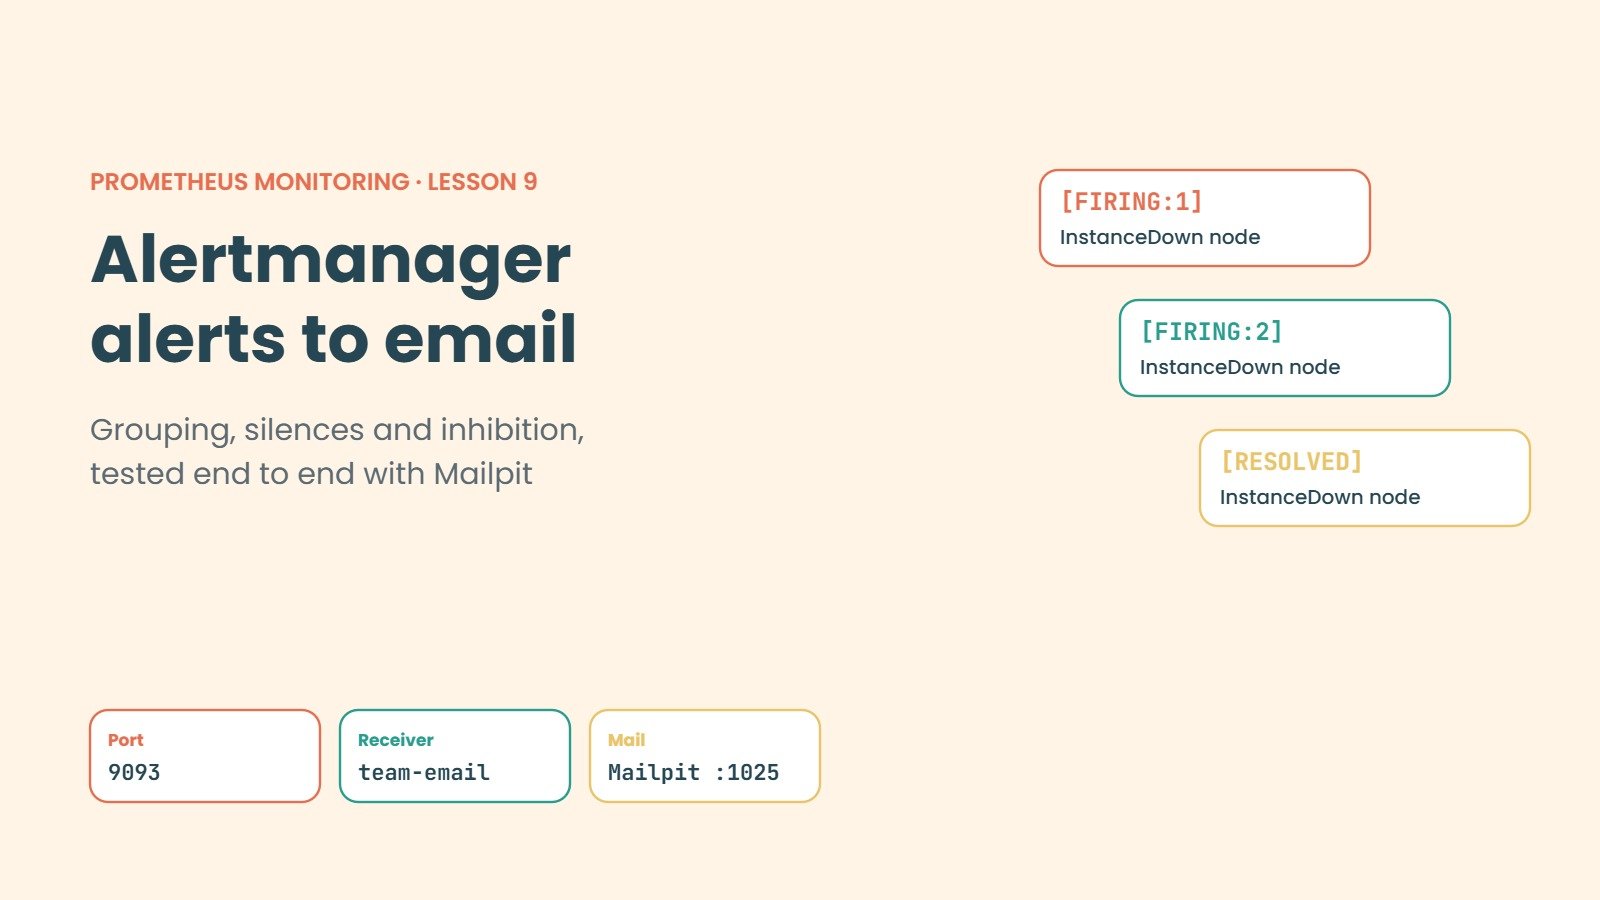
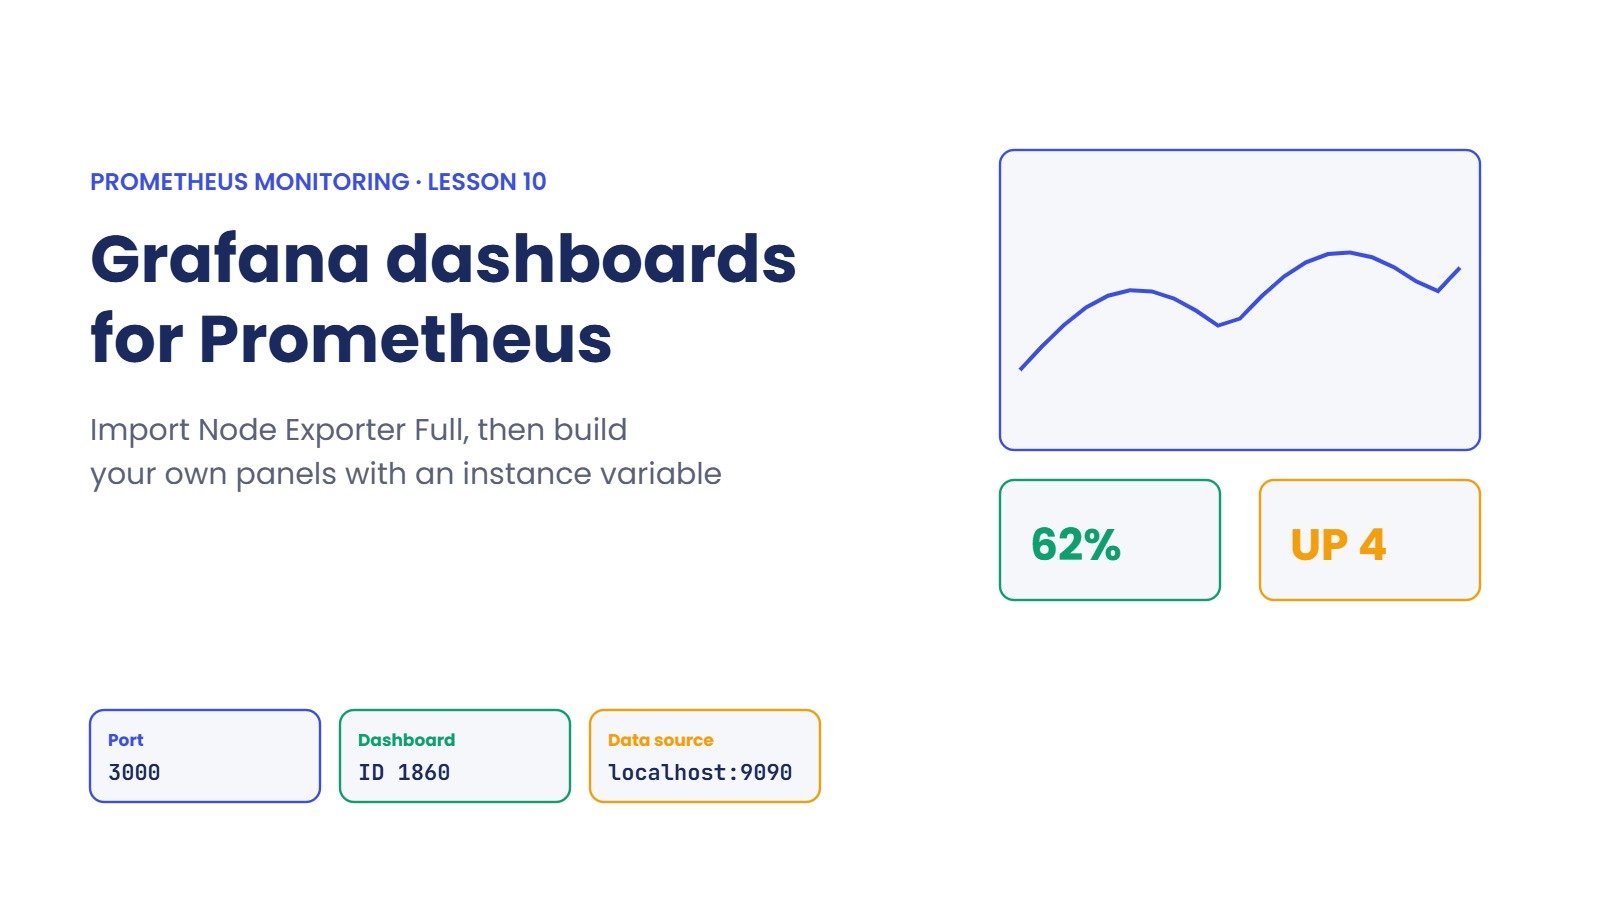
After that come storage and retention, recording rules, alerting rules and Alertmanager sending real email, and finally Grafana dashboards on top of your own data. Every lesson has a “Break It, Then Fix It” lab where you cause a real error and repair it, plus interview questions at fresher, mid and senior level.
What you need: a laptop with 8 GB of RAM and VirtualBox. You build two small Ubuntu Server VMs in Lesson 1 and use them for the whole course.
Who This Course Is For
- Freshers who want a first job in Linux, cloud or data centre operations
- System admins who are asked to set up monitoring and alerts
- Support and NOC engineers who watch dashboards and want to understand them
- Developers and DevOps engineers moving into SRE work
- Zabbix or Nagios users who want to learn the Prometheus way
What You Will Learn
By the end of this course, you will be able to:
- Explain how Prometheus pulls metrics and stores them as time series
- Install and run Prometheus, Node Exporter and Alertmanager as systemd services
- Protect Prometheus with Nginx, HTTPS and a password
- Write PromQL queries for CPU, memory, disk and network
- Keep storage under control with retention settings and recording rules
- Write alerting rules and route alerts to email with Alertmanager
- Build and import Grafana dashboards on top of Prometheus
Why Learn Prometheus?
Prometheus is a graduated project of the Cloud Native Computing Foundation and the default metrics system in Kubernetes setups, and it is used just as much for plain Linux servers, databases and network gear. Job adverts for Linux, DevOps and SRE roles ask for it by name, often together with Grafana.
Teams want engineers who can read a graph, write a PromQL query that answers a real question and set alerts that wake people only for real problems. Those are the skills this course builds, one lab at a time.
- Get hired for Linux admin, DevOps, SRE and NOC roles
- Find problems from graphs and alerts before users notice
- Write alerts that fire for real trouble and stay quiet otherwise
- Build a base for Kubernetes and cloud monitoring
- Talk about monitoring with confidence in interviews
Course Meta Information
Estimated Time: 10 lessons, about 10 hours
Difficulty: Beginner
Tracks: Monitoring
Categories: Monitoring
Further reading: Prometheus monitoring
Official documentation: Prometheus documentation, the PromQL reference and the Grafana documentation.
Related lessons and courses: Linux performance monitoring, Monitoring with Zabbix and the Linux Administration course.
-
Phase 1: Prometheus foundations and setup
-
Phase 2: Collect, query and store metrics
-
Phase 3: Alerts and dashboards