PromQL examples you will use every day
-
Phase 1: Prometheus foundations and setup
-
Phase 2: Collect, query and store metrics
-
Phase 3: Alerts and dashboards
These PromQL examples are the queries you’ll type again and again at work: CPU used per server, memory left, disk filling up, network traffic, targets that went missing. In Lesson 4 you got node_exporter running on prom01 and node01, so Prometheus already holds thousands of numbers. Now you learn to ask good questions of them, and to read the answers without guessing.
We’ll go slowly from the two kinds of vectors to label matchers, rate and friends, aggregation, and the joins that trip people up. Every query in the lab runs against your own two VMs through the web UI and through the HTTP API with curl and jq, because that’s how scripts and Grafana talk to Prometheus too.
Where this lesson fits
Lesson 5 of 10 in Prometheus Monitoring · Phase 2: Collect, query and store metrics · Before this: Lesson 4, scrape targets and Node Exporter · Next: Lesson 6, the Prometheus TSDB
| Time | You need | By the end you can |
|---|---|---|
| About 90 minutes | prom01 and node01 from Lesson 4, with job “node” scraping both on port 9100, and an SSH session to prom01 | Write the everyday CPU, memory, disk and network queries from memory, and fix the three PromQL errors that confuse most beginners |
What it is, in one line
PromQL is the query language of Prometheus: you pick series by name and labels, optionally take a window of their recent samples, and turn them into answers with functions, maths and aggregation.
In Simple Words
The electricity meter in your building
Every flat in an apartment block has an electricity meter, and the number on it only ever goes up. If you look at the meter today and it says 18,240 units, that number alone tells you nothing useful. What you want to know is how fast it’s climbing: 9 units a day in a normal week, 25 units a day when the AC is on all summer.
So the building secretary writes the reading down every evening. To find this week’s usage she takes the last seven readings, subtracts the first from the last and divides by seven. If she wants the whole building, she adds up all the flats.
If she wants the worst flat, she sorts them and looks at the top three.
That’s most of PromQL in one picture: the meter is a counter, the seven readings are a range vector, the daily usage is rate(), and “whole building” and “top three” are sum and topk.
Engineer's View
The four data types and how a query is evaluated
Every PromQL expression evaluates to one of four types. An instant vector is a set of series with one sample each, all at the same evaluation time. A range vector is a set of series with all their samples inside a time window, such as the last 5 minutes.
A scalar is a single number and a string is rarely used. Functions are strict about types, which explains most of the parse errors you’ll meet.
| Type | Written as | What you get back from the API | Typical use |
|---|---|---|---|
| Instant vector | node_load1 | resultType “vector”: one [timestamp, value] per series | Graphs, alerts, tables, almost everything |
| Range vector | node_load1[5m] | resultType “matrix”: a list of [timestamp, value] per series | Input to rate(), increase(), avg_over_time(), predict_linear() |
| Scalar | 42 | scalar(...) or a literal | Thresholds, maths |
| String | "text" | Only as function arguments | label_replace(), label_join() |
For an instant query, Prometheus picks the newest sample at or before the evaluation time for each series, as long as it is no older than the lookback delta (5 minutes by default, flag --query.lookback-delta). If a target stopped being scraped, its series disappear from instant queries after the scrape fails, because Prometheus marks them stale. A range query from Grafana or the Graph tab is the same instant query run again at every step across the time range.
Two flags in the HTTP API matter later: /api/v1/query takes query and an optional time, while /api/v1/query_range takes start, end and step. In Prometheus 3 the API also returns info and warning annotations, for example when you call rate() on something that doesn’t look like a counter.
How it works, step by step
1Select series with a name and label matchers
A selector picks series. The metric name is itself a label called __name__, and inside the braces you filter on any other label with four matchers.
| Matcher | Meaning | Example |
|---|---|---|
= | Equal | up{job="node"} |
!= | Not equal | up{role!="monitoring"} |
=~ | Regex match (anchored, so it must match the whole value) | node_filesystem_avail_bytes{mountpoint=~"/|/boot"} |
!~ | Regex does not match | node_filesystem_avail_bytes{fstype!~"tmpfs|overlay|squashfs"} |
Regexes use Go RE2 syntax and are anchored at both ends, so job=~"node" matches only “node” and never “node-old”. At least one matcher must be able to rule something out, which is why {job=~".*"} is refused.
2Add a window to get a range vector, then a function
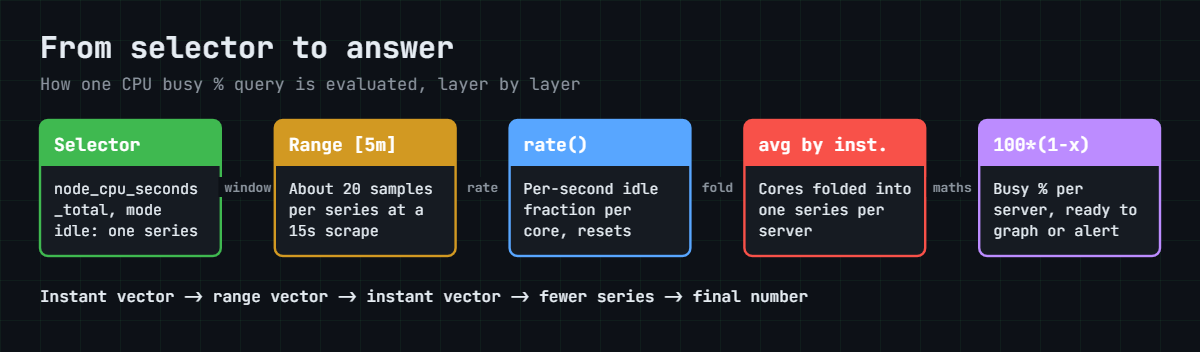
Put [5m] after a selector and each series now carries every sample from the last 5 minutes. With a 15 second scrape interval that’s about 20 samples per series. A range vector can’t be graphed directly, so you hand it to a function such as rate(), which turns it back into an instant vector with one value per series.
The diagram below follows one CPU query through those stages.
3Counters need rate(), irate() or increase()
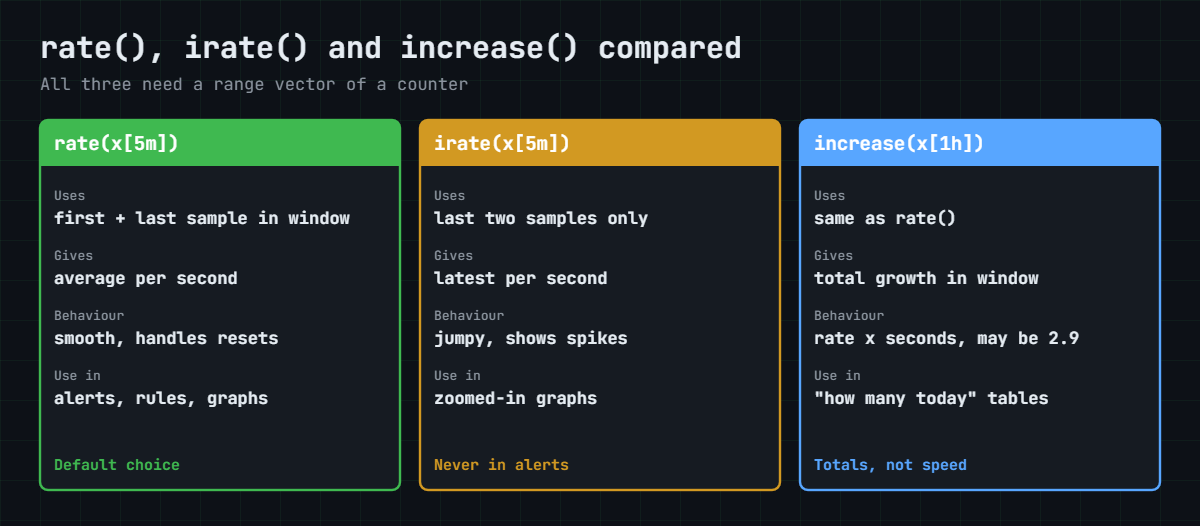
A counter such as node_network_receive_bytes_total only goes up, and drops to zero when node_exporter or the machine restarts. rate() looks at the first and last sample in the window, corrects for any resets, and gives you the average per-second increase. increase() is the same calculation multiplied by the window length, so increase(x[1h]) equals rate(x[1h]) * 3600. Both extrapolate a little to the edges of the window, which is why increase() can return 2.9 or 3.1 for something that went up by three events.
4Aggregate across labels with by and without
sum, avg, min, max, count, topk, bottomk and quantile collapse many series into fewer. sum by (instance) (...) keeps only the instance label; sum without (cpu, mode) (...) drops those two and keeps everything else, which is handy because it keeps job and role for you. The card below compares the three counter functions side by side.
5Maths and comparisons match series by their labels
When you write a / b, Prometheus pairs each series on the left with the series on the right that has the same labels (ignoring the metric name). If the label sets differ you tell it which labels to match with on(...) or which to ignore with ignoring(...). If one side has several series per match, you must say which side is “many” with group_left or group_right.
Comparison operators (>, <, == and friends) filter by default: node_load1 > 1 returns only the series above 1, with their real values. Add bool and you get every series back with the value 1 or 0 instead, which suits graphs and counting.
| You want | Query |
|---|---|
| CPU busy % per server | 100 * (1 - avg by (instance) (rate(node_cpu_seconds_total{mode="idle"}[5m]))) |
| Memory available % | 100 * node_memory_MemAvailable_bytes / node_memory_MemTotal_bytes |
| Disk used % per mount | 100 * (1 - node_filesystem_avail_bytes{fstype!~"tmpfs|overlay|squashfs"} / node_filesystem_size_bytes{fstype!~"tmpfs|overlay|squashfs"}) |
| Disk full in 24 h? | predict_linear(node_filesystem_avail_bytes{mountpoint="/"}[6h], 24*3600) < 0 |
| Network in, bytes per second | rate(node_network_receive_bytes_total{device!="lo"}[5m]) |
| Target missing completely | absent(up{job="node"}) |
Hands-on lab: everyday PromQL queries on prom01 and node01
Before you run any command, double-check it
Read every command twice before you press Enter. Check the target: the server name, the user, the disk or device name, the path and the sizes. These commands are for learning and were tested in our lab, not on your system. At work, run the read-only commands first, follow your change process, make sure a backup exists, and ask a second person to check anything that changes or deletes data. You run them at your own risk.
Everything here runs on prom01, against the Prometheus you set up in Lessons 2 to 4 (listening on 127.0.0.1:9090, so curl localhost:9090 needs no password). You can type the same queries into the Query page at https://prom01.lab/ from your laptop. The numbers on your screen will differ from mine; the shape of the answer is what you’re checking.
1Install jq and make your first API query
Run this on prom01:
sudo apt install -y jq
curl -s 'http://localhost:9090/api/v1/query?query=up' | jq '.status, .data.resultType, (.data.result | length)'You should see:
"success"
"vector"
3Three series: the prometheus job plus the two node targets. jq lets you pull out only the parts you want, so the next command prints each target on one line.
curl -s 'http://localhost:9090/api/v1/query?query=up' | jq -r '.data.result[] | [.metric.job, .metric.instance, .value[1]] | @tsv'node 192.168.56.61:9100 1
prometheus localhost:9090 1
node 192.168.56.60:9100 1✅ Checkpoint: The API returns status “success” and all three targets show 1.
2Instant vector versus range vector
Queries with braces, quotes and brackets are easier through --data-urlencode, which does the URL encoding for you. Ask for the idle CPU counter of one core on node01, first as an instant vector and then with a 1 minute window.
Run this on prom01:
Q='node_cpu_seconds_total{instance="192.168.56.61:9100",cpu="0",mode="idle"}'
curl -s localhost:9090/api/v1/query --data-urlencode "query=$Q" | jq -c '.data.resultType, .data.result[0].value'
curl -s localhost:9090/api/v1/query --data-urlencode "query=$Q[1m]" | jq -c '.data.resultType, .data.result[0].values'You should see this (your timestamps and numbers will differ):
"vector"
[1794112725.829,"758.61"]
"matrix"
[[1794112725.829,"758.61"],[1794112740.829,"773.09"],[1794112755.829,"787.59"],[1794112770.829,"802.19"]]The instant vector has one pair: a Unix timestamp and the value as a string. The range vector has every scrape in the window, 15 seconds apart, and the counter grows by about 14.5 seconds each time because core 0 sat idle for nearly all of those 15 seconds. Note that values come back as strings in JSON, so convert them if a script does maths.
✅ Checkpoint: You saw resultType “vector” with one value and “matrix” with four or so values 15 s apart.
3Filter with the four label matchers
Run this on prom01:
q(){ curl -s localhost:9090/api/v1/query --data-urlencode "query=$1" | jq -r '.data.result[] | [.metric.instance, (.metric.role // "-"), .value[1]] | @tsv'; }
q 'up{job="node"}'
q 'up{job="node", role!="monitoring"}'
q 'up{instance=~"192.168.56.6[01]:9100"}'
q 'up{instance!~".*:9100"}'You should see:
192.168.56.61:9100 app 1
192.168.56.60:9100 monitoring 1
192.168.56.61:9100 app 1
192.168.56.60:9100 monitoring 1
localhost:9090 - 1The small q shell function saves typing for the rest of the lab (it lasts until you close the SSH session). The last query keeps only targets whose instance does not end in :9100, which leaves Prometheus itself. Keep the role labels from Lesson 4 in mind, because they let you write role="app" instead of listing IP addresses.
✅ Checkpoint: Each matcher returned the targets you expected, and role!=”monitoring” left only node01.
4CPU busy % per instance
node_cpu_seconds_total counts seconds spent in each mode (idle, user, system, iowait and so on) for each core. The rate of the idle counter is the fraction of time the core was idle, so one minus the average idle fraction is the busy fraction.
Run this on prom01:
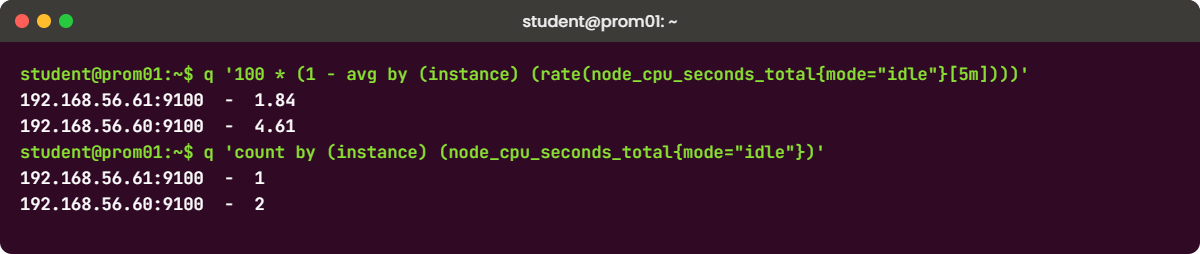
q '100 * (1 - avg by (instance) (rate(node_cpu_seconds_total{mode="idle"}[5m])))'
q 'count by (instance) (node_cpu_seconds_total{mode="idle"})'You should see this (your numbers will differ):
192.168.56.61:9100 - 1.84
192.168.56.60:9100 - 4.61
192.168.56.61:9100 - 1
192.168.56.60:9100 - 2The role column shows “-” now because by (instance) throws every other label away. The second query counts idle series per instance, which is a neat way to get the number of CPUs: 1 on node01 and 2 on prom01, matching the VM settings from Lesson 1. If you want to keep job and role, write avg without (cpu, mode) (...) instead.
✅ Checkpoint: You get a CPU busy % per instance, and the CPU count matches your VM settings.
5Memory available % and disk used %
Run this on prom01:
q '100 * node_memory_MemAvailable_bytes / node_memory_MemTotal_bytes'
FS='fstype!~"tmpfs|overlay|squashfs"'
curl -s localhost:9090/api/v1/query --data-urlencode "query=100 * (1 - node_filesystem_avail_bytes{$FS} / node_filesystem_size_bytes{$FS})" \
| jq -r '.data.result[] | [.metric.instance, .metric.mountpoint, (.value[1] | tonumber | floor)] | @tsv'You should see this (your numbers will differ):
192.168.56.61:9100 app 71.92
192.168.56.60:9100 monitoring 48.37
192.168.56.61:9100 / 38
192.168.56.61:9100 /boot 10
192.168.56.60:9100 / 44
192.168.56.60:9100 /boot 10Use MemAvailable, not MemFree: Linux keeps spare memory busy as page cache, so MemFree looks frighteningly low on a healthy server, and MemAvailable is the kernel’s own estimate of what programs can still get. For disk we use avail_bytes (space a normal user can write) rather than free_bytes, which also counts the 5% ext4 keeps for root. Both sides of the disk division have the same labels, so no on() is needed.
✅ Checkpoint: You see memory available % for both VMs and disk used % for / and /boot only, with no tmpfs rows.
6Network bytes per second: rate, irate and increase
Run this on prom01:
q 'rate(node_network_receive_bytes_total{device="enp0s8"}[5m])'
q 'irate(node_network_receive_bytes_total{device="enp0s8"}[5m])'
q 'increase(node_network_receive_bytes_total{device="enp0s8"}[1h])'You should see this (your numbers will differ):
192.168.56.61:9100 app 412.36
192.168.56.60:9100 monitoring 1873.05
192.168.56.61:9100 app 398.4
192.168.56.60:9100 monitoring 2240.67
192.168.56.61:9100 app 1481203.11
192.168.56.60:9100 monitoring 6735418.52node01 receives about 400 bytes a second on enp0s8: that’s Prometheus scraping it every 15 seconds. irate() uses only the last two samples, so it jumps around more and is good for spotting short spikes on a zoomed-in graph. rate() averages the whole window and is what you want in alerts and recording rules. The increase() result is bytes in the last hour, which is about 1.4 MB for node01; in the Graph tab multiply rate() by 8 if your team thinks in bits per second.
✅ Checkpoint: rate, irate and increase all return two series for enp0s8, and increase over 1h is roughly rate x 3600.
7Look back in time with offset and forward with predict_linear
Run this on prom01:
q 'node_load1'
q 'node_load1 offset 10m'
q 'predict_linear(node_filesystem_avail_bytes{mountpoint="/"}[1h], 24*3600)'You should see this (your numbers will differ):
192.168.56.61:9100 app 0.02
192.168.56.60:9100 monitoring 0.11
192.168.56.61:9100 app 0
192.168.56.60:9100 monitoring 0.07
192.168.56.61:9100 app 8724713472
192.168.56.60:9100 monitoring 12941312000offset 10m gives you the value as it was ten minutes ago, which is handy for “compared with yesterday” queries like rate(x[5m]) / rate(x[5m] offset 1d). predict_linear() fits a straight line through the last hour of free space and projects it 24 hours ahead, in bytes. A positive answer means the disk won’t fill in that time; Lesson 8 turns < 0 on this into the HostDiskWillFillIn24h alert.
predict_linear on a 1 hour window is easily fooled by one big file copy. For real alerts use a longer window such as [6h] and combine it with a "less than 20% space left" condition, as Lesson 8 does.
✅ Checkpoint: offset returns older values and predict_linear returns a positive number of bytes for / on both VMs.
8Comparisons, bool, topk and absent
Run this on prom01:
q 'node_load1 > 0.05'
q 'node_load1 > bool 0.05'
q 'topk(1, node_load1)'
q 'absent(up{job="node"})'
q 'absent(up{job="nodes"})'You should see this (your numbers will differ):
192.168.56.60:9100 monitoring 0.11
192.168.56.61:9100 app 0
192.168.56.60:9100 monitoring 1
192.168.56.60:9100 monitoring 0.11
- 1Without bool the comparison drops node01 because its load is below 0.05; with bool both come back as 0 or 1. absent(up{job="node"}) prints nothing because the series exist. absent(up{job="nodes"}) returns one series with value 1 and the label job="nodes" (its instance column is empty, because it has no instance label), which is how you alert when a whole job vanishes from the config or service discovery, a case up == 0 can't catch because there are no up series left to be 0.
✅ Checkpoint: bool returned 0/1 for both VMs, and absent() returned 1 only for the job name that doesn't exist.
9A first histogram_quantile
A histogram metric comes as a set of _bucket series with an le ("less than or equal") label, plus _sum and _count. Prometheus exposes one for its own HTTP API, so you can ask how long its query endpoint takes for 90% of requests.
Run this on prom01:
curl -s localhost:9090/api/v1/query --data-urlencode \
'query=histogram_quantile(0.9, sum by (le) (rate(prometheus_http_request_duration_seconds_bucket{handler="/api/v1/query"}[5m])))' \
| jq -c '.data.result'You should see this (your timestamp and number will differ):
[{"metric":{},"value":[1794113021.402,"0.09000000000000001"]}]About 90 ms for the 90th percentile. Rate the buckets first, then sum by le (keep le or the function has nothing to work with), then take the quantile. The answer is an estimate inside a bucket boundary (this histogram's buckets are 0.1, 0.2, 0.4 and so on), so 0.09 means "somewhere under 0.1 s".
✅ Checkpoint: histogram_quantile returned one value below 1 second.
10Graph tab habits that save time
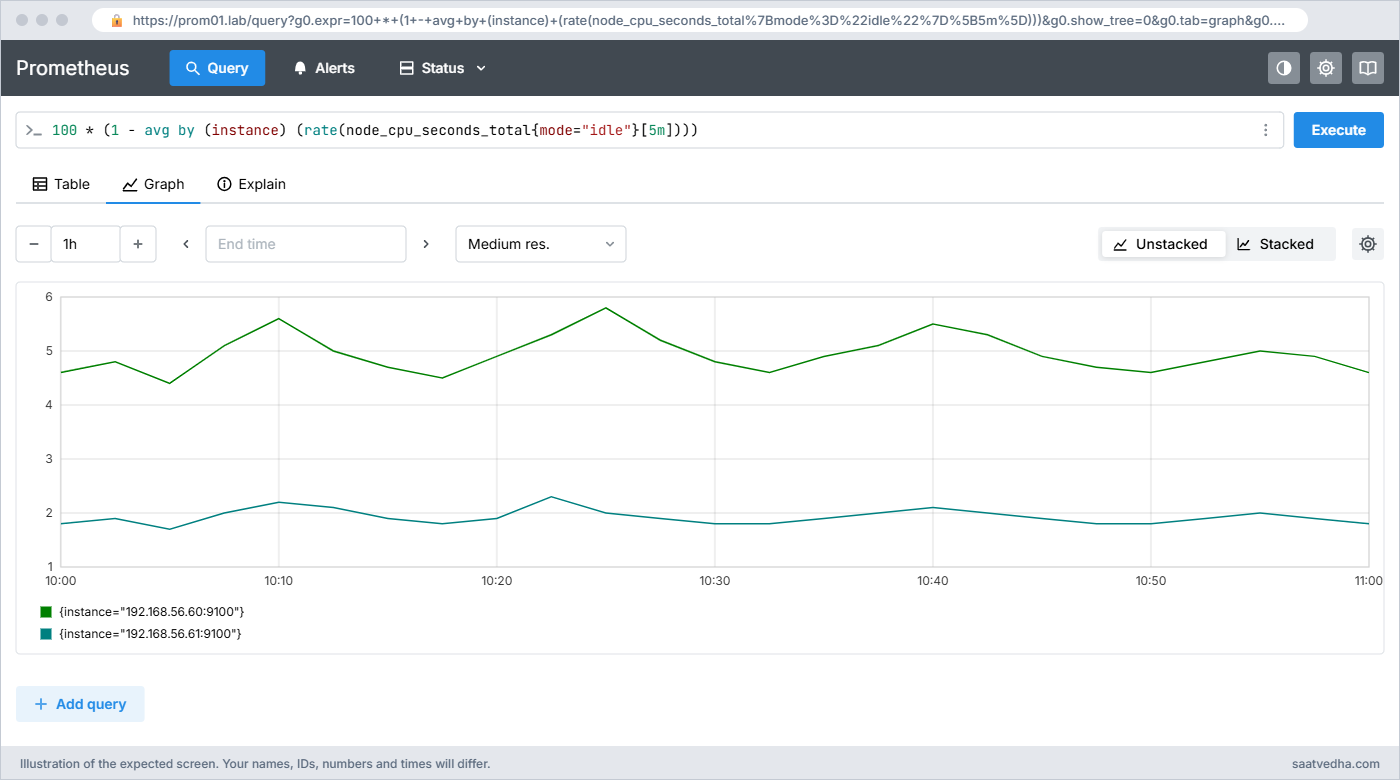
From your laptop open https://prom01.lab/, go to Query, paste the CPU query from step 4 and switch to the Graph tab. Set the range to 1h, then change [5m] to [1m] and back: a short window looks noisy and a long one looks smooth but late. Open the Explain tab (next to Table and Graph in the Prometheus 3 UI) to see how the expression breaks down, and open the three-dot menu at the right end of the query box and pick Explore metrics to search metric names instead of guessing.
One habit worth building: always start a new query with only the selector, check the table shows the series and labels you expect, and add functions one layer at a time. The table view also tells you how many series you're about to graph, so you don't freeze your browser with 3,000 lines.
✅ Checkpoint: You see two CPU lines in the Graph tab, and you know where Explain and Explore metrics are.
Break It, Then Fix It
These are the three PromQL failures I see most in code reviews and on-call chats. None of them can hurt your lab, so go ahead.
1“expected type range vector” and “ranges only allowed for vector selectors”
Run this on prom01:
curl -s localhost:9090/api/v1/query --data-urlencode 'query=rate(node_cpu_seconds_total)' | jq -r .error
curl -s localhost:9090/api/v1/query --data-urlencode 'query=sum(rate(node_cpu_seconds_total{mode="idle"}[5m]))[5m]' | jq -r .errorYou’ll get this error:
invalid parameter "query": 1:6: parse error: expected type range vector in call to function "rate", got instant vector
invalid parameter "query": 1:51: parse error: ranges only allowed for vector selectorsThe first query forgot the window, so rate() received an instant vector it can’t use. The second put [5m] after a function result, and a plain range can only follow a selector. The 1:6 part is line 1, character 6, which points you straight at the problem.
Fix:
rate(node_cpu_seconds_total[5m])
# a range over a function result needs a subquery, with a step:
max_over_time(sum(rate(node_cpu_seconds_total{mode="idle"}[5m]))[30m:1m])The [30m:1m] form is a subquery: run the inner expression every minute for the last 30 minutes and hand the results to max_over_time(). Use it sparingly, because it’s expensive; a recording rule (Lesson 7) is usually the better answer.
✅ Checkpoint: Both corrected queries return results with status “success”.
2rate() on a gauge gives nonsense
Run this on prom01:
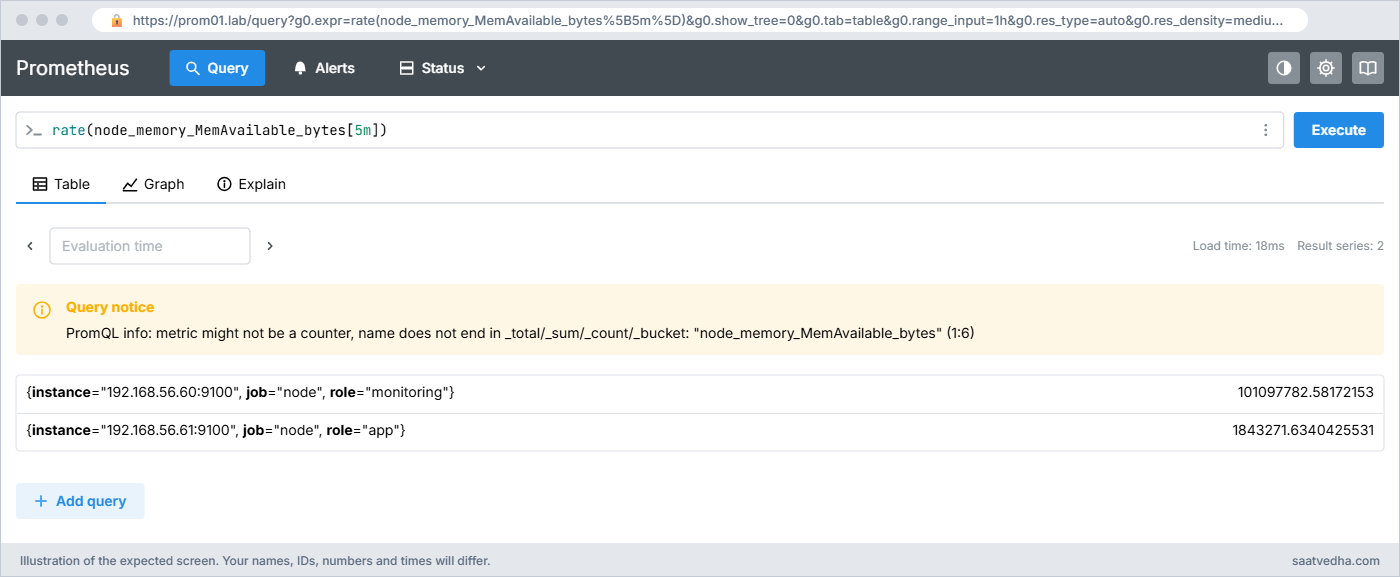
curl -s localhost:9090/api/v1/query --data-urlencode 'query=rate(node_memory_MemAvailable_bytes[5m])' | jq -c '.infos, .data.result[0].value'You’ll get this (a result, plus a hint):
["PromQL info: metric might not be a counter, name does not end in _total/_sum/_count/_bucket: \"node_memory_MemAvailable_bytes\" (1:6)"]
[1794113104.118,"101097782.58172153"]No error, and that’s the danger: a value of 101 MB per second looks like real data. rate() assumes the number only goes up, so every time available memory drops it treats the drop as a counter reset and adds the whole value again. Prometheus 3 returns an info annotation, which the UI shows as a yellow “Query notice” box above the result, but scripts and many dashboards ignore it.
Fix: use a gauge function instead:
deriv(node_memory_MemAvailable_bytes[15m]) # bytes per second, can be negative
delta(node_memory_MemAvailable_bytes[1h]) # change over the last hour
avg_over_time(node_memory_MemAvailable_bytes[5m]) # smoothed levelThe naming rule helps: counters end in _total (or _sum, _count, _bucket), and the # TYPE line on the /metrics page tells you for sure.
✅ Checkpoint: deriv() returns small positive and negative numbers and no info annotation.
3“many-to-many matching not allowed”
Try to get “disk available as a share of total RAM” (a silly question, but a common pattern when people join two metrics) by matching on instance only.
Run this on prom01:
curl -s localhost:9090/api/v1/query --data-urlencode 'query=node_filesystem_avail_bytes / on(instance) node_memory_MemTotal_bytes' | jq -r .error
curl -s localhost:9090/api/v1/query --data-urlencode 'query=node_filesystem_avail_bytes / on(instance) group_left node_filesystem_size_bytes' | jq -r .errorYou’ll get these errors (second one shortened):
multiple matches for labels: many-to-one matching must be explicit (group_left/group_right)
found duplicate series for the match group {instance="192.168.56.61:9100"} on the right hand-side of the operation: [{__name__="node_filesystem_size_bytes", device="/dev/sda2", fstype="ext4", instance="192.168.56.61:9100", job="node", mountpoint="/boot", role="app"}, {__name__="node_filesystem_size_bytes", device="/dev/mapper/ubuntu--vg-ubuntu--lv", ...}];many-to-many matching not allowed: matching labels must be unique on one sideEach VM has several filesystems but one MemTotal. In the first query the left side has many series per instance and the right side one, so Prometheus wants you to say group_left. In the second, both sides have several series per instance after on(instance) throws the mountpoint away, so there’s no way to pair them and Prometheus refuses.
Fix:
# many-to-one: say which side is "many"
node_filesystem_avail_bytes / on(instance) group_left node_memory_MemTotal_bytes
# same metric family on both sides: don't use on(), let all labels match
node_filesystem_avail_bytes / node_filesystem_size_bytes
# copy a label from an info metric onto every series
node_memory_MemAvailable_bytes * on(instance) group_left(nodename) node_uname_infoThe last line is the pattern you’ll use most: node_uname_info always has the value 1, so multiplying by it changes nothing except adding the nodename label (prom01, node01) to your result, which reads much better in a table than an IP address.
✅ Checkpoint: All three fixed queries return results, and the last one has a nodename label.
This happened at work
The dashboard that said 4 GB per second
A colleague of mine was on call at a fintech startup in Gurugram during a salary-day evening, when card payments peak. Around 7:30 pm a Grafana panel called “Memory growth” on the payments API hosts showed 4 GB per second and climbing, which would have filled those 16 GB servers in four seconds. She paged two more people before anyone noticed that the servers were perfectly calm in free -m.
The panel had been built months earlier by copying a network panel and swapping the metric name, so it read rate(node_memory_MemAvailable_bytes[1m]). On quiet days memory hardly moved and the graph looked plausible. On salary day the JVMs allocated and freed memory every few seconds, every small drop was treated as a counter reset, and the “rate” became a sum of fake resets.
The fix took two minutes: deriv() over 15 minutes for the growth panel, and a plain gauge panel of MemAvailable % next to it. The longer change was a short review checklist for dashboard pull requests: rate() only on names ending in _total, _count, _sum or _bucket, and anyone adding a panel has to look at the query result in the Query page table first. Prometheus 3’s info notes now catch most of these too, if you read them.
Common mistakes and troubleshooting
| Mistake | What happens | What to do instead |
|---|---|---|
| Graphing a raw counter like node_network_receive_bytes_total | A line that only climbs and drops to zero on restart, which tells you nothing | Wrap it in rate(…[5m]) for per-second speed or increase(…[1h]) for a total |
| Using a rate window shorter than two scrape intervals, like [15s] with a 15s scrape | Empty results or gaps, because rate needs at least two samples in the window | Use at least 4 times the scrape interval; [1m] for 15s scrapes, [5m] is the common default |
| sum() with no by clause on a multi-server query | All servers become one number and you can’t tell which one is in trouble | Write sum by (instance) or sum without (cpu, mode) to keep the labels you need |
| irate() in alert rules | Alerts flap because one noisy pair of samples decides the result | Use rate() in alerts and recording rules; keep irate() for zoomed-in graphs |
| Disk queries without an fstype filter | tmpfs, overlay and snap squashfs mounts fill the table and squashfs always shows 100% used | Add fstype!~”tmpfs|overlay|squashfs” or match the mountpoints you care about |
| Forgetting le in histogram_quantile after sum | NaN or “no data”, because the buckets were summed away | sum by (le) (rate(x_bucket[5m])), and add any other labels you want to keep next to le |
| Trusting a result without reading info and warning notes | Nonsense numbers from rate() on gauges go unnoticed | Look at the blue/yellow notes in the UI, or .infos and .warnings in the API JSON |
Interview questions
Click a question to open it. Each one is written the way an interviewer would ask it. Under it you will see why they ask it and one way you could answer, in your own words.
Fresher level
1. What is the difference between an instant vector and a range vector? Give me an example of each.
Why they ask this: They are checking the single idea that explains most PromQL errors.
How you might answer: An instant vector has one sample per series at the evaluation time, like node_load1, and that’s what you graph or alert on. A range vector has all the samples in a window per series, like node_load1[5m], and you can’t graph it directly.
Functions such as rate(), increase() and avg_over_time() take a range vector and give back an instant vector, which is why rate(node_cpu_seconds_total) without [5m] fails with “expected type range vector”.
2. How would you show CPU usage percentage per server using node_exporter metrics?
Why they ask this: A practical question; they want a working query and to see that you understand why it works.
How you might answer: node_cpu_seconds_total counts seconds per mode per core, so I take the rate of the idle mode over 5 minutes, which is the idle fraction per core. Then 100 * (1 – avg by (instance) (rate(node_cpu_seconds_total{mode=”idle”}[5m]))) gives busy percent per server.
Averaging across cores matters, because otherwise a 2-core box would show two lines. If I want to keep job and role labels I use avg without (cpu, mode) instead of by (instance).
2–5 years experience
3. A teammate says rate() and irate() are the same thing. When would you pick each one?
Why they ask this: They want to hear that you know how each one uses the samples and what that means for alerts.
How you might answer: rate() takes the first and last samples across the whole window and averages, handling counter resets, so it’s smooth and stable. irate() uses only the last two samples, so it reacts fast but jumps around.
I use rate() in alerts and recording rules, because irate() makes alerts flap. irate() is fine on a zoomed-in graph where I want to see a 30-second spike that a 5 minute rate would flatten.
4. Your query fails with “many-to-many matching not allowed”. Walk me through how you fix it.
Why they ask this: They are testing vector matching, which separates people who copy queries from people who understand them.
How you might answer: That error means after applying on() or ignoring(), both sides still have several series with the same match labels, so Prometheus can’t pair them. First I run each side alone in the table and look at which labels differ, for example mountpoint on filesystem metrics.
Then I either match on more labels so each pair is unique, aggregate one side down first, or if one side is a single series per instance I use group_left to mark the other as the many side. For adding labels I multiply by an info metric like node_uname_info with on(instance) group_left(nodename).
Senior level
5. A team wants an alert for “a whole job disappeared”. Why doesn’t up == 0 cover that, and what do you use?
Why they ask this: They are checking you understand that missing series and zero-valued series are different things.
How you might answer: up == 0 only works while the up series exist. If the job is removed from the config, service discovery returns nothing, or the relabelling drops every target, there are no up series at all and the alert expression returns empty, which looks like “all fine”.
So I add absent(up{job=”node”}) with a for of a few minutes, and for critical services also a count check like count(up{job=”node”}) < 2. For metrics that come and go between scrapes, absent_over_time(x[10m]) is the gentler version.
6. Grafana dashboards on our Prometheus are slow and the server CPU spikes when people open them. How do you investigate and what do you change?
Why they ask this: They want to see you connect query cost to series count, range length and step.
How you might answer: I’d look at which queries run, using the query log (query_log_file in the config) or prometheus_engine_query_duration_seconds, and check how many series each selector hits in the Query table. The usual problems are selectors without a job label, regex matchers on high-cardinality labels, long ranges at a tiny step, and subqueries.
Fixes are adding specific label matchers, a sensible min step in Grafana, and moving heavy expressions like CPU percent across 200 hosts into recording rules, so dashboards read one precomputed series per host.
Quick quiz
Q1. Which query gives the per-second network receive speed over the last 5 minutes?
- node_network_receive_bytes_total[5m]
- rate(node_network_receive_bytes_total[5m])
- sum(node_network_receive_bytes_total)
- delta(node_network_receive_bytes_total)
Show answer
B — rate() turns a counter range vector into a per-second average. The first is a range vector you can’t graph and the others are wrong functions or types.
Q2. What does up{instance=~”192.168.56.6[01]:9100″} match?
- Any instance containing 192
- Only instances starting with 192.168.56.6, any port
- The two node_exporter targets on .60 and .61, because the regex is anchored
- Nothing, regex isn’t allowed in label matchers
Show answer
C — Label regexes in PromQL are fully anchored RE2 expressions.
Q3. Why do you get “ranges only allowed for vector selectors”?
- You used rate() on a gauge
- You put [5m] after something that isn’t a plain selector, like a function result
- The lookback delta is too short
- Your job label is wrong
Show answer
B — A range can only follow a selector; over a function result you need a subquery like [30m:1m].
Q4. What is the result of node_load1 > bool 0.5?
- Only series with load above 0.5
- All series, each with value 1 or 0
- A single scalar
- An error, bool needs a range vector
Show answer
B — bool turns the filtering comparison into one that returns every series with 1 for true and 0 for false.
Q5. Which query alerts when the “node” job disappears entirely?
- up{job=”node”} == 0
- absent(up{job=”node”})
- count(up) == 0
- rate(up[5m]) == 0
Show answer
B — absent() returns 1 when no series match, which up == 0 can’t detect because there are no series to compare.
Quick recap
- An instant vector has one sample per series; a range vector like [5m] has a window of samples and must go into a function such as rate().
- Label matchers =, !=, =~ and !~ pick series, and regexes are anchored to the whole value.
- Use rate() for counters in alerts and graphs, increase() for totals, irate() only for zoomed-in spikes, and deriv() or delta() for gauges.
- sum, avg, topk and friends with by or without decide which labels survive, and joins need on(), ignoring() and group_left when label sets differ.
- You can run any query through /api/v1/query with curl and jq, and Prometheus 3 adds info notes that warn you about rate() on non-counters.
Next lesson
Lesson 6: Prometheus TSDB: storage, retention and deleting series → You look inside /var/lib/prometheus: the head block, WAL and 2 hour blocks, how retention works, how to size the disk and how to delete series safely.
Further reading: PromQL examples
Want to go deeper into PromQL examples? The official querying basics, operators and vector matching, functions and HTTP API pages are the reference for everything in this lesson. If you need a refresher on where these metrics come from, go back to Scrape targets and Node Exporter, and for the Linux meaning of load, iowait and MemAvailable see Linux performance monitoring.
You can also see the full plan for this course on the Prometheus Monitoring course page.
